Data analysis tools are software or platforms that collect, process, analyze, and visualize data to uncover insights and support data-driven decision-making.What are the top 10 data analysis tools you should know in 2026? Here are the list:
- FineBI
- Python
- R
- Microsoft Power BI
- Tableau
- Apache Spark
- SQL
- Google BigQuery
- KNIME
- Qlik Sense
You will see SQL, Python, Tableau, and Power BI as top choices for making decisions with data. More companies now use AI-powered data analysis tools. This is because technology is better and rules have changed. To use your data well, you need to learn new skills. You also need to think with a data-driven mindset. Learning tools like FineBI from FanRuan helps you change raw data into useful information. You can make smarter and faster choices with data. Think about the tools you use now. Are you ready to find new answers in 2026?
- Most widely used tools:
- SQL helps with big data sets
- Python is good for cleaning and studying data
- Tableau and Power BI help with advanced analytics
- AI adoption trends:
- More companies use AI data analysis tools
- This is because tech is better and rules have changed
- Common challenges:
- Learning new data tools is hard
- Companies must follow rules and train workers
- It is tough to change to a data-driven way of working
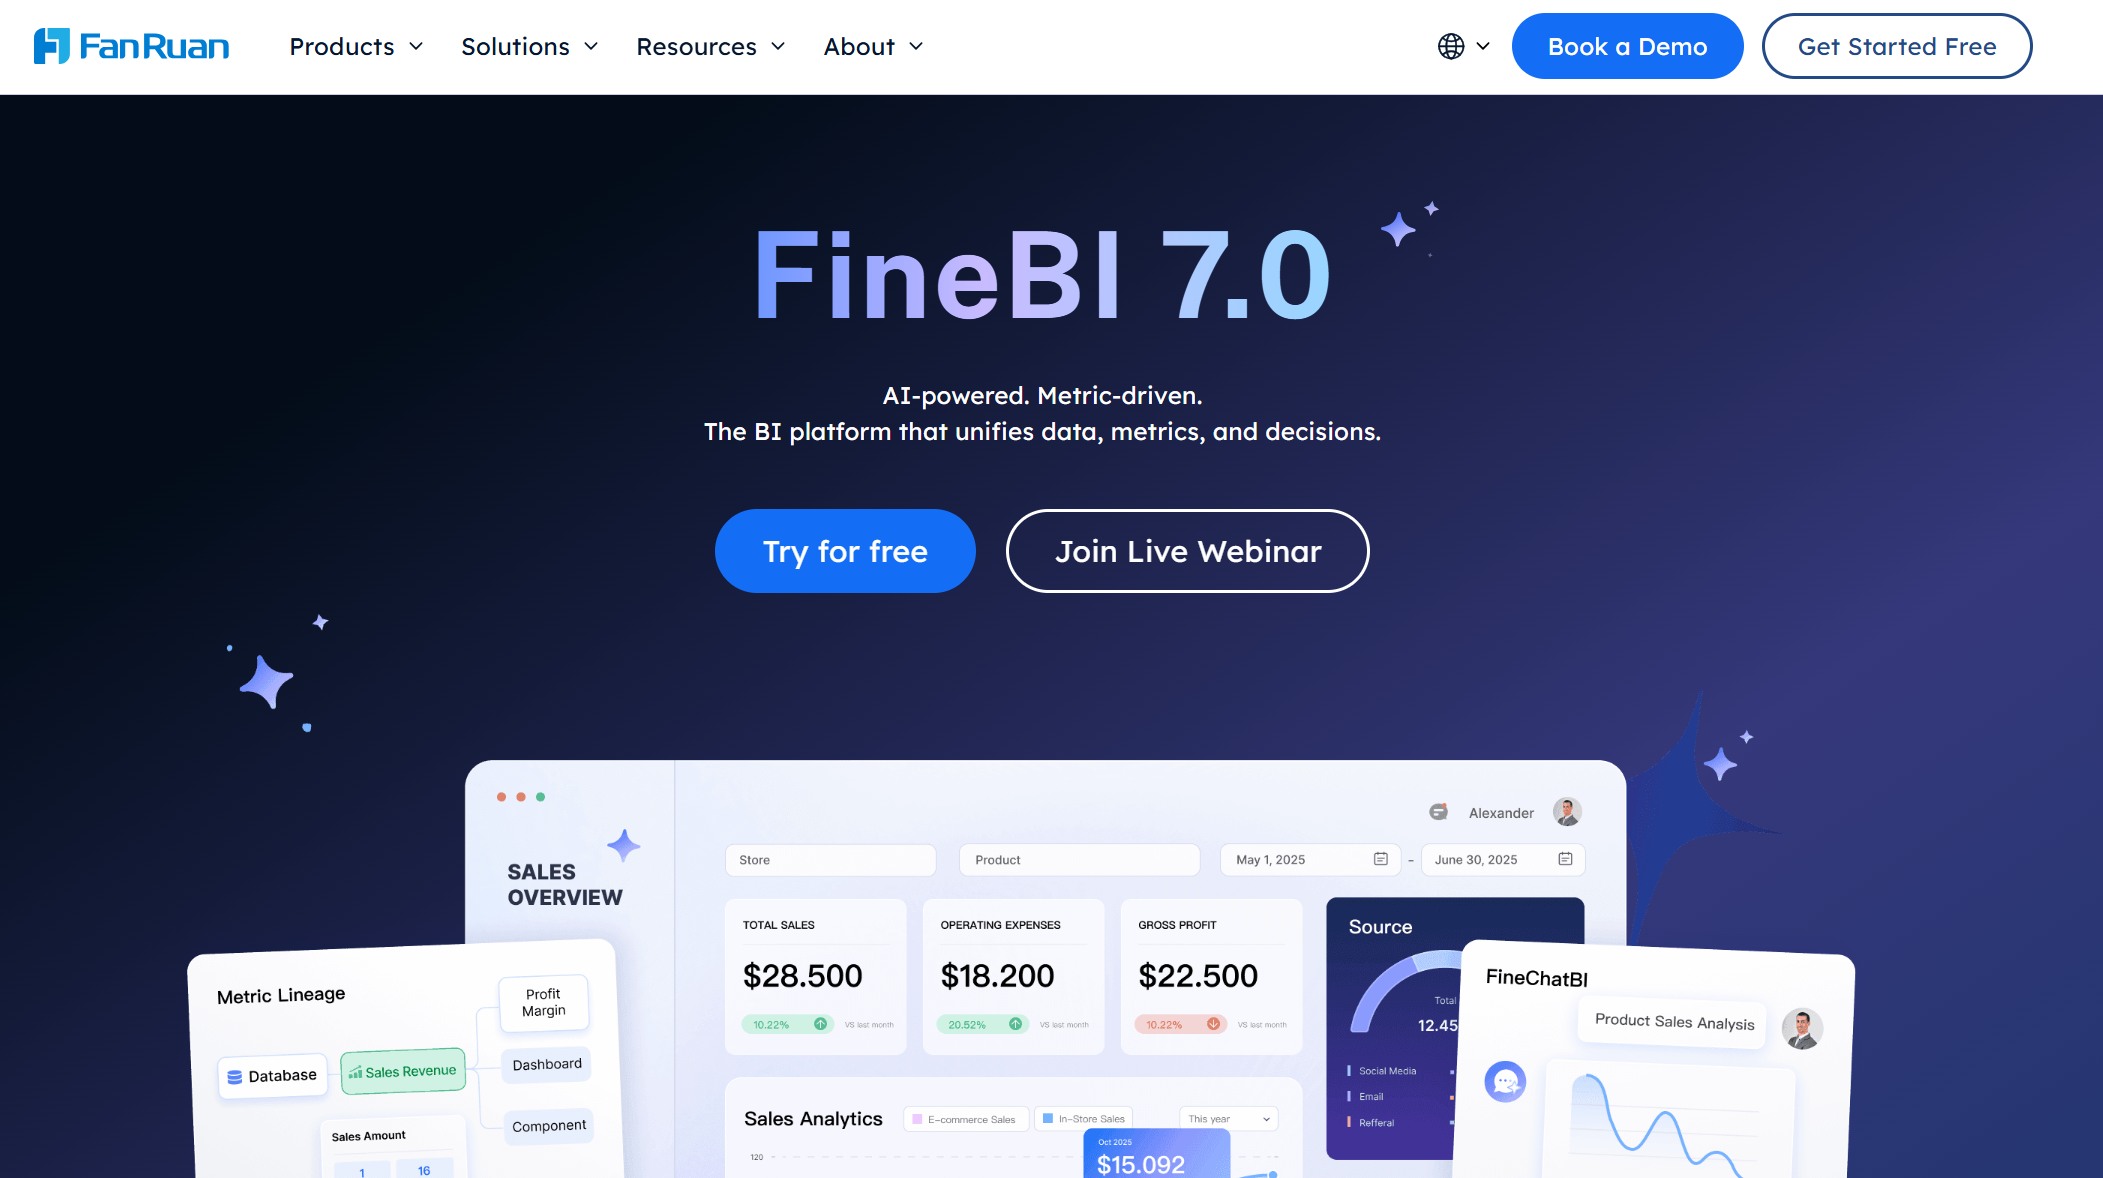
1. FineBI: Next-Gen Data Analysis Tool
Self-Service Analytics
You want a tool that makes working with data easy. FineBI gives you that power. You can connect to many sources, like databases, cloud storage, or even Excel files. You do not need to write code. Just drag and drop your data to build dashboards. FineBI helps you clean, join, and explore your data in one place. You can make charts, maps, and tables with a few clicks. If you need to share your work, FineBI lets you publish dashboards for your team. Everyone can see the same numbers and make smart choices together.
Website: https://www.fanruan.com/en/finebi
Tip: FineBI works on your computer, tablet, or phone. You can check your analytics anywhere.
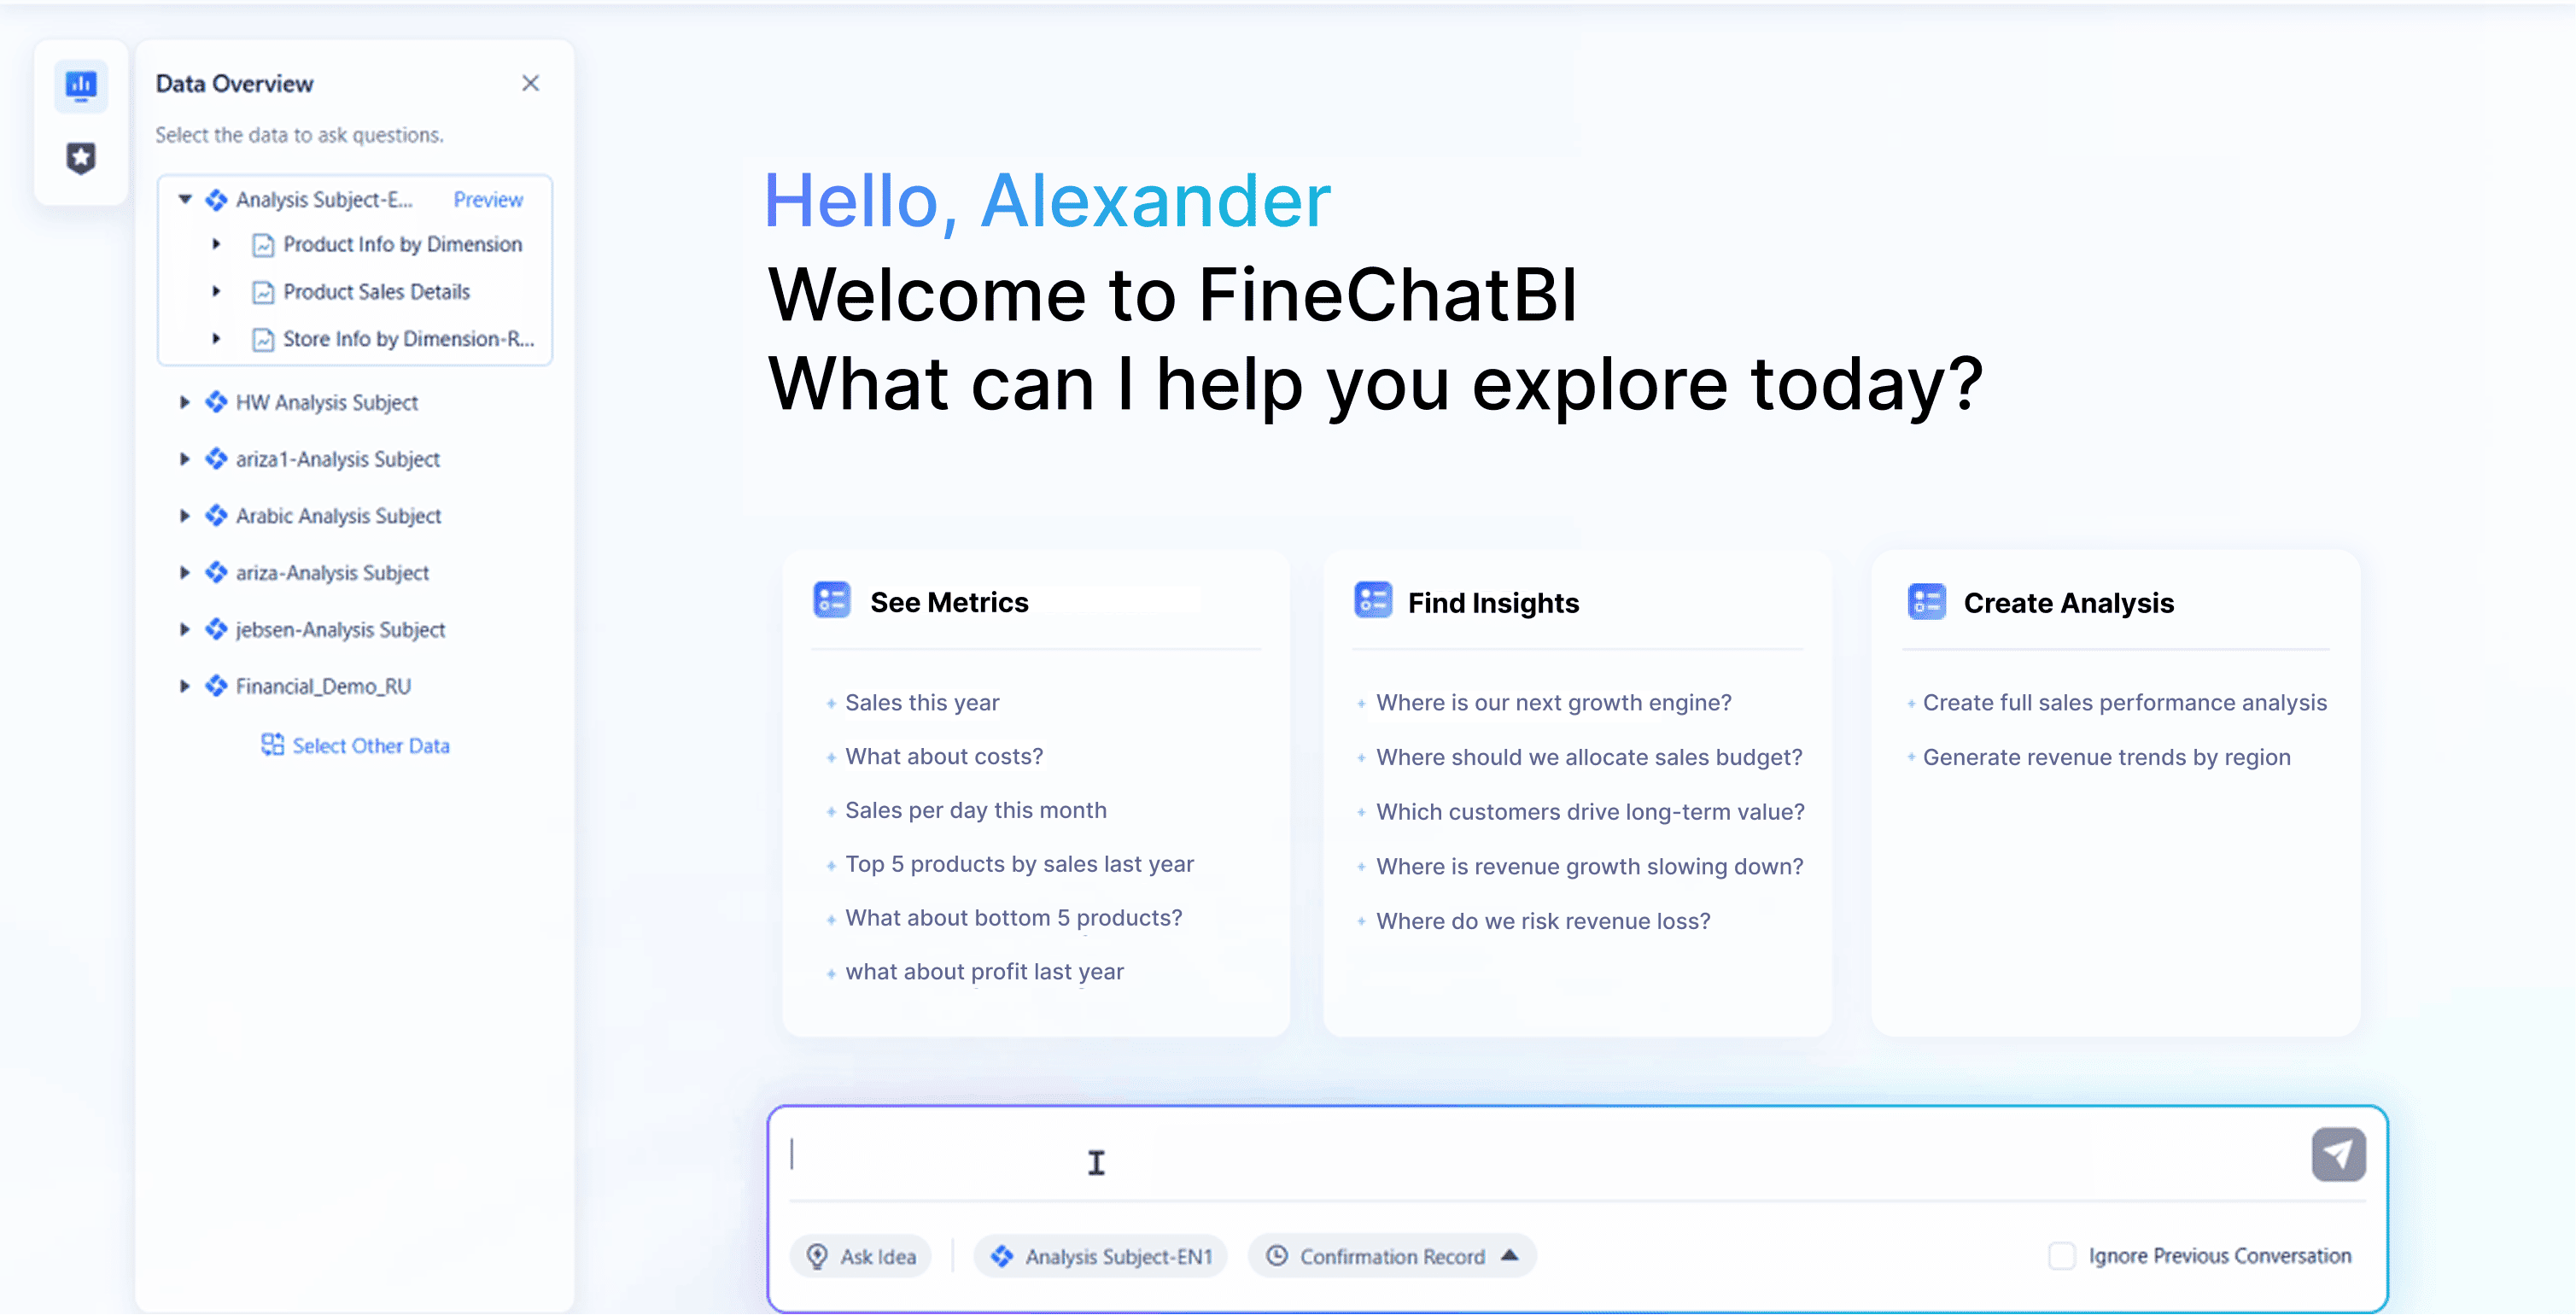
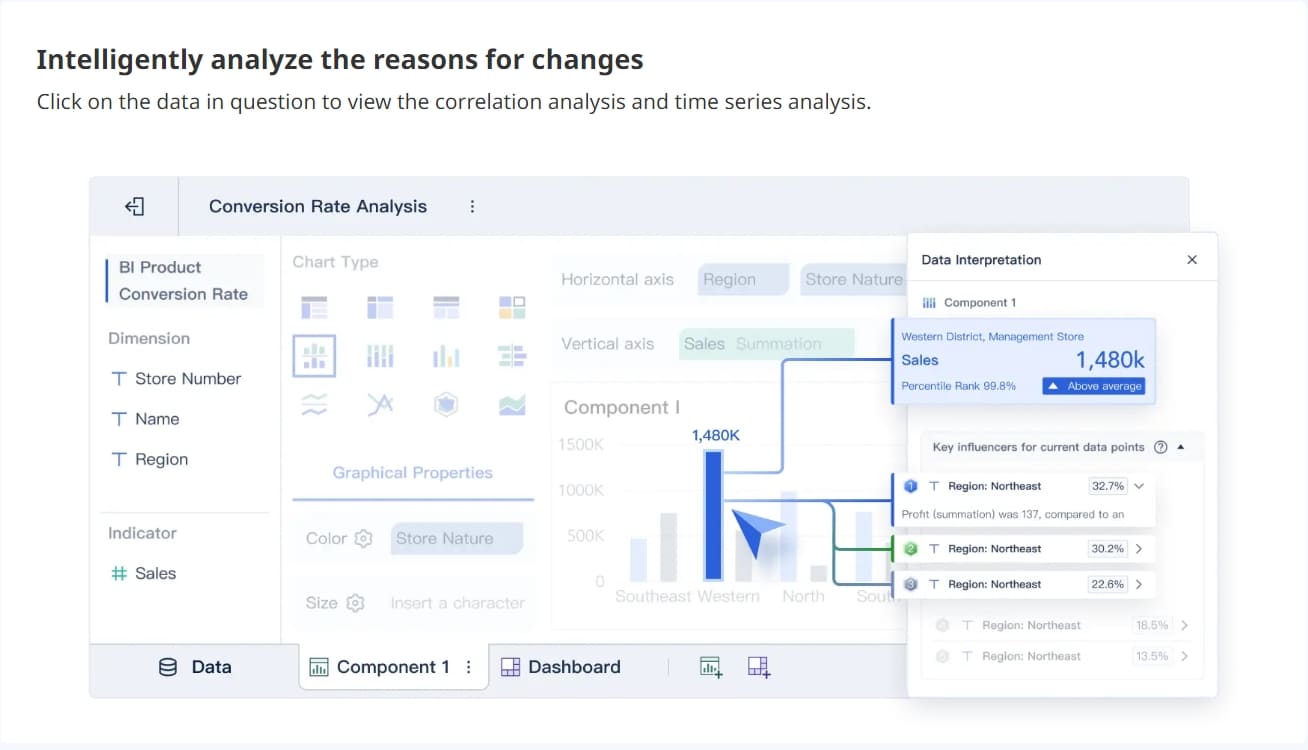
AI Data Analysis Tools in FineBI
FineBI stands out because it brings ai data analysis tools right to your fingertips. You can ask questions in plain language and get answers fast. FineChatBI, a special feature in FineBI, lets you chat with your data. You type a question, and the tool shows you charts or numbers right away. These ai data analysis tools help you spot trends, find problems, and even predict what might happen next. You do not need to be a data expert. FineBI’s ai data analysis tools make analytics simple for everyone. You save time and get better insights.
Real-World Impact: BOE Customer Story
Let’s look at how FineBI helps real companies. BOE, a leader in the tech world, used FineBI to fix their data problems. They had data in many places and could not see the full picture. With FineBI, they built a single place for all their data. They set up dashboards to track key numbers. This helped them cut inventory costs by 5%. Their teams worked faster and made better decisions. FineBI’s analytics gave BOE the tools to grow and stay ahead. If you want results like BOE, FineBI is a smart choice among data analysis tools.


2. Python Data Analysis Tools
Python is the top tool for data analysis in 2026. If you want to be a data analyst, you will use Python a lot. You can use it for easy reports or hard analytics. Many companies like Python because it is simple to learn. It also has strong libraries. You do not need to be a coding expert to use Python for data analytics.

Website: https://www.python.org/
Key Features
Python’s main libraries give you lots of help. These tools let you clean, look at, and show your data. Here are some important ones you will use as a data analyst:
- Pandas helps you sort and pick your data easily.
- NumPy lets you work with numbers and big data sets.
- Matplotlib lets you make charts and graphs.
- SciPy helps with hard math and science problems.
Tip: You can use these libraries together for many data tasks. This makes Python a flexible tool for all kinds of projects.
Python’s easy code and big community make it very popular. You will see it in many data analytics platforms, from small startups to big tech companies.
Use Cases in 2026
In 2026, Python is used everywhere for data work. You can use it to find patterns and trends in your data. Python also helps you build machine learning models and make reports. You can use it to create dashboards too. Many teams use Python with other data tools and platforms.
If you want to test ideas or build custom analytics, Python lets you try new things. You can use it to answer business questions or check your data. Python can also help with AI-driven analytics. With Python, you can turn raw data into clear answers. This helps your team make better choices.
3. R Data Analysis Tools
R is a top pick for people who work with data. You can find R in schools, labs, and big companies. R gives you strong tools to look at numbers. You can use R to make graphs, test ideas, and build models. R helps you turn messy data into clear answers.
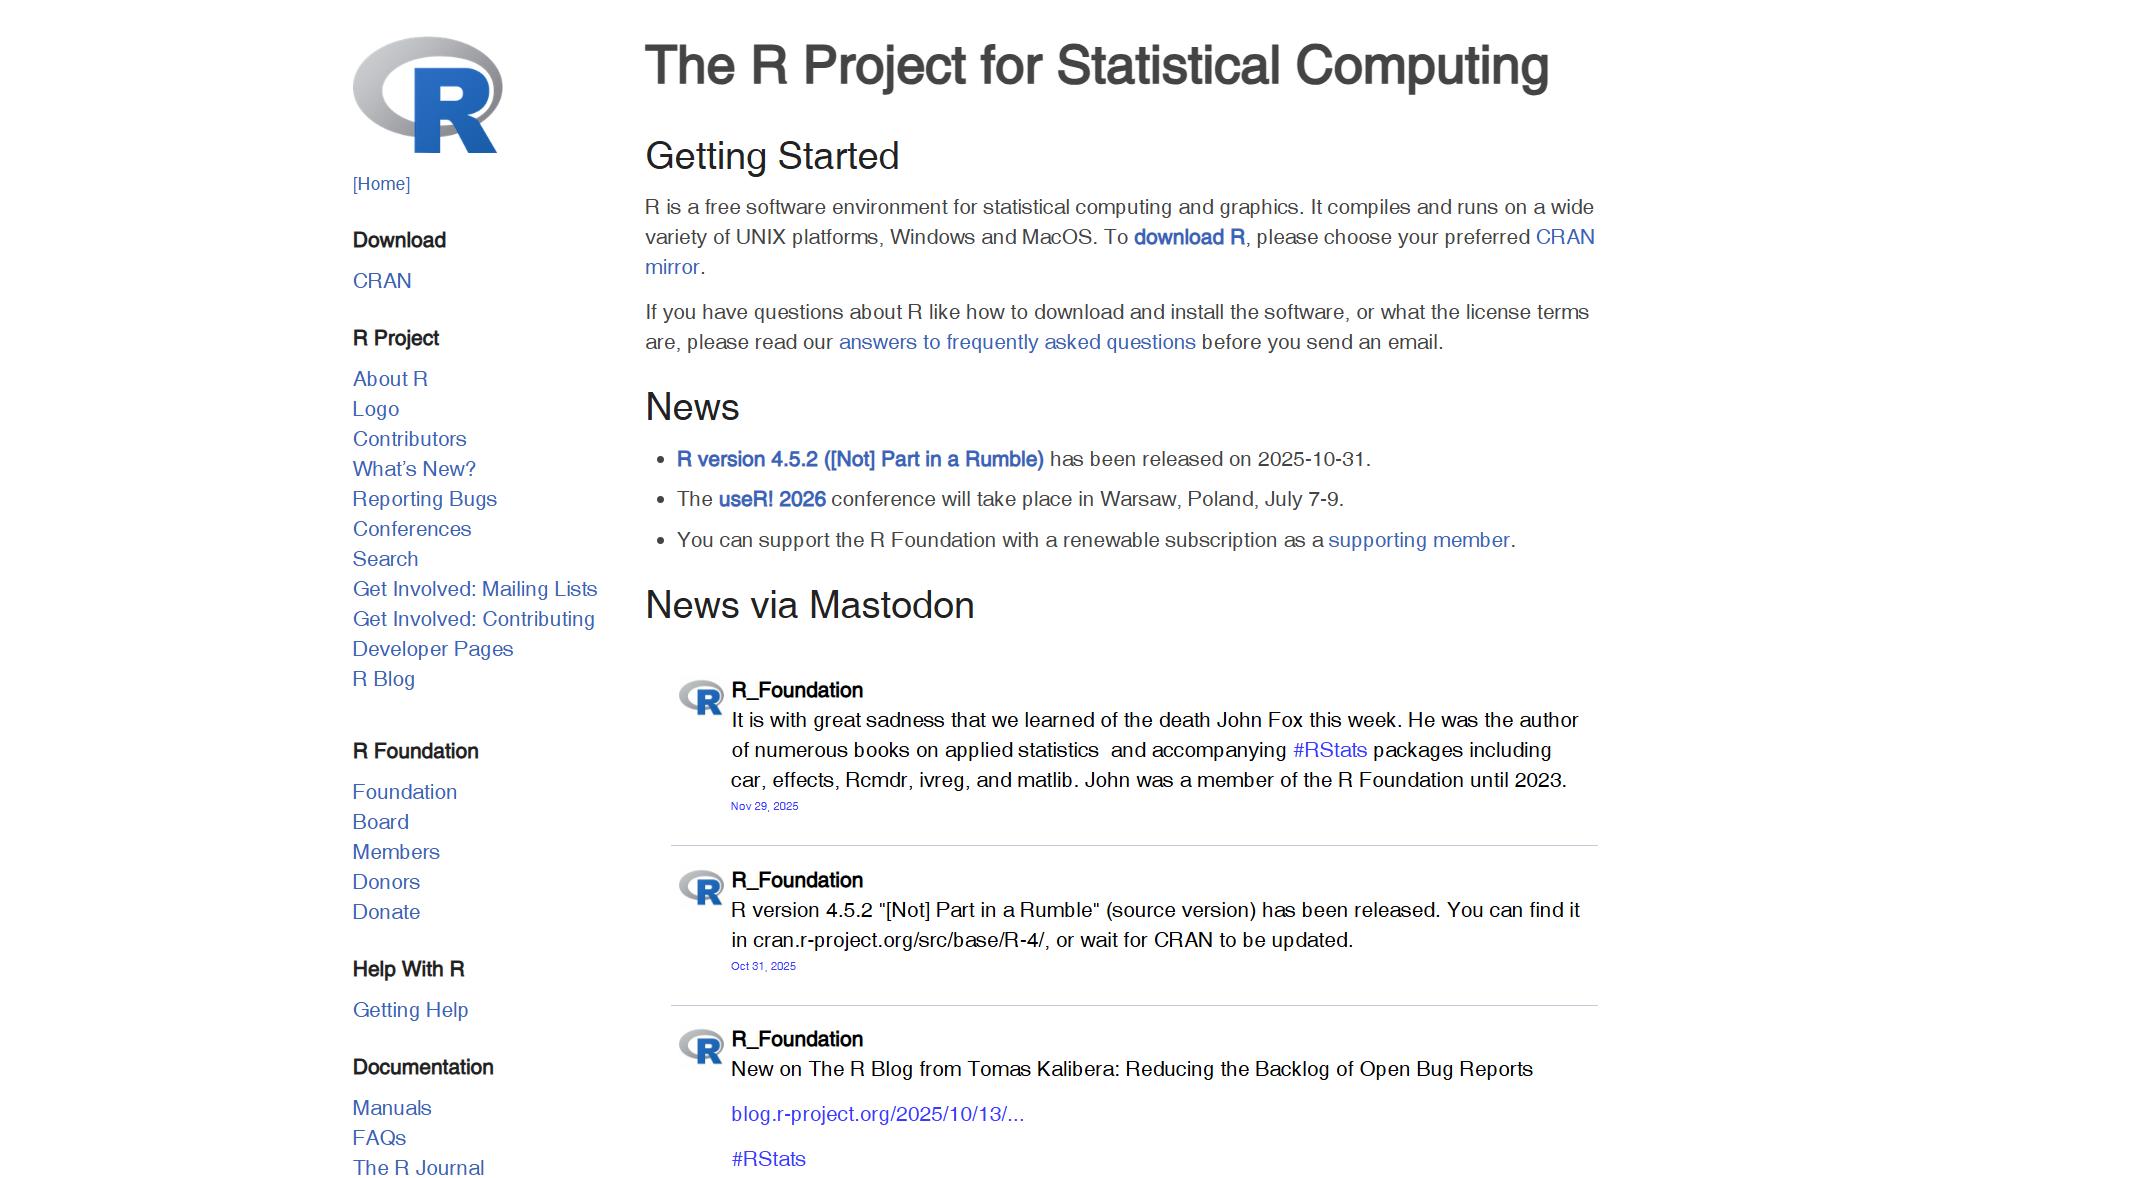
Website: https://www.r-project.org/
Main Features
R is open-source, so you do not pay to use it. You can also change the code if you want. The R community is very big. If you have a problem, you can ask for help online. People answer fast. R works for many jobs. You can use it for data science, making pictures, or business analytics. The syntax is easy to learn. If you know other coding languages, you can learn R fast. R lets you repeat your work easily. You can share your code and results with others.
Here is a table that shows why R is a great tool for data analysis in 2025:
| Advantage | Description |
|---|---|
| Open-source | R is free to use and change, so it is easy for everyone. |
| Community Support | Many people online can help you with questions. |
| Versatility | R works for data science, math, and making graphs. |
| User-friendly | The code is simple and easy for new users. |
| Reproducibility | R helps you do clear and repeatable data work for research. |
Tip: R makes it simple to share your reports. Others can check and use your work.
Statistical Analysis
You can use R for many kinds of data work. R is very good for statistics. You can test ideas, build models, and look for patterns. Many classes teach you how to use R for real problems. For example, you can learn to study life science data, look at economics, or model hard systems.
Here is a table with some popular ways people use R for analytics in 2026:
| Course Name | Description | Key Skills Learned |
|---|---|---|
| Statistics for Life Sciences in R Course | Workshop for looking at biology data with R and UNIX tools | Making graphs, testing ideas, building models |
| ESF:MPE_AVED Data Analysis & Visualization | Class for working with and showing economic data | Getting data, cleaning it, and looking for trends |
| STEMskiller - Data analysis | Intro to research and modeling with R | Math and research skills, building models |
You can use R to clean data, make graphs, and test ideas. R helps you find trends and make guesses about the future. If you want to work in research, business, or science, R gives you what you need to do well.
4. Microsoft Power BI
Visualization Capabilities
Power BI helps you make great data pictures. You can turn raw data into clear and colorful charts. These charts help you see trends quickly. The platform gives you many ways to show your data. You can make bar charts, line graphs, maps, and even special visuals. If you want to learn more, you can click on a chart to see more details. This is called drilling down.

Website: https://www.microsoft.com/en-us/power-platform/products/power-bi
Here are some things that make Power BI special for working with data:
- You can use it with Microsoft tools like Excel and Azure. This makes your work easier.
- The interface is simple, so you do not need much training.
- Dashboards update in real time, so your data is always fresh.
- You can use colors and rules to highlight important numbers.
- You can add pictures from your computer or safe places.
- Map Editor and Label Designer help you change how maps look.
These features help you make dashboards that everyone can understand. Power BI keeps your data safe with strong security. You do not have to worry about sharing private information.
Integration and Sharing
Power BI is great for teamwork. You can connect to many data sources, like cloud services or files on your computer. This means you can see all your data in one place. Sharing is easy. You can publish dashboards and reports for your team to see new updates.
See how different industries use Power BI for analytics:
| Industry | Company | Use Case Description |
|---|---|---|
| Finance | Liberty Mutual | Used Power BI for legal trend analysis and reporting. |
| Food | Smithfield Foods | Used Power BI to look at data from many brands. |
| Agriculture | Cargill | Liked Power BI because it is easy and good for modeling data. |
| Healthcare | Ecolab | Gave sales insights to workers using Power BI with Dynamics. |
| Transportation | Heathrow Airport | Used Power BI to help with logistics problems. |
| Banking | Metro Bank | Used Power BI to make customers happier with better analytics. |
You can use Power BI for small groups or big companies. Updates come often, so your tools stay new. Power BI is a smart way to save money and make better choices every day.
5. Tableau Data Analysis Tools
Tableau stands out as one of the most popular data analysis tools in 2026. If you want to turn numbers into stories, you will love what tableau can do. You get to work with data in a way that feels creative and fun. Tableau gives you the power to see patterns, trends, and answers right away.
Website: https://www.tableau.com/
Interactive Dashboards
You can build interactive dashboards in tableau that make your data come alive. These dashboards let you click, filter, and zoom in on details. You do not just look at numbers—you explore them. When you use tableau, you can set up alerts that tell you when your data hits a certain goal. This helps you act fast and stay ahead.
Here is a table that shows some of the coolest features you get with tableau for interactive dashboards:
| Capability | Description |
|---|---|
| Artistic Data Visualization | You can design your dashboard like an artist, making your data look amazing. |
| Integration with Machine Learning | Tableau now uses machine learning to give you smarter analytics and deeper insights. |
| Dynamic Dashboards | You can build dashboards that change as your data changes, showing trends in real time. |
| Data-Driven Alerts | Get alerts when your data reaches important numbers, so you never miss a thing. |
| API for Extensions | You can add more tools to tableau, making your dashboards even more powerful. |
Tip: Try using filters and drill-downs in your interactive dashboards. You will find answers you did not expect!
Data Exploration
Tableau makes data exploration easy for everyone. You do not need to be a data scientist to use it. You can drag and drop your data, try out different charts, and see what works best. If you want to dig deeper, tableau lets you connect to many data sources at once. You can blend data from spreadsheets, databases, or even cloud apps.
Exploration in tableau feels like a journey. You start with a question, and you follow the data wherever it leads. You can test ideas, spot outliers, and share your findings with your team. Tableau helps you turn raw data into clear answers. You will find that analytics becomes a daily habit, not just a special project.
If you want to get better at data visualization and analytics, tableau is a great place to start. You will enjoy the freedom to explore, create, and share—all in one tool.
6. Apache Spark
Apache Spark is a favorite tool for anyone who works with big data. You can use Spark to handle huge amounts of data quickly. If you want to run analytics on millions of records, Spark helps you do it fast. Many companies pick Spark because it makes data work simple and powerful.
Website: https://spark.apache.org/
Speed and Scalability
You want your data to move fast. Spark gives you that speed. It can read and process data from many sources at once. When you use Spark, you can scale up your analytics as your data grows. You do not have to worry about slow reports or waiting for results.
Here are some ways Spark boosts speed and scalability:
- Spark uses memory to keep data close, so you get answers faster.
- You can add more computers to your Spark cluster. This means you can handle more data without slowing down.
- With Azure HDInsight IO Cache, Spark reads data from SSDs. Most SSDs give you over 1 GByte per second of bandwidth. This makes your analytics even quicker.
- When you turn on IO Cache, Spark reads data locally. This lowers wait times and uses all the bandwidth, so your jobs finish faster.
Tip: If your team needs to process lots of data every day, Spark helps you keep up with the pace.
Big Data Processing
Spark shines when you need big data processing. You can use it for data cleaning, joining, and transforming. Spark works well with many data types, like text, images, or numbers. You can run analytics on streaming data or batch data. This means you can see trends in real time or look back at old data.
Here is a table that shows what you can do with Spark:
| Task | What Spark Does for You |
|---|---|
| Data Cleaning | Fix messy data fast |
| Data Transformation | Change data into the shape you need |
| Real-Time Analytics | Watch data as it comes in and spot trends early |
| Machine Learning | Build models right on your big data |
You do not need to be a data scientist to use Spark. The tools are friendly, and you can start with simple jobs. As your skills grow, you can try more advanced analytics. Spark helps you turn raw data into answers that matter.
7. SQL for Data Analysis
SQL is one of the most important skills you can learn for working with data. You see SQL everywhere in the world of analytics. If you want to find answers in your data, SQL helps you get there fast. You can use SQL to pull information from big databases, check for errors, and even clean up messy data. Many companies trust SQL because it works well with all kinds of data.
Querying Data
When you use SQL, you write simple commands to ask questions about your data. You can select rows, filter columns, and sort results. For example, you might want to see all sales from last month or find customers who bought a certain product. SQL makes these tasks easy. You do not need to be a computer expert to start. Here is a quick example:
SELECT name, sales
FROM customers
WHERE sales > 1000
ORDER BY sales DESC;
This code finds customers with sales over 1000 and sorts them from highest to lowest. You can use SQL for many types of data processing, like joining tables or grouping numbers. If you work with analytics, you will use SQL almost every day.
Tip: Practice writing SQL queries with your own data. The more you try, the better you get!
Timeless Skills
SQL never goes out of style. You will find it in every industry that uses data. If you want a job in analytics, SQL is a must-have skill. Companies look for people who know how to use SQL to handle data. Here is a table that shows what top jobs want:
| Position | Requirement |
|---|---|
| Chief Data Analyst | Proficiency in the application of analytical tools (e.g. R, Python, SQL) |
| Senior Data Analyst | Working experience and advanced knowledge of SQL and Python is mandatory. |
You can see that SQL is key for moving up in your career. When you know SQL, you can work with big data sets, build reports, and help your team make smart choices. SQL helps you turn raw data into clear answers. If you want to grow in analytics, keep building your SQL skills.
Note: SQL is a foundation for many other data tools. Once you learn it, you can use it with platforms like FineBI, Power BI, or Tableau.
8. Google BigQuery
Cloud Data Analysis
If you want to work with huge amounts of data, Google BigQuery makes it easy. You do not need to worry about setting up servers or buying hardware. You just upload your data and start your analytics. BigQuery lives in the cloud, so you can reach your data from anywhere. You can use it at home, at work, or even on your phone.
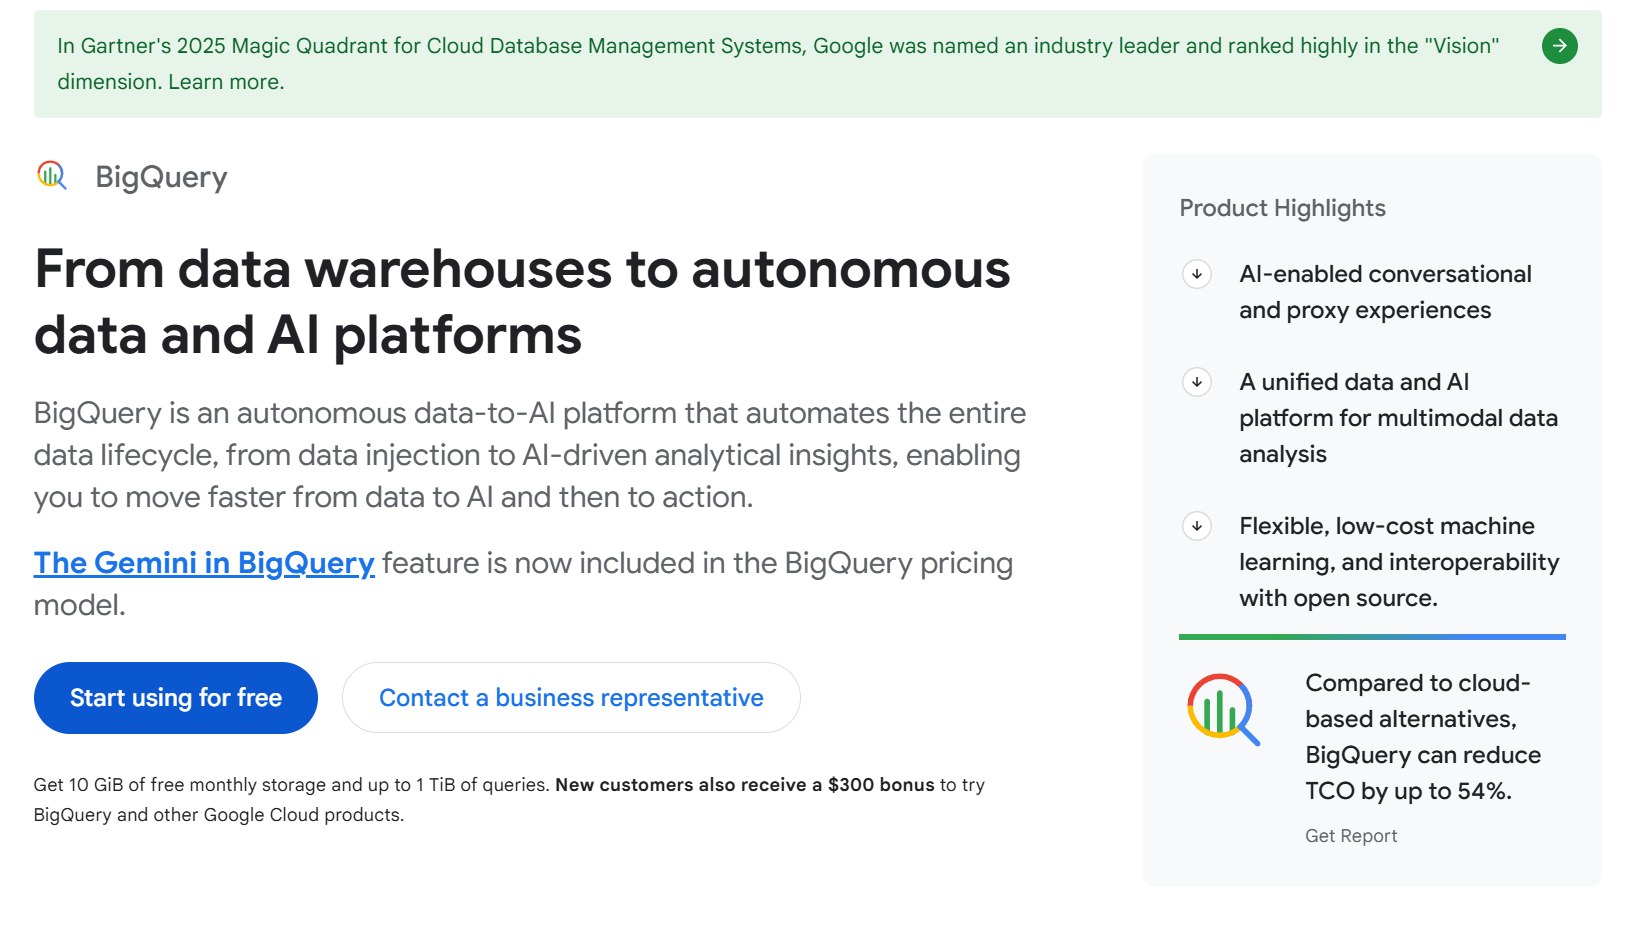
Website: https://cloud.google.com/bigquery
BigQuery gives you fast answers. You can run analytics on millions of rows in seconds. You do not have to wait for hours to see results. This speed helps you make decisions quickly. You can also connect BigQuery to other Google tools. For example, you can send data from Google Tag Manager straight to BigQuery. This means your dashboards always show the latest numbers. You can see trends and changes as they happen.
Here are some reasons why you might like BigQuery for cloud data analysis:
- You get fast processing for large data sets.
- You can connect with Google services and other systems.
- Real-time dashboards give you instant insights.
- You can send data directly from Google Tag Manager for up-to-date reporting.
Tip: If you want to share your analytics with your team, BigQuery makes it simple. Everyone can see the same data and work together.
Scalability
BigQuery grows with your data. You can start with a small project and then add more data as your needs grow. You do not have to change your setup. BigQuery handles more data without slowing down. This makes it a good choice for companies that want to scale their analytics.
Let’s look at how BigQuery compares to other cloud data warehouses in 2026:
| Database | Rank | Trend |
|---|---|---|
| Google BigQuery | 19 | Declining |
| Snowflake | N/A | Rising |
Even though BigQuery’s rank is lower now, many people still trust it for big data projects. You can use it for analytics in many industries. If your company grows, your data grows too. BigQuery keeps up with your needs. You do not have to worry about running out of space or power.
BigQuery helps you focus on your analytics, not on managing servers. You can spend more time finding answers in your data and less time fixing problems. This makes your work easier and faster.
9. KNIME Data Analysis Tools
No-Code Analytics
Have you ever wanted to work with data but felt worried about coding? KNIME makes data analytics easy for everyone. You do not need to write code to use this tool. You can drag and drop blocks to build your data workflows. Each block does a job, like cleaning data or making a chart. You can see your data change step by step. This helps you understand what happens at each stage.
Website: https://www.knime.com/
KNIME gives you a friendly way to explore data. You can try different ideas without fear. If you want to test a new way to look at your data, just add a new block. You can undo changes if you do not like the results. This makes learning about data fun and safe. Many people use KNIME for data analytics because it saves time and lowers stress.
Tip: Use KNIME’s visual workflow to show your team how you move data from start to finish. This helps everyone see the big picture.
Integration Features
KNIME connects to many data sources. You can pull data from Excel files, databases, or even cloud apps. This means you can bring all your data together in one place. You do not need to switch between tools. KNIME lets you join, blend, and shape your data for better analytics.
Here is a table that shows some ways KNIME helps you with data integration:
| Feature | What You Can Do With It |
|---|---|
| Database Connect | Link to SQL, Oracle, or other systems |
| File Reader | Import data from CSV or Excel files |
| Cloud Connectors | Get data from Google Drive or AWS |
| API Integration | Pull data from web services |
You can also send your data to other tools for more analytics. KNIME works well with Python, R, and even machine learning platforms. This makes it a strong choice if you want to grow your data skills. You can start simple and add more features as you learn.
10. Qlik Sense
Associative Data Model
Qlik Sense gives you a new way to work with data. You do not have to worry about missing connections or hidden patterns. The associative data model lets you explore your data from every angle. You can jump from one question to another without losing your place. This model helps you see how different pieces of data relate to each other. You do not get stuck with simple joins or limited views.

Website: https://www.qlik.com/us/products/qlik-sense
Here is a table that shows what makes Qlik Sense’s associative data model special in 2026:
| Feature | Description |
|---|---|
| Larger Datasets | You can handle data sets with over 1 million records. |
| Multi-Fact Table Data Models | You can build complex data models with many connections, not just simple joins. |
| Online Collaboration | You and your team can work together on data in real time. |
| Data Security and Governance | Your data stays safe and managed. No more sending files by email. |
| Visual and Analytical Power | The Associative Engine gives you strong visuals and deep analytics. |
Tip: Try exploring your data by clicking on different fields. You might find answers you did not expect.
Fast Insights
You want answers fast. Qlik Sense helps you get insights from your data in seconds. You can search, filter, and drill down with just a few clicks. The tool shows you connections between data points that you might miss in other platforms. You do not need to be a data expert to find trends or spot problems.
Qlik Sense uses smart analytics to help you make sense of your data. You can see charts, graphs, and tables update right away as you explore. The platform supports big data, so you do not have to worry about slow reports. You can share your findings with your team and work together on the same data set. This makes your analytics process smooth and quick.
If you want to keep up with the speed of business, Qlik Sense is a great choice. You can turn raw data into clear answers and make better decisions every day.
AI Data Analysis Tools to Watch in 2026

AI is everywhere now. In 2026, data analysis tools use AI to help you work faster. You get answers in just a few seconds. You do not need to be a data scientist to find patterns. AI turns raw data into clear ideas. Let’s look at three tools that are important this year.
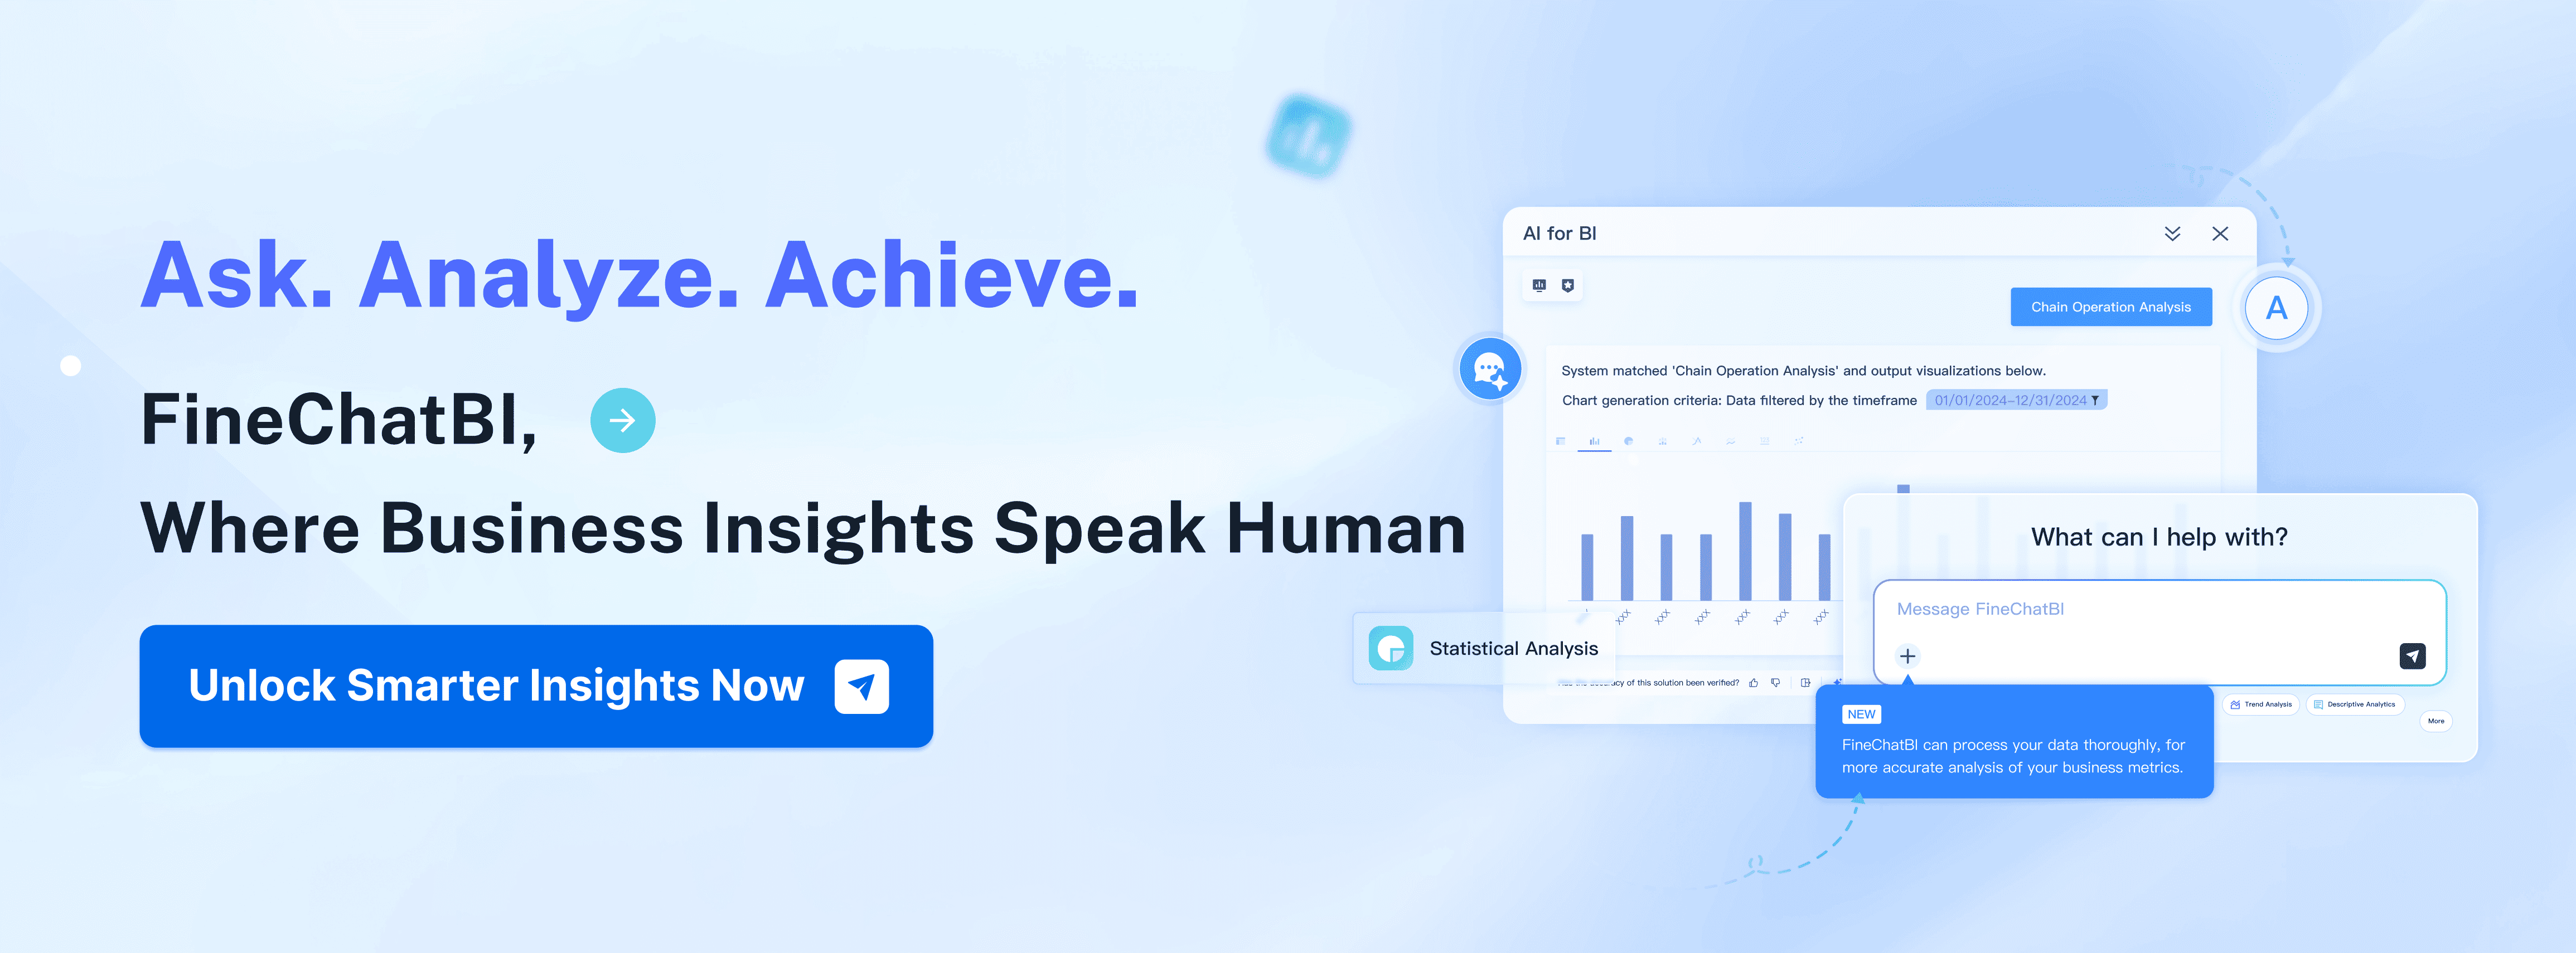
1.FineChatBI
FineChatBI changes how you use data. You ask questions using simple words. The tool shows you charts, numbers, and smart insights right away. You do not need to make dashboards or write code. FineChatBI works inside FineBI, so you get easy analytics with AI features. You can look at data, find problems, and share answers with your team. This tool helps both business people and tech experts. You save time and make better choices.
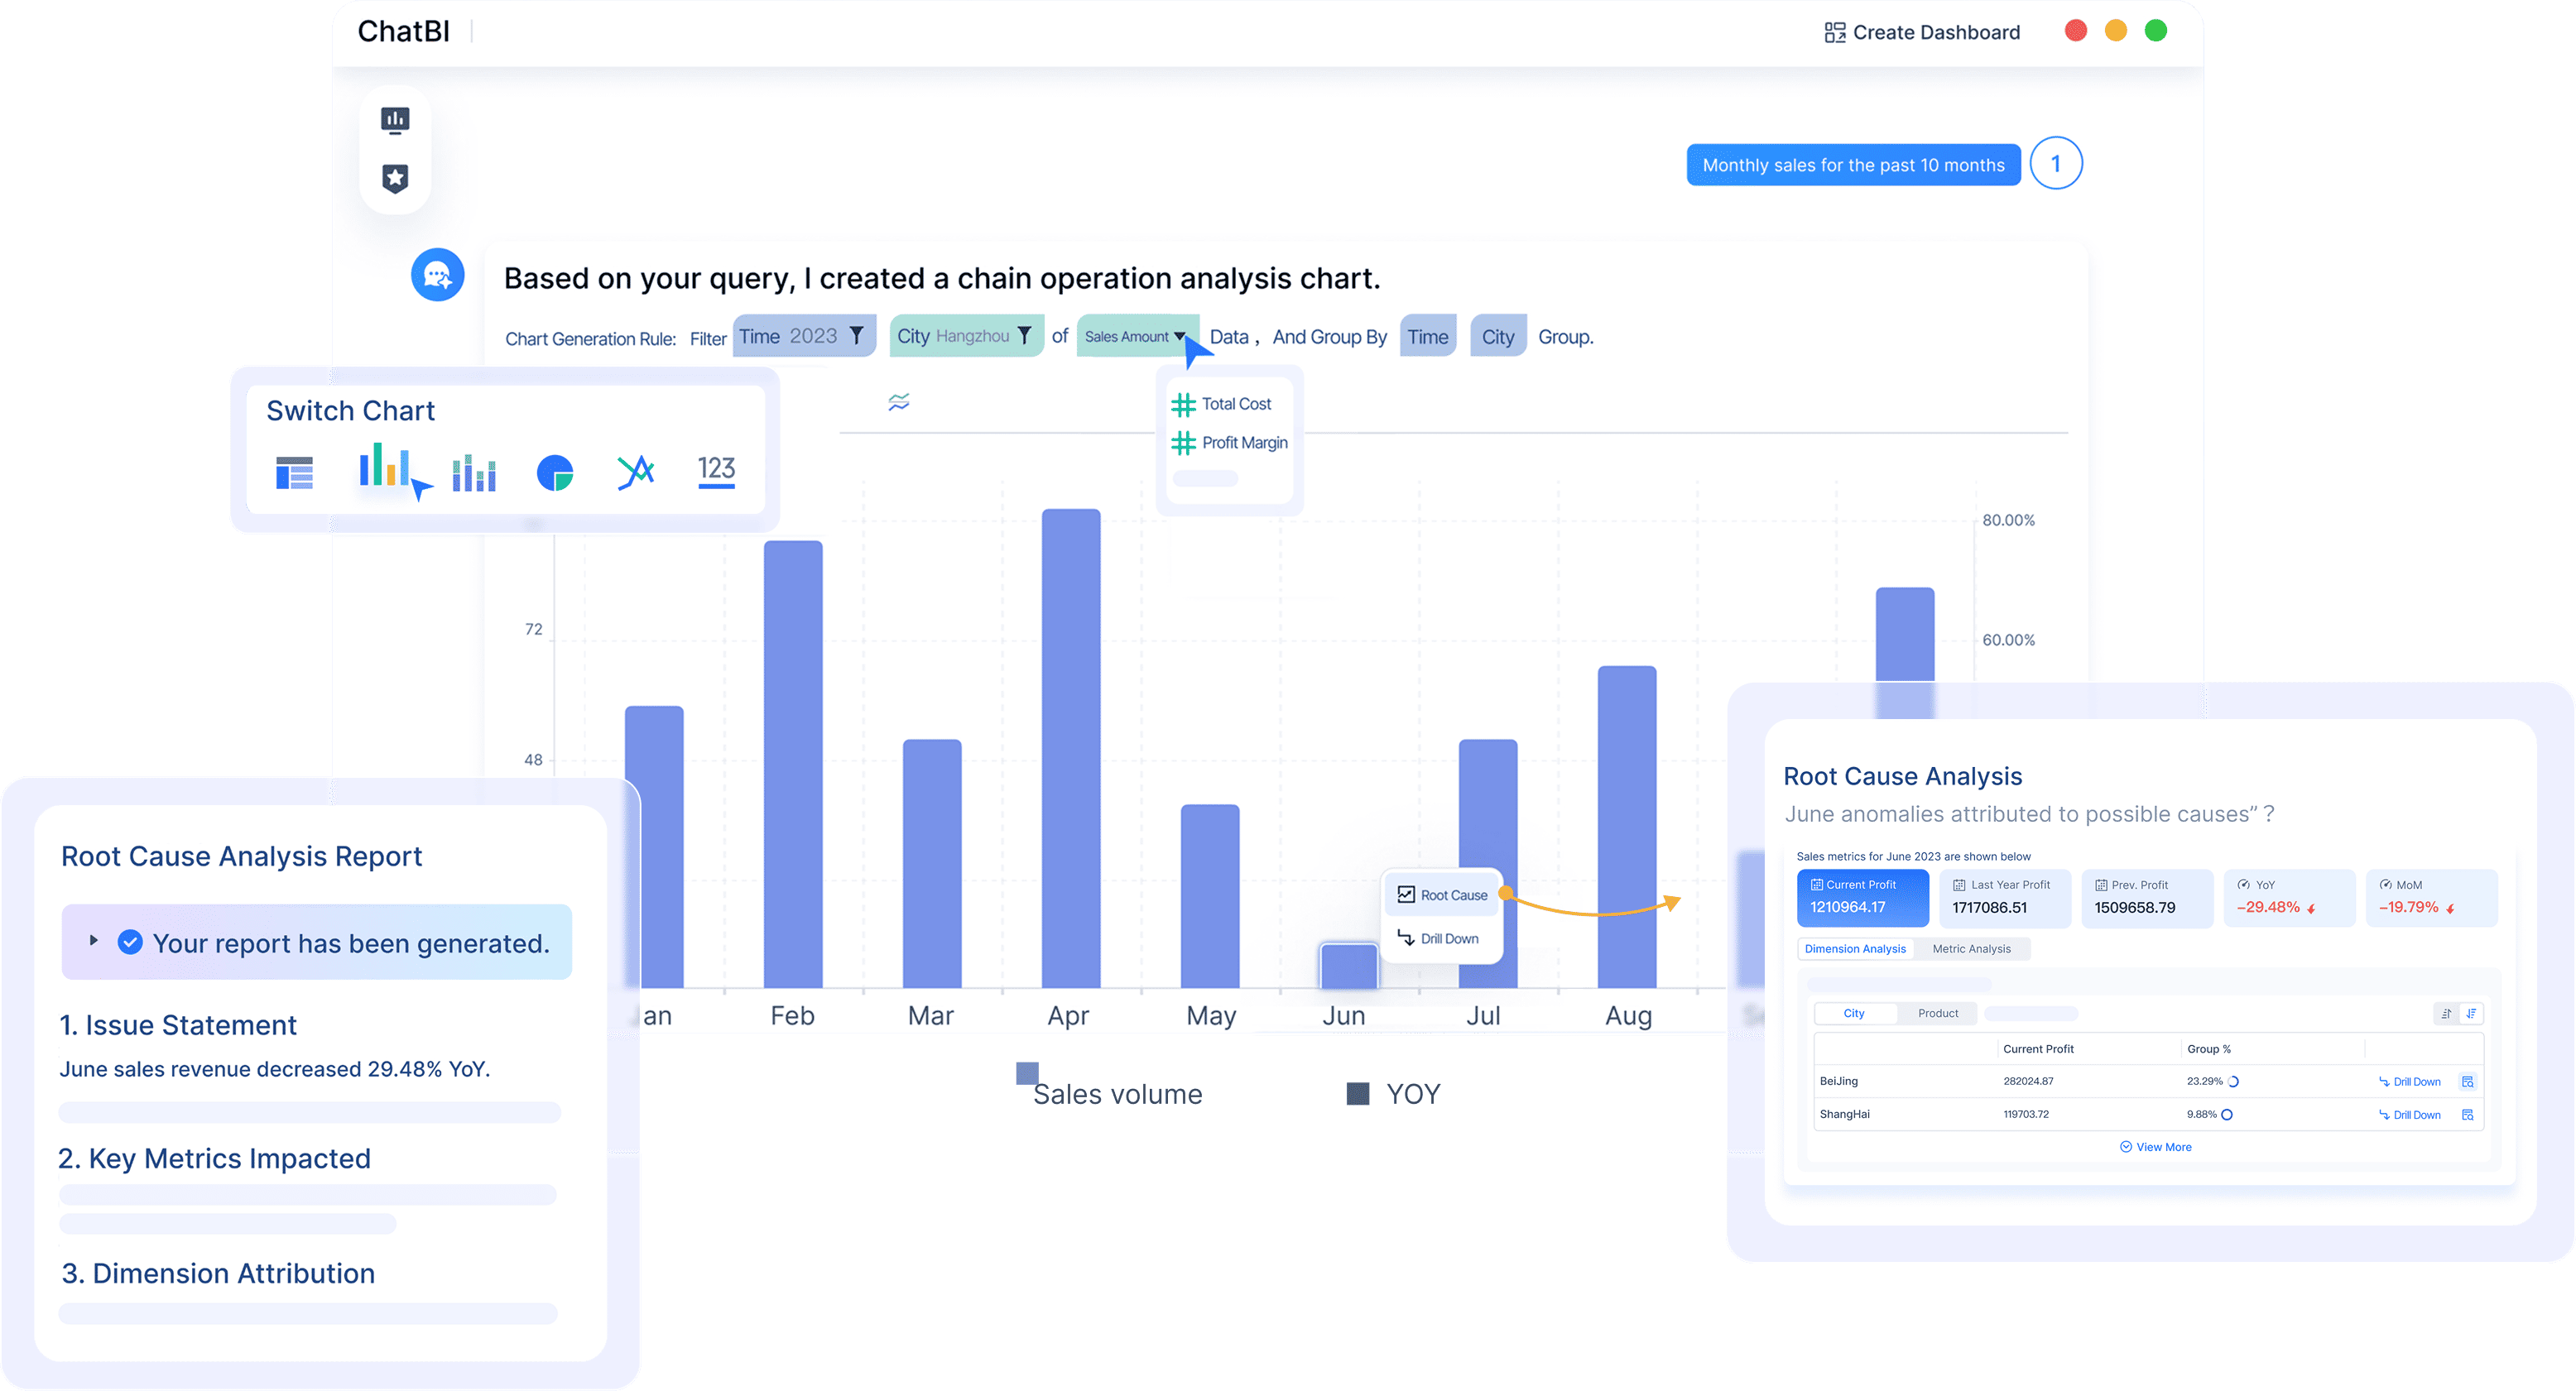
Website: https://www.fanruan.com/en/finechatbi
Tip: Try asking FineChatBI about sales or inventory. You get quick charts and answers.
2.Looker Studio (Google Data Studio)
Looker Studio helps you make reports and dashboards you can click on. You connect to many kinds of data. The tool uses AI to pick charts and show important numbers. You can mix data from spreadsheets, cloud apps, or databases. Looker Studio makes analytics easy for everyone. You drag and drop your data, then share your results with your team. AI helps you see trends and get answers fast.

Website: https://lookerstudio.google.com/
Here is a table with other good AI data analysis tools in 2026:
| Tool Name | Description |
|---|---|
| Data analysis with ChatGPT | An AI helper that brings data analysis to people who do not code. |
| Anaconda AI Navigator | A platform to try open-source LLMs on your computer. |
| Jupyter AI | A platform that makes building machine learning models easier. |
| Tableau AI | AI finds insights in data sets and saves you time. |
3.Grafana for Time-Series Data
Grafana is good for time-series data. You use it to watch changes over time, like website visits or sensor data. Grafana connects to many data sources. The tool uses AI to find patterns and send alerts when things change. You make dashboards that update in real time. Grafana helps you see trends and act fast. You do not need to be an expert to use its analytics.
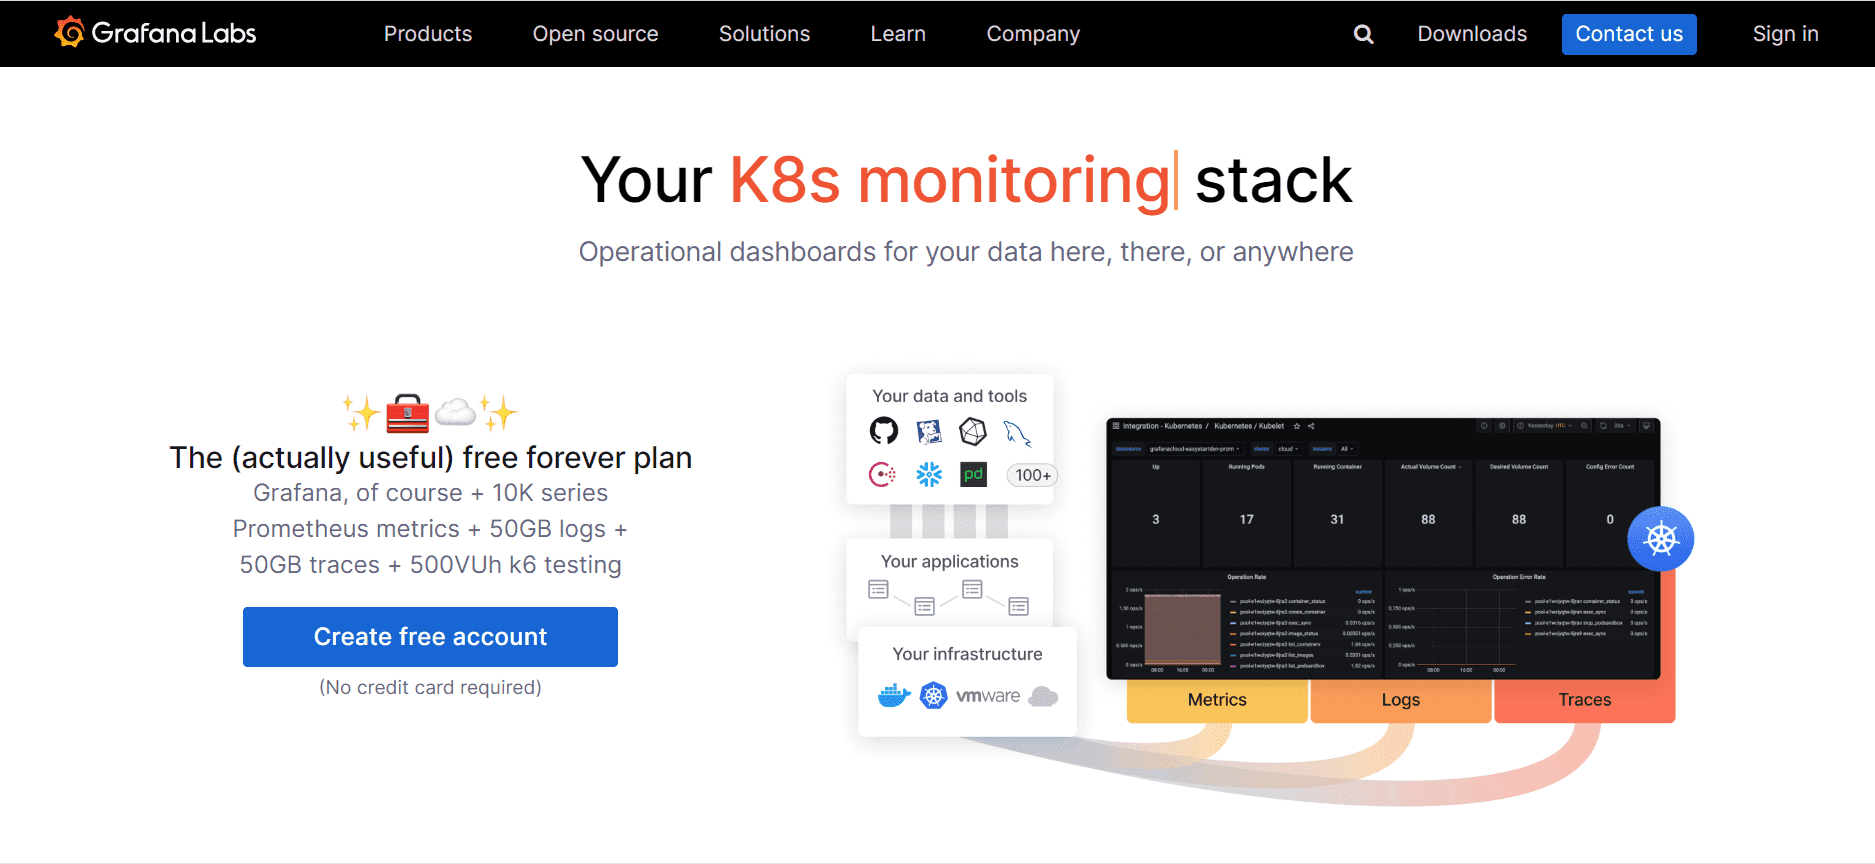
Website: https://grafana.com/
In 2026, AI changes data analysis for everyone. You can automate simple tasks. You make choices faster. AI and cloud tech work together to give you better data access. You get more efficient analytics and help the environment. Both business and tech teams benefit. You find answers, share ideas, and use data tools to create new things.
You have to keep learning new data tools to do well in 2026. Python, SQL, Tableau, and Power BI help you change raw data into smart answers. FineBI from FanRuan lets you make choices using real-time data and predictions. Try out different tools, see which one works for your job, and read stories from other customers.
Python is still the best tool for data analytics. You can use it to help make choices and do tasks automatically.
| Benefit | Description |
|---|---|
| Real-time insights | AI tools give you quick data checks for better choices. |
| Pattern recognition | Find trends and see what customers do to help your choices. |
| Predictive analytics | Guess sales and market changes so you can plan with data. |


FAQ

The Author
Lewis
Senior Data Analyst at FanRuan
Related Articles

What Is Business Management? A Real-World Guide to Strategy, Operations, Finance, and People
$1 is the discipline of turning goals into results. It connects strategy with execution, money with decisions, and people with performance. Whether a company has 5 employees or 50,000, strong management is what keeps pri
Lewis Chou
Jun 24, 2026

What Recruiters Look for in a Data Analysis Portfolio: 10 Criteria to Score Yours Fast
A $1 is not judged like a school assignment. It is judged like a hiring shortcut. Recruiters, hiring managers, and analytics leads use it to answer one question fast: Can this person solve business problems with data in
Lewis Chou
May 29, 2026

What Is Data Analytics Consulting? Beginner’s Guide to Services, Deliverables, and Business Value
$1 helps organizations turn raw data into decisions they can trust. For many business leaders, the challenge is not a lack of data. It is a lack of clarity. Reports conflict, teams track different KPIs, dashboards are un
Lewis Chou
Jun 03, 2026