Big data continues to transform industries, and by 2026, its impact will only grow stronger. Businesses increasingly rely on advanced big data tools to process, analyze, and extract value from vast datasets. The global market for big data analytics is projected to reach $745.15 billion by 2030, driven by rising investments in IoT and the growing complexity of data. Companies like Netflix save billions annually by leveraging data-driven insights, while Walmart reduces inventory issues by 30% through data-driven decision-making. These tools empower organizations to refine customer experiences, optimize operations, and make strategic decisions with precision. Here are the Top 10 Big Data Tools You Should Know:
- Apache Hadoop
- Apache Spark
- Tableau
- Google BigQuery
- Microsoft Azure Synapse Analytics
- Databricks
- Snowflake
- Amazon EMR
- FanRuan FineBI
- FanRuan FineDataLink
Key Takeaways on Big Data Tools

- Key Big Data Tools: Apache Hadoop and Spark handle large datasets efficiently, while Tableau simplifies data visualization for non-technical users.
- Cloud and Collaboration: Google BigQuery and Microsoft Azure Synapse Analytics offer fast, integrated solutions, and Databricks enhances team collaboration on data projects.
- FanRuan’s Solutions: FineBI, FineDataLink, and FineReport provide self-service analytics, data integration, and reporting tools for streamlined business insights.
1.Apache Hadoop: Foundational Big Data Tools

Apache Hadoop stands as one of the most foundational big data tools, offering a robust framework for storing and processing large datasets. Its open-source nature and scalability make it a go-to solution for organizations managing complex data ecosystems.
Key Features
Apache Hadoop provides a suite of features that make it indispensable for handling big data:
- HDFS (Hadoop Distributed File System): This system ensures efficient data storage by distributing large datasets across multiple machines. It supports scalability and fault tolerance, making it ideal for big data environments.
- MapReduce: This programming model enables parallel data processing, significantly improving the speed and efficiency of analyzing large datasets.
- YARN (Yet Another Resource Negotiator): YARN manages resources across the Hadoop cluster, ensuring optimal utilization for data processing tasks.
- Flexibility: As an open-source platform, Hadoop allows customization to meet specific business needs, making it adaptable for various industries.
Website: https://hadoop.apache.org/
| Key Performance Aspect | Description |
|---|---|
| Scalability | HDFS can handle petabytes of data with ease by distributing it across machines. |
| Fault Tolerance | Data is replicated across nodes, ensuring no loss of information if a node fails. |
| High Throughput | HDFS is optimized for reading and writing large files quickly. |
| Processing Speed | MapReduce allows for parallel processing of large datasets. |
| Flexibility | Open-source nature enables customization for specific business needs. |
Benefits
Apache Hadoop offers several advantages that make it a cornerstone in the big data ecosystem:
- Cost-Effective Data Storage: Hadoop's ability to store large datasets across commodity hardware reduces infrastructure costs.
- Scalability: You can scale your Hadoop cluster by adding more nodes, ensuring it grows with your data needs.
- Fault Tolerance: Data replication across nodes ensures reliability, even in the event of hardware failures.
- Real-Time Insights: Hadoop supports real-time data processing, enabling businesses to make timely decisions.
- Integration with Data Analytics Tools: Hadoop integrates seamlessly with tools like FineBI, FineReport, and FineDataLink, enhancing its capabilities for data analytics services.
Use Cases
Organizations across industries leverage Apache Hadoop for various applications:
- Retail: Companies use Hadoop to analyze customer behavior and optimize inventory management. For example, Walmart uses big data tools to reduce inventory issues by 30%.
- Healthcare: Hadoop processes large datasets from medical records, enabling predictive analytics and improving patient care.
- Finance: Financial institutions rely on Hadoop for fraud detection and risk management by analyzing transactional data in real time.
- Manufacturing: Hadoop supports agile manufacturing by integrating data from IoT devices, improving production efficiency.
- Data Science and Machine Learning: Hadoop serves as a foundation for training machine learning models on large datasets, driving innovation in AI applications.
Hadoop's relevance continues to grow as organizations invest in big data processing capabilities. Its widespread adoption by major vendors like Cloudera and Hortonworks, along with cloud services such as AWS EMR, highlights its enduring importance. By integrating Hadoop with tools like FineBI for self-service analytics or FineDataLink for real-time data synchronization, you can unlock its full potential for data-driven decision-making.
2.Apache Spark: Real-Time Big Data Tools for Analytics

Apache Spark has become a game-changer in the world of big data. Its ability to handle real-time data processing and advanced analytics makes it one of the most powerful big data tools available today. Whether you are working with structured, unstructured, or semi-structured data, Apache Spark provides the speed and flexibility needed to derive actionable insights.
Key Features
Apache Spark offers a range of features that set it apart from other big data tools:
- In-Memory Processing: Spark processes data in memory, reducing the time required for batch processing and enabling real-time analytics. This feature is particularly useful for applications requiring low-latency responses.
- Support for Multiple Data Sources: Spark can ingest data from various sources, including Hadoop, NoSQL databases, and cloud storage systems, ensuring seamless integration across platforms.
- Streaming Capabilities: With Spark Streaming, you can process real-time data streams, making it ideal for applications like fraud detection and social media analytics.
- Machine Learning Library (MLlib): Spark includes a robust library for machine learning, enabling you to build predictive models and perform advanced analytics on large datasets.
- Scalability: Spark can scale from a single server to thousands of machines, making it suitable for both small businesses and large enterprises.
Website: https://spark.apache.org/
| Feature | Description |
|---|---|
| In-Memory Processing | Reduces batch-processing times and supports real-time analytics. |
| Streaming Capabilities | Enables real-time data ingestion and analysis for low-latency applications. |
| Machine Learning Library | Provides tools for predictive modeling and advanced analytics. |
| Scalability | Handles workloads of varying sizes, from small to enterprise-level. |
Benefits
Apache Spark delivers several benefits that make it indispensable for real-time data processing:
- Accelerated Data Ingestion: Spark ingests structured, unstructured, and semi-structured data quickly, enabling real-time data connection and analysis.
- Reduced Batch Processing Times: Its in-memory transformation capabilities significantly decrease the time required for batch processing tasks.
- Support for AI and Machine Learning: Spark provides the computational power needed for complex machine learning workflows, making it a favorite among data scientists.
- Automation of Data Pipelines: Spark automates data pipeline processes, streamlining data movement and analysis across systems.
- Real-Time Insights: Spark’s streaming capabilities allow you to process and analyze data in real time, ensuring timely decision-making.
Spark’s ability to handle real-time data connection and advanced analytics makes it a cornerstone for businesses aiming to stay competitive in a data-driven world.
Use Cases
Organizations across industries rely on Apache Spark for various applications:
- E-Commerce: Spark powers recommendation engines by analyzing customer behavior in real time, enhancing user experiences.
- Finance: Financial institutions use Spark for fraud detection and risk management by processing transactional data streams.
- Healthcare: Spark supports predictive modeling for patient care, analyzing medical data to identify potential health risks.
- Manufacturing: Spark integrates IoT data from production lines, enabling real-time monitoring and predictive maintenance.
- Data Science: Spark accelerates machine learning workflows, helping data scientists build and deploy models faster.
FanRuan’s products, such as FineBI, FineReport, and FineDataLink, complement Apache Spark’s capabilities. FineBI enables self-service analytics, allowing you to visualize Spark’s processed data effortlessly. FineReport enhances reporting by integrating Spark’s real-time data streams into dynamic dashboards. FineDataLink ensures seamless data integration, connecting Spark with other data sources for a unified analytics experience. Together, these tools create a comprehensive ecosystem for data-driven decision-making.
3.Tableau: Big data tools for visualization and analysis

Overview of Tableau
What is Tableau?
Tableau is a leading platform for data visualization and analysis. It empowers users to transform raw data into interactive dashboards and reports. Designed for both technical and non-technical users, Tableau simplifies the process of exploring and understanding complex datasets. Its intuitive drag-and-drop interface makes it accessible to anyone, regardless of their technical expertise.

Website: https://www.tableau.com/
Key Features of Tableau
Tableau stands out due to its advanced features, which make it a preferred choice among big data tools:
- Advanced Data Visualization: Tableau offers a wide range of visualization options, from simple bar charts to complex heatmaps and scatter plots.
- Flexibility in Data Sources: It connects seamlessly to various data sources, including databases, spreadsheets, and cloud platforms.
- Real-Time Data Processing: Tableau enables users to analyze live data streams, ensuring timely insights.
- Customization Options: Users can tailor dashboards to meet specific business needs.
- Community Support: Tableau boasts a strong user community, providing resources and solutions for common challenges.
"In Tableau, utilizing statistical calculations is essential for effectively measuring performance and gaining deeper insights from your data. These calculations enable users to make informed decisions based on the visualized data presented in dashboards."
Benefits of Using Tableau
Enhanced Data Insights
Tableau excels at turning raw data into actionable insights. For example, it allows users to compute growth rates and averages from historical sales figures. This capability highlights significant trends and empowers businesses to forecast future performance accurately.
User-Friendly Interface
Tableau’s drag-and-drop functionality simplifies data processing. Even users with minimal technical skills can create compelling visualizations. This ease of use democratizes data analytics, enabling teams across an organization to make data-driven decisions.
Real-Time Data Analysis
Tableau’s real-time capabilities are particularly valuable. For instance, it can analyze Major League Soccer (MLS) salaries, categorizing players by teams and locations. This feature ensures that businesses can respond quickly to changing conditions, making it a vital tool for dynamic industries.
Use Cases for Tableau
Business Intelligence Applications
Tableau plays a crucial role in business intelligence. It helps organizations monitor key performance indicators (KPIs) and track progress toward goals. By integrating Tableau with tools like FineBI, you can enhance self-service analytics and create a unified platform for data-driven decision-making.
Marketing Analytics
Marketers use Tableau to analyze campaign performance and customer behavior. Its ability to process large datasets quickly makes it ideal for identifying trends and optimizing strategies. When combined with FineDataLink, Tableau can integrate data from multiple sources, providing a comprehensive view of marketing efforts.
Financial Reporting
Tableau simplifies financial reporting by visualizing complex data. It enables finance teams to identify anomalies, track expenses, and forecast budgets. FineReport complements Tableau by generating pixel-perfect financial reports, ensuring accuracy and clarity in presentations.
FanRuan’s suite of products—FineBI, FineReport, and FineDataLink—works seamlessly with Tableau. FineBI enhances Tableau’s analytics capabilities by enabling self-service exploration. FineReport ensures precise reporting, while FineDataLink facilitates real-time data integration. Together, these tools create a robust ecosystem for big data analytics and visualization.
Comparison with Other Big Data Tools
Tableau vs. Power BI
When comparing Tableau and Power BI, you notice that both excel in data visualization and analytics. However, Tableau offers more advanced visualization options, making it ideal for users who prioritize design and interactivity. Power BI, on the other hand, integrates seamlessly with Microsoft products like Excel and Azure, which benefits organizations already using the Microsoft ecosystem.
Tableau’s strength lies in its ability to handle large datasets and connect to diverse data sources. It supports real-time data processing and provides a user-friendly interface for creating dashboards. Power BI, while powerful, may struggle with processing extremely large datasets without additional configurations.
FanRuan’s FineBI complements Tableau by enabling self-service analytics, allowing you to explore data independently. FineDataLink can integrate data from multiple sources, enhancing Tableau’s connectivity. Together, these tools create a robust environment for data-driven decision-making.
Tableau vs. QlikView
Tableau and QlikView both focus on transforming raw data into actionable insights. Tableau emphasizes ease of use with its drag-and-drop interface, making it accessible to non-technical users. QlikView, however, offers more advanced scripting capabilities, which appeal to users with technical expertise.
QlikView excels in associative data modeling, allowing you to explore relationships between datasets dynamically. Tableau, in contrast, shines in its ability to create visually appealing dashboards quickly. For real-time data processing, Tableau often proves more efficient.
By integrating Tableau with FineReport, you can enhance reporting capabilities. FineReport’s pixel-perfect reports complement Tableau’s visualizations, ensuring accuracy and clarity in presentations. FineDataLink further strengthens this integration by synchronizing data in real time, enabling seamless workflows.
Integration with Big Data Tools
Connecting to Hadoop
Tableau connects effortlessly to Hadoop, one of the foundational big data tools. This integration allows you to visualize and analyze large datasets stored in Hadoop Distributed File System (HDFS). By leveraging Tableau’s real-time data processing capabilities, you can extract insights from Hadoop’s vast data repositories.
FineBI enhances this connection by providing self-service analytics on Hadoop data. It enables you to drill down into datasets and uncover trends without relying on IT teams. FineDataLink ensures smooth data synchronization between Hadoop and Tableau, reducing latency and improving efficiency.
Integrating with Google BigQuery
Google BigQuery, a cloud-based big data platform, integrates seamlessly with Tableau. This combination allows you to analyze massive datasets stored in BigQuery while leveraging Tableau’s advanced visualization tools. The integration supports real-time data processing, enabling you to make timely decisions.
FineBI complements this setup by offering intuitive dashboards for exploring BigQuery data. FineReport adds value by generating detailed reports from BigQuery datasets, while FineDataLink facilitates real-time data synchronization. Together, these tools create a comprehensive ecosystem for big data analytics.
Best Practices for Using Tableau
Designing Effective Dashboards
To design effective dashboards in Tableau, focus on clarity and simplicity. Use charts and graphs that convey information quickly. Avoid clutter by limiting the number of visual elements on each dashboard. Group related data points together to make insights easier to understand.
FineBI can help you create interactive dashboards that enhance Tableau’s capabilities. Its collaborative features allow teams to share insights and validate data collectively. This ensures that your dashboards remain accurate and relevant.
Ensuring Data Accuracy
Data accuracy is critical for reliable analytics. Always validate your data sources before importing them into Tableau. Use Tableau’s built-in data preparation tools to clean and organize datasets. Regularly update your data connections to ensure they reflect the latest information.
FineDataLink plays a vital role in maintaining data accuracy. Its real-time synchronization capabilities ensure that Tableau always works with the most current data. FineReport adds another layer of reliability by generating reports that highlight anomalies or inconsistencies in your datasets.
Tip: Combining Tableau with FanRuan’s FineBI, FineReport, and FineDataLink ensures a seamless workflow for data integration, visualization, and reporting. This approach maximizes the value of your big data investments.
Future Trends in Tableau
AI and Machine Learning Integration
The future of Tableau lies in its ability to harness the power of artificial intelligence and machine learning. These technologies will transform how you interact with data, making analytics more intuitive and impactful. Tableau is expected to introduce AI-powered insights that automatically identify patterns, trends, and anomalies in your datasets. This feature will save you time by eliminating the need for manual data exploration.
Machine learning will enhance Tableau's predictive capabilities. For example, you could forecast sales trends or customer behavior with greater accuracy. Tableau will likely integrate advanced algorithms that process large datasets efficiently, providing you with actionable insights in real time. This evolution will make Tableau a vital tool for businesses aiming to stay competitive in a data-driven world.
FanRuan's products complement Tableau's AI and machine learning advancements. FineBI enables you to perform self-service analytics, allowing you to explore AI-generated insights independently. FineReport enhances this by creating detailed reports that present machine learning predictions clearly. FineDataLink ensures seamless data processing, connecting Tableau to various data sources for a unified analytics experience. Together, these tools create a robust ecosystem for leveraging AI and machine learning in your decision-making processes.

Enhanced Collaboration Features
Collaboration will play a significant role in Tableau's future. As organizations become more data-centric, the need for team-based analytics will grow. Tableau is expected to introduce features that allow multiple users to work on the same dashboard simultaneously. This will enable you and your team to share insights, validate data, and make decisions faster.
Enhanced collaboration will also include better integration with communication tools. Imagine receiving real-time updates on your Tableau dashboards directly in your team's chat application. This feature will keep everyone aligned and informed, regardless of their location.
FanRuan's suite of products aligns perfectly with Tableau's collaborative future. FineBI supports team collaboration by allowing multiple users to share and modify dashboards. FineReport complements this by generating reports that can be easily distributed across your organization. FineDataLink ensures that all team members work with the most current data by synchronizing updates in real time. These tools enhance Tableau's collaborative capabilities, making it easier for your team to achieve its goals.
Tip: Combining Tableau with FanRuan's FineBI, FineReport, and FineDataLink ensures a seamless workflow for data integration, visualization, and collaboration. This approach maximizes the value of your data investments.
4.Google BigQuery: Cloud-Based Big Data Software

Google BigQuery stands out as a leading cloud-based big data platform, offering unmatched scalability and performance for handling large-scale data. Its serverless architecture and advanced analytics capabilities make it an essential tool for organizations aiming to derive actionable insights from their data.
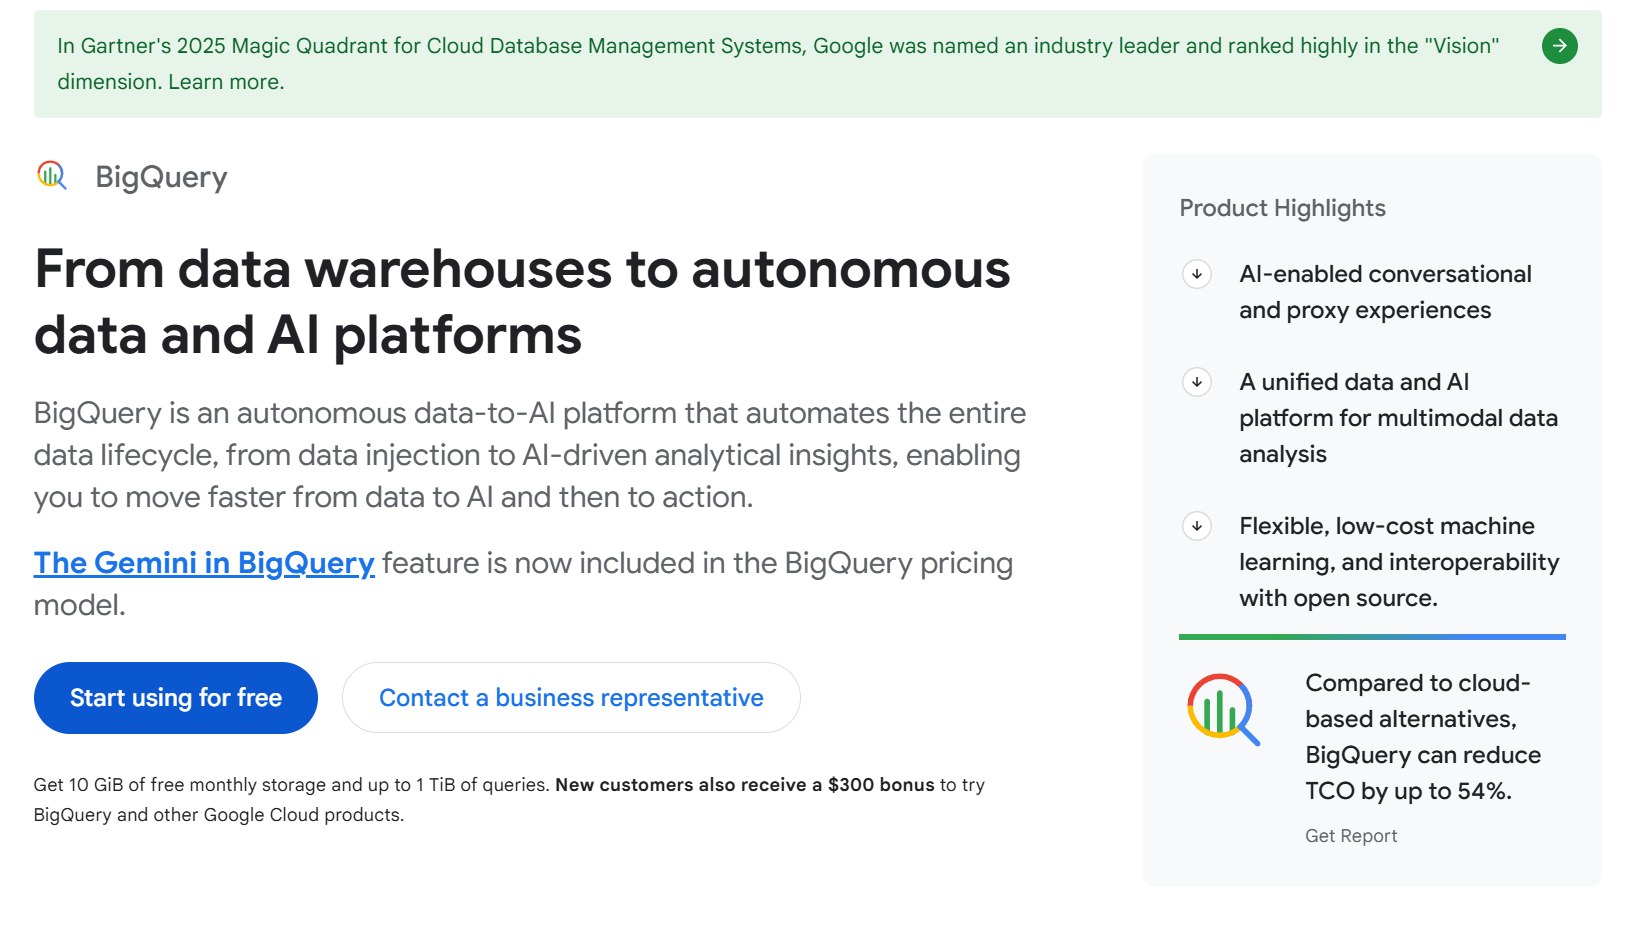
Website: https://cloud.google.com/bigquery
Key Features
Google BigQuery provides a range of features that simplify data processing and analytics:
- Serverless Design: BigQuery eliminates the need for infrastructure management. It automatically allocates resources for your queries, allowing you to focus on data analysis rather than hardware concerns.
- Columnar Storage: This feature organizes data by columns, improving compression and speeding up query execution. It ensures efficiency, especially for analytical queries.
- Massively Parallel Processing (MPP): BigQuery distributes query tasks across thousands of servers. This approach enables rapid processing of complex queries, even for datasets spanning terabytes.
- Dremel Technology: BigQuery uses a tree architecture to dynamically scale based on query complexity and dataset size. This ensures high performance and resilience during data processing.
| Feature | Description |
|---|---|
| Serverless Design | Abstracts infrastructure management, enhancing accessibility for users. |
| Columnar Storage | Improves efficiency for analytical queries through better compression. |
| Massively Parallel Processing | Distributes tasks across servers, ensuring rapid query execution. |
| Dremel Technology | Dynamically scales resources, enhancing performance for large datasets. |
Benefits
Google BigQuery offers several advantages that make it a preferred choice for big data processing:
- Scalability: BigQuery handles terabytes of data effortlessly. Its architecture ensures seamless operations, even during hardware failures.
- Speed: The platform processes complex queries in seconds or minutes, thanks to its MPP and Dremel technology.
- AI and Machine Learning Integration: BigQuery emphasizes machine learning capabilities, enabling you to build predictive models directly within the platform.
- Ease of Use: Its serverless design abstracts technical complexities, making it accessible to users with varying technical expertise.
- Extensive Connectivity: BigQuery integrates with a wide range of data analytics tools, including FanRuan’s FineBI, FineReport, and FineDataLink.
BigQuery’s ability to process large datasets quickly and its strong emphasis on machine learning make it a cornerstone for modern data-driven organizations.
Use Cases
Organizations across industries leverage Google BigQuery for diverse applications:
- Retail: BigQuery analyzes customer behavior and optimizes inventory management. For example, it can process sales data to identify purchasing trends.
- Finance: Financial institutions use BigQuery for fraud detection and risk management. Its real-time processing capabilities ensure timely insights.
- Healthcare: BigQuery supports predictive modeling for patient care. It processes medical data to identify potential health risks.
- Manufacturing: BigQuery integrates IoT data from production lines, enabling real-time monitoring and predictive maintenance.
FanRuan’s products enhance BigQuery’s capabilities. FineBI allows you to visualize BigQuery’s processed data through interactive dashboards, enabling self-service analytics. FineReport complements this by generating detailed reports, ensuring clarity and precision in data presentation. FineDataLink facilitates seamless data integration, connecting BigQuery to other data sources for a unified analytics experience. Together, these tools create a comprehensive ecosystem for big data software, empowering you to make informed decisions.
5.Microsoft Azure Synapse Analytics: Unified Big Data Tools
Microsoft Azure Synapse Analytics is a unified platform that combines big data processing, data warehousing, and advanced analytics. It empowers you to analyze vast datasets, build machine learning models, and gain actionable insights—all within a single environment.
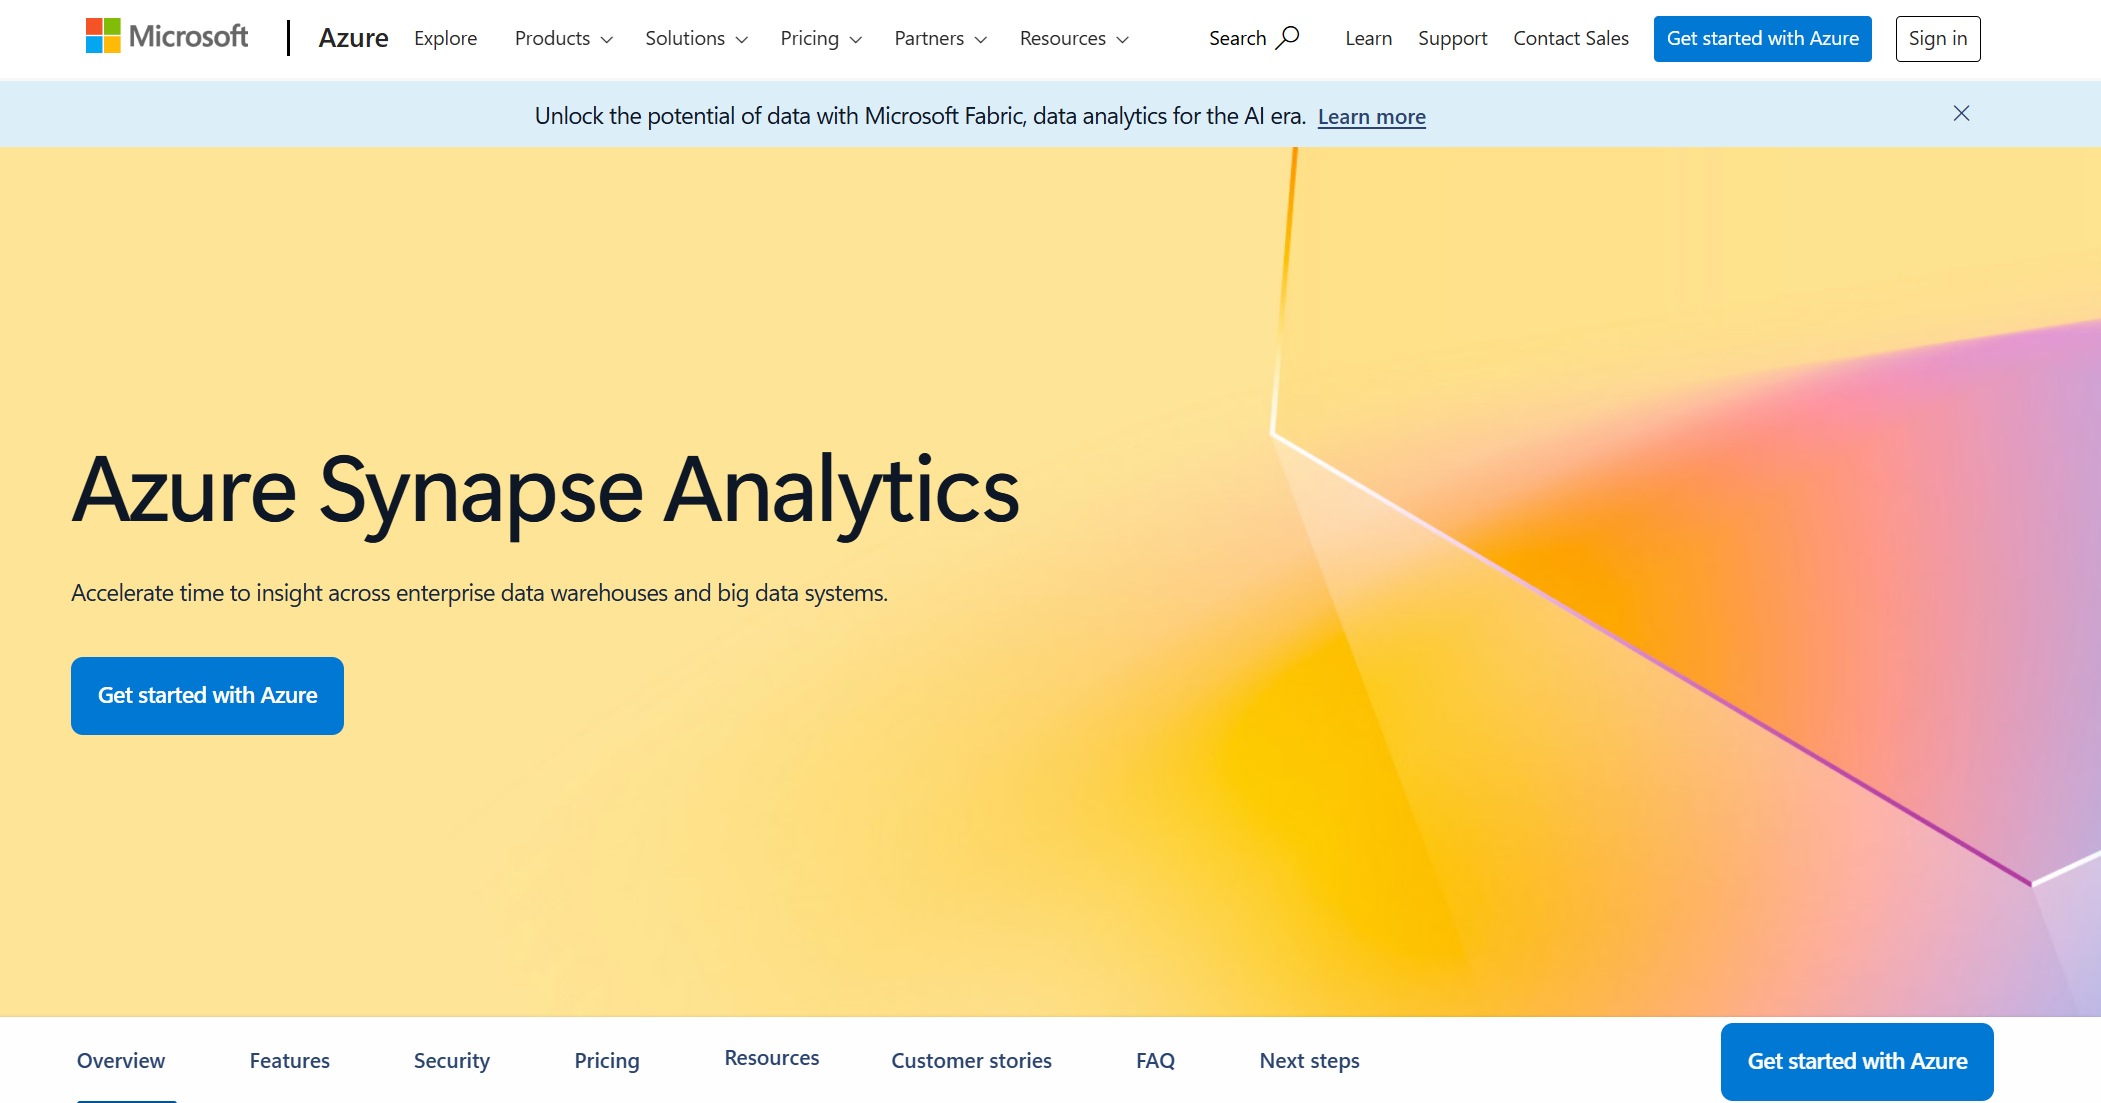
Website: https://azure.microsoft.com/en-us/products/synapse-analytics
Key Features
Azure Synapse Analytics offers a range of features designed to simplify data processing and analytics:
- Unified Data Integration: The platform integrates big data and data warehousing, enabling faster insights across diverse systems. It supports over 90 data sources and code-free ETL processes, making it ideal for complex data transformation tasks.
- Seamless Machine Learning Integration: Azure Synapse works with Azure Machine Learning, allowing you to build and deploy machine learning models directly within the platform.
- Flexible Pricing Models: You can choose between dedicated SQL pools for consistent workloads or serverless SQL pools for ad-hoc queries. This flexibility ensures cost efficiency for various use cases.
- Extensive ETL Capabilities: Azure Synapse shares its Data Integration engine with Azure Data Factory, enabling the creation of robust ETL pipelines for large datasets.
| Component | Pricing Model | Key Considerations |
|---|---|---|
| SQL Pools (Dedicated) | Pay for provisioned compute (DWUs) | Scale up/down as needed. |
| SQL Pools (Serverless) | Pay for data processed (per query) | Ideal for ad-hoc, on-demand queries. |
| Apache Spark Pools | Charged by nodes and runtime duration | Costs depend on cluster size and duration. |
| Data Storage | Pay for data stored (Azure Data Lake) | Different tiers (Hot, Cool, Archive) optimize costs. |
| Data Pipelines | Charged based on execution and activities | Monitor and optimize pipeline usage. |
Benefits
Azure Synapse Analytics provides several advantages that make it a leading big data software:
- Unified Platform: It combines big data processing, data warehousing, and analytics in one environment, reducing complexity.
- Scalability: The platform handles large datasets effortlessly, ensuring smooth operations even during peak loads.
- Cost Efficiency: Flexible pricing models let you optimize costs based on your workload requirements.
- Real-Time Insights: Its ability to process data in real time ensures timely decision-making.
- Enhanced Machine Learning Capabilities: Seamless integration with Azure Machine Learning enables you to build predictive models efficiently.
FanRuan’s FineBI, FineReport, and FineDataLink complement Azure Synapse Analytics perfectly. FineBI enhances self-service analytics by allowing you to visualize Synapse’s processed data through interactive dashboards. FineReport generates detailed reports, ensuring clarity and precision in presenting insights. FineDataLink facilitates real-time data synchronization, connecting Synapse to other data sources for a unified analytics experience.
Use Cases
Organizations across industries rely on Azure Synapse Analytics for various applications:
- Retail: Analyze customer behavior and optimize inventory management by integrating Synapse with machine learning models.
- Finance: Detect fraud and manage risks by processing transactional data in real time.
- Healthcare: Build predictive models for patient care using Synapse’s machine learning capabilities.
- Manufacturing: Monitor production lines and predict maintenance needs by integrating IoT data with Synapse.
FanRuan’s products enhance these use cases. FineBI allows you to explore Synapse’s data independently, empowering teams to make data-driven decisions. FineReport complements this by creating pixel-perfect reports for stakeholders. FineDataLink ensures seamless data integration, enabling real-time insights across your organization. Together, these tools create a robust ecosystem for big data analytics.
Tip: Combining Azure Synapse Analytics with FanRuan’s FineBI, FineReport, and FineDataLink ensures a seamless workflow for data integration, processing, and visualization. This approach maximizes the value of your big data investments.
6.Databricks: Collaborative Big Data Analytics Tools
Databricks has emerged as a leading platform for collaborative big data analytics. It provides a unified environment where data teams can work together seamlessly, enabling faster and more efficient data-driven solutions. Whether you are processing large datasets or building machine learning models, Databricks offers the tools and flexibility you need.
Website: https://www.databricks.com/
Key Features
Databricks stands out due to its user-centric design and robust capabilities. Here are some of its key features:
| Feature | Description |
|---|---|
| Collaborative Workspace | Enables data teams to share code, insights, and results in real time. |
| Multi-Language Support | Accommodates Python, R, Scala, and SQL, ensuring flexibility for diverse teams. |
| Integration with Apache Spark | Leverages Spark for high-performance data processing and analytics. |
| Real-Time Data Processing | Supports real-time analytics for immediate insights. |
| Machine Learning Capabilities | Provides tools to streamline the entire machine learning lifecycle. |
| Customization and Control | Allows users to optimize cluster performance based on specific needs. |
This combination of features makes Databricks a versatile platform for handling complex data workflows.
Benefits
Databricks offers several advantages that enhance its appeal as a big data tool:
- Enhanced Collaboration: The platform fosters teamwork by allowing data professionals to work together in a shared environment. This accelerates project timelines and encourages innovation.
- Flexibility: With support for multiple programming languages, Databricks adapts to the unique workflows of your team.
- Efficient Data Processing: By integrating Apache Spark, Databricks ensures fast and reliable handling of large datasets.
- Real-Time Insights: The platform’s real-time processing capabilities allow you to analyze data as it is generated.
- Streamlined Machine Learning: Databricks simplifies the development, training, and deployment of machine learning models, saving you time and effort.
- Customizable Performance: You can optimize cluster configurations to meet your specific data processing requirements.
These benefits make Databricks an essential tool for organizations aiming to stay competitive in a data-driven world.
Use Cases
Databricks is widely used across industries for various applications:
- Retail: Analyze customer behavior and optimize inventory management using real-time data insights.
- Finance: Detect fraud and manage risks by processing transactional data streams.
- Healthcare: Build predictive models to improve patient care and operational efficiency.
- Manufacturing: Integrate IoT data from production lines for real-time monitoring and predictive maintenance.
- Data Science: Accelerate machine learning workflows by leveraging Databricks’ computational power.
FanRuan’s products—FineBI, FineReport, and FineDataLink—complement Databricks perfectly. FineBI enhances Databricks’ analytics capabilities by enabling self-service exploration of processed data. FineReport generates detailed reports, ensuring clarity and precision in presenting insights. FineDataLink facilitates seamless data integration, connecting Databricks to other data sources for a unified analytics experience. Together, these tools create a robust ecosystem for big data analytics, empowering you to make informed decisions.
Tip: Combining Databricks with FanRuan’s suite of products ensures a seamless workflow for data integration, processing, and visualization. This approach maximizes the value of your big data investments.
7.Snowflake: Scalable Big Data Software for Cloud

Snowflake has revolutionized how you manage and analyze data in the cloud. Its innovative design and robust capabilities make it one of the most scalable big data software solutions available today. Whether you are handling terabytes of data or running complex machine learning models, Snowflake ensures seamless performance and efficiency.
Website: https://www.snowflake.com/en/
Key Features
Snowflake stands out due to its unique architecture and advanced features:
- Cloud-native architecture: Snowflake leverages cloud infrastructure to enhance availability and performance while reducing management complexity.
- Separation of storage and compute: This feature allows you to scale resources independently, optimizing costs and maintaining consistent performance.
- Scalability: Snowflake accommodates varying workloads efficiently, ensuring smooth operations regardless of data volume.
- SQL optimization: The platform uses columnar storage and caching techniques to execute queries quickly and efficiently.
- Dynamic resource allocation: Snowflake adjusts compute resources based on workload demands, enabling real-time data processing.
These features make Snowflake a powerful tool for managing extensive data workloads and performing advanced analytics.
Benefits
Snowflake offers several advantages that enhance its appeal as a big data solution:
- Cost efficiency: By separating storage and compute, Snowflake lets you pay only for the resources you use. This flexibility reduces unnecessary expenses.
- Consistent performance: Its architecture ensures reliable performance, even when handling large datasets or running complex queries.
- Support for machine learning: Snowflake integrates seamlessly with machine learning workflows, enabling you to build predictive models and analyze data efficiently.
- Ease of use: The platform simplifies data management with its serverless design, making it accessible to users with varying technical expertise.
- Versatility: Snowflake supports diverse use cases, from real-time data processing to advanced analytics, across multiple industries.
Snowflake’s ability to scale effortlessly and process data efficiently makes it a cornerstone for modern data-driven organizations.
Use Cases
Snowflake is widely adopted across industries due to its flexibility and performance:
- Finance: Financial institutions use Snowflake for fraud detection and risk management. Its real-time processing capabilities ensure timely insights.
- Healthcare: Snowflake supports predictive modeling for patient care, analyzing medical data to identify potential health risks.
- Retail: Retailers rely on Snowflake to analyze customer behavior and optimize inventory management.
- Manufacturing: Snowflake integrates IoT data from production lines, enabling real-time monitoring and predictive maintenance.
FanRuan’s products—FineBI, FineReport, and FineDataLink—complement Snowflake perfectly. FineBI enhances Snowflake’s analytics capabilities by enabling self-service exploration of processed data. FineReport generates detailed reports, ensuring clarity and precision in presenting insights. FineDataLink facilitates seamless data integration, connecting Snowflake to other data sources for a unified analytics experience. Together, these tools create a robust ecosystem for big data analytics, empowering you to make informed decisions.
Tip: Combining Snowflake with FanRuan’s suite of products ensures a seamless workflow for data integration, processing, and visualization. This approach maximizes the value of your big data investments.
8.Amazon EMR: Big Data Tools for Processing on AWS
Amazon EMR (Elastic MapReduce) is a powerful tool for processing big data on AWS. It simplifies the management of big data frameworks like Apache Hadoop and Apache Spark, enabling you to analyze vast datasets efficiently. With its scalability and cost-effectiveness, Amazon EMR has become a preferred choice for enterprises seeking to harness the power of big data.
Website: https://aws.amazon.com/emr/
Key Features
Amazon EMR offers a range of features that make it indispensable for big data processing:
- Scalability: Amazon EMR dynamically adjusts resources based on your workload. Whether you need a few instances or hundreds, it scales effortlessly to meet your data processing demands.
- Cost Efficiency: By utilizing EC2 Spot Instances, Amazon EMR significantly reduces costs for large-scale data workloads. It also supports flexible pricing options, including reserved and on-demand instances.
- Seamless Integration: Amazon EMR integrates with other AWS services like S3, RDS, and Glue, streamlining workflows and enhancing efficiency.
- Support for Machine Learning: With its integration with Apache Spark, Amazon EMR enables you to build and train machine learning models on large datasets.
| Metric | Description |
|---|---|
| Scalability | Easily scales clusters from a few instances to hundreds based on workload demands. |
| Cost Efficiency | Supports Spot instances, reserved instances, and on-demand pricing options to optimize costs. |
| Seamless Integration | Works seamlessly with AWS services like S3, RDS, and Glue for efficient workflows. |
Benefits
Amazon EMR provides several advantages that make it a cornerstone for big data processing:
- Enhanced Performance: Amazon EMR processes large volumes of data quickly and efficiently, enabling you to derive insights faster.
- Reduced Costs: Its cost-efficient pricing models and use of Spot Instances help you save significantly on infrastructure expenses.
- Real-Time Processing: With its support for Apache Spark, Amazon EMR allows real-time data processing, ensuring timely decision-making.
- Flexibility: You can customize clusters to suit your specific data needs, whether for analytics, machine learning, or ETL tasks.
- Enterprise Adoption: Amazon EMR ranks among the top big data tools used by enterprises, reflecting its reliability and effectiveness.
Amazon's own use of big data technologies, including Amazon EMR, has led to significant performance improvements. It processes large datasets efficiently, making it a trusted choice for enterprises worldwide.
Use Cases
Organizations across industries rely on Amazon EMR for various applications:
- Retail: Analyze customer behavior and optimize inventory management by processing transactional data in real time.
- Finance: Detect fraud and manage risks using machine learning models built on Amazon EMR.
- Healthcare: Process medical data to identify potential health risks and improve patient care.
- Manufacturing: Integrate IoT data from production lines for real-time monitoring and predictive maintenance.
FanRuan’s products—FineBI, FineReport, and FineDataLink—complement Amazon EMR perfectly. FineBI enables you to visualize Amazon EMR’s processed data through interactive dashboards, empowering self-service analytics. FineReport generates detailed reports, ensuring clarity and precision in presenting insights. FineDataLink facilitates seamless data integration, connecting Amazon EMR to other data sources for a unified analytics experience. Together, these tools create a robust ecosystem for big data processing and analytics, helping you make informed decisions.
Tip: Combining Amazon EMR with FanRuan’s suite of products ensures a seamless workflow for data integration, processing, and visualization. This approach maximizes the value of your big data investments.
9.FanRuan FineBI: Self-Service Big Data Tools
Overview of FineBI
Definition of FineBI
FineBI is a self-service business intelligence tool designed to simplify data analysis and visualization. It empowers you to explore, process, and interpret data independently without relying heavily on IT teams. FineBI bridges the gap between technical and non-technical users, making big data accessible across your organization.

Website: https://www.fanruan.com/en/finebi
Key Features of FineBI
FineBI offers a range of features that enhance its usability and effectiveness:
- Data Integration: Connect to diverse data sources, including big data platforms like Hadoop and relational databases such as MySQL and Oracle.
- Self-Service Analytics: Perform exploratory analysis with drag-and-drop functionality, enabling you to uncover insights quickly.
- Real-Time Data Processing: Analyze updated data instantly, ensuring timely decision-making.
- Collaboration Tools: Share dashboards and analysis with your team, fostering a collaborative environment.
- Advanced Visualizations: Choose from over 60 chart types to create compelling dashboards and reports.
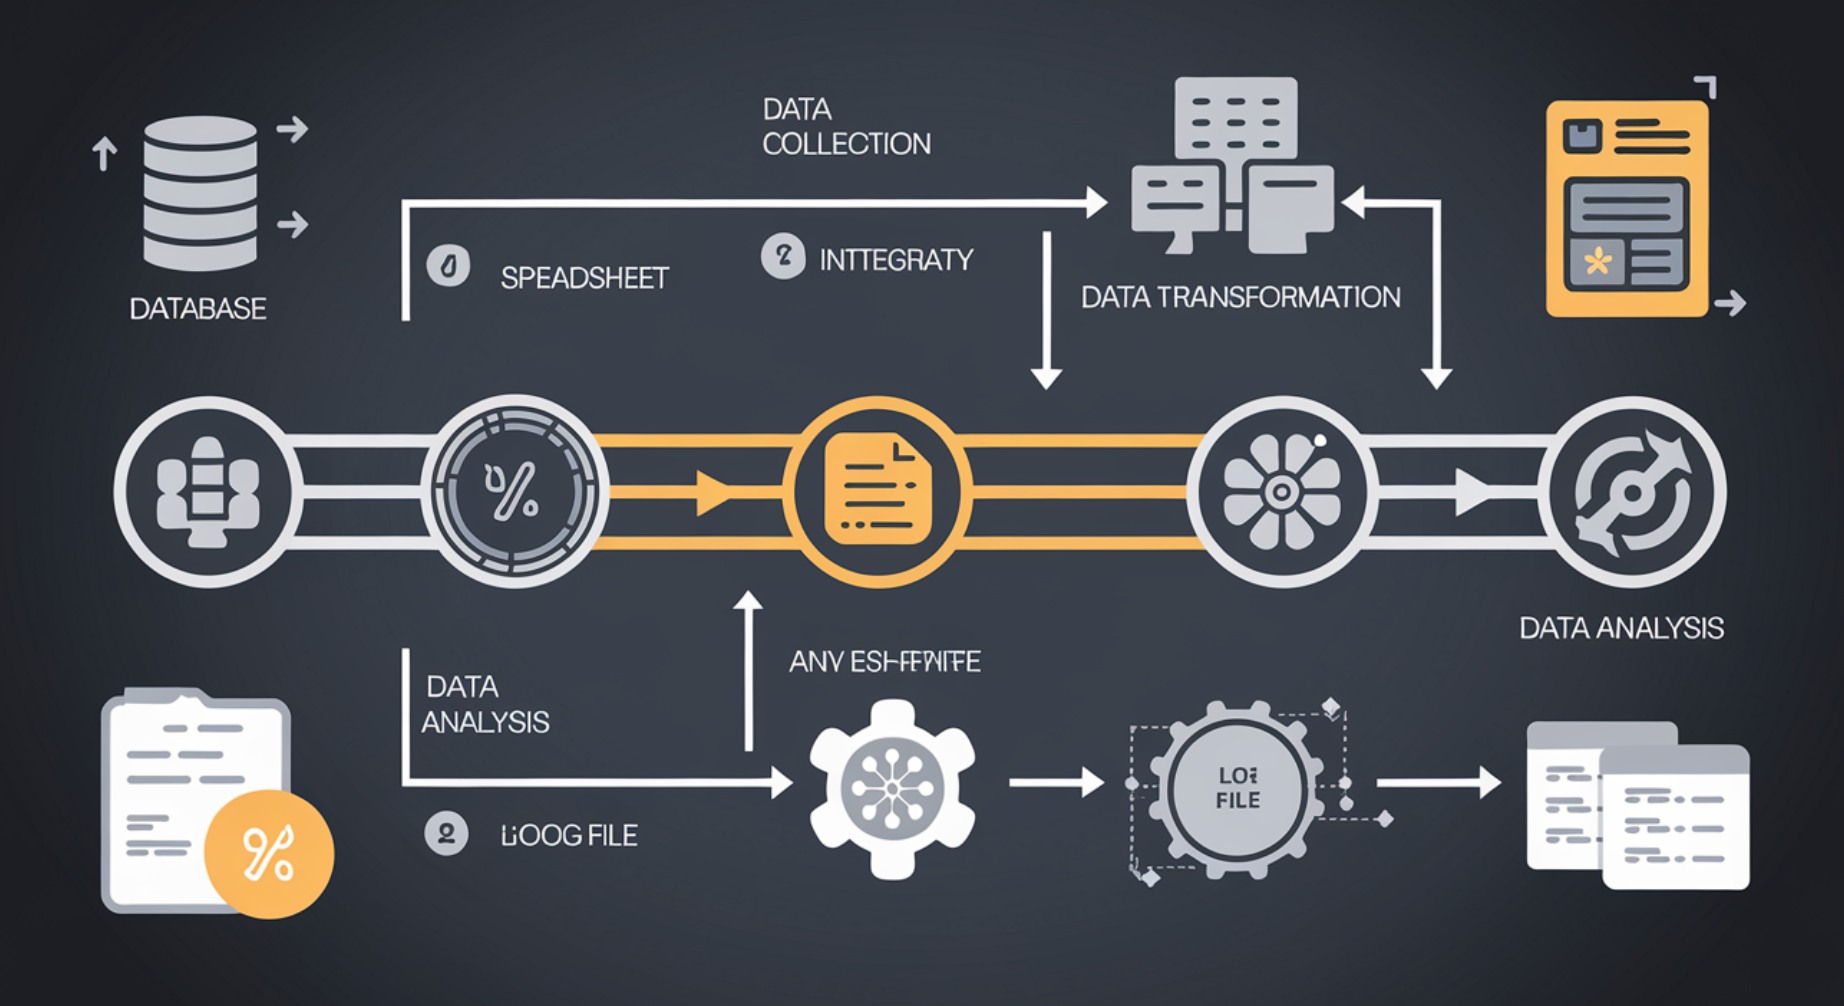
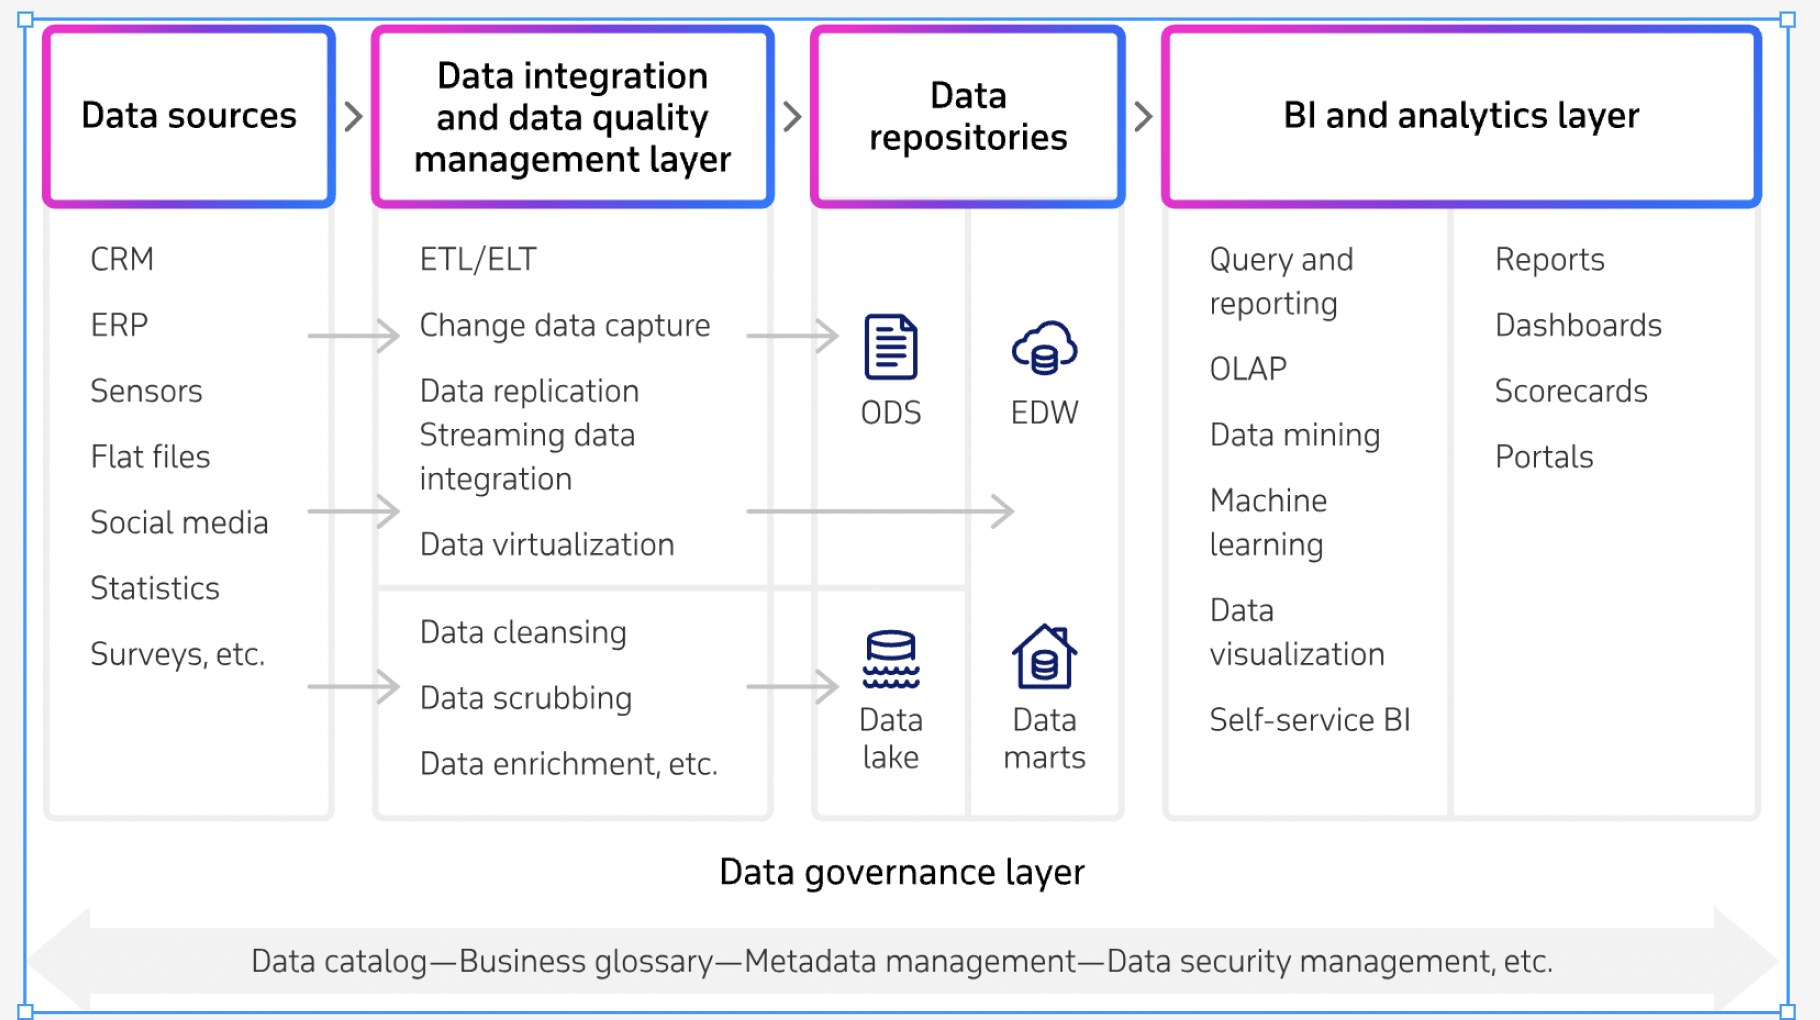
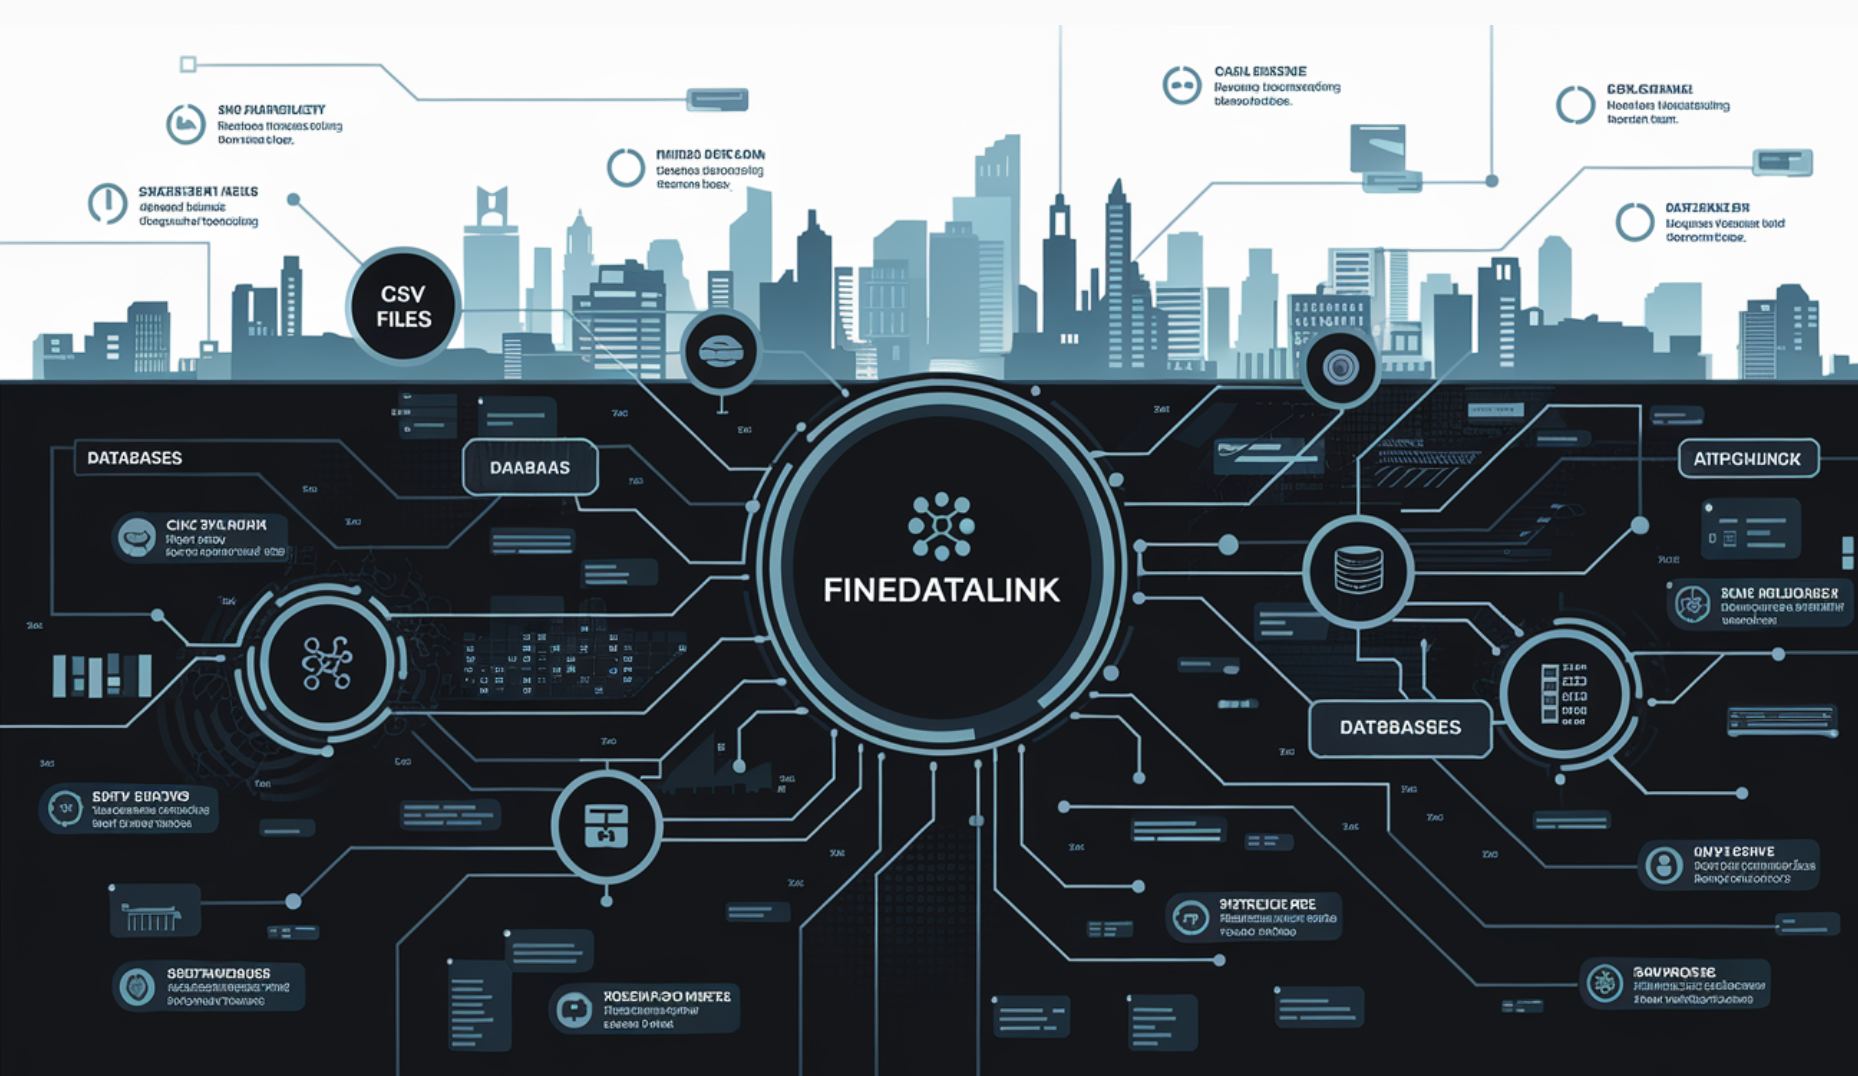
FineDataLink complements Redshift by addressing data integration challenges, supporting over 100 data sources and enabling real-time synchronization for enhanced accuracy. In the data governance full-link diagram below, FanRuan's products cover the second and fourth core steps. FineDataLink belongs to the Data Integration and Data Quality Management Layer, focusing on efficient data integration and quality management. FineBI and FineReport are part of the BI and Analytics Layer, providing actionable insights and intuitive dashboards for enriched analytics.Together, these tools ensure a seamless and effective data governance process, highlighting FanRuan's strengths in integration, quality management, and analytics.
Advantages of FineBI
User Empowerment
FineBI enables you to take control of your data. Its intuitive interface allows you to process and analyze data without technical expertise. This self-service approach reduces dependency on IT teams, speeding up decision-making.
Cost Efficiency
FineBI optimizes your resources by streamlining data processing and analysis. Its ability to integrate with existing systems minimizes additional infrastructure costs. By combining FineBI with FineDataLink, you can further reduce expenses through efficient data synchronization.
Rapid Deployment
FineBI’s user-friendly design ensures quick implementation. You can set up dashboards and start analyzing data within hours. Its compatibility with FineReport and FineDataLink enhances deployment speed, creating a unified platform for big data solutions.
Use Cases for FineBI
Business Intelligence Solutions
FineBI excels in business intelligence applications. It helps you monitor KPIs, track performance, and make data-driven decisions. By integrating FineBI with FineReport, you can generate detailed reports that complement your dashboards, providing a comprehensive view of your data.
Data Visualization Projects
FineBI’s advanced visualization capabilities make it ideal for data visualization projects. You can create interactive dashboards that highlight trends and anomalies. FineDataLink ensures real-time data updates, keeping your visualizations accurate and relevant.
Performance Monitoring
FineBI supports performance monitoring across industries. For example, manufacturers can use it to track production efficiency, while retailers can analyze sales performance. Its integration with FineDataLink enables real-time monitoring, ensuring you stay ahead of potential issues.
Tip: Combining FineBI, FineReport, and FineDataLink creates a powerful ecosystem for big data analytics. FineBI empowers you to explore data independently, FineReport delivers precise reporting, and FineDataLink ensures seamless data integration.
Comparison with Other Big Data Tools
FineBI vs. Tableau
FineBI and Tableau both excel in data visualization and analysis, but they cater to different needs. Tableau focuses on creating visually stunning dashboards with advanced customization options. It is ideal for users who prioritize design and interactivity. FineBI, on the other hand, emphasizes self-service analytics and ease of use. Its intuitive interface allows you to explore data independently, even without technical expertise.
FineBI integrates seamlessly with FineReport and FineDataLink, creating a unified ecosystem for big data solutions. FineReport generates pixel-perfect reports, while FineDataLink ensures real-time data synchronization. This integration enhances FineBI’s capabilities, making it a comprehensive tool for data-driven decision-making. Tableau, while powerful, lacks this level of integration with other tools, which can limit its functionality in complex workflows.

FineBI vs. Power BI
Power BI and FineBI share a focus on self-service analytics, but their approaches differ. Power BI integrates deeply with Microsoft products like Excel and Azure, making it a strong choice for organizations already using the Microsoft ecosystem. FineBI, however, offers greater flexibility in connecting to diverse data sources, including big data platforms like Hadoop.
FineBI’s collaboration features also stand out. Teams can share dashboards and analysis within the platform, fostering a collaborative environment. Power BI provides similar features but often requires additional configurations for seamless teamwork. FineBI’s integration with FineReport and FineDataLink further strengthens its position. This trio enables you to manage data processing, visualization, and reporting in one cohesive system, streamlining your workflows.
Integration with Big Data Tools
Connecting to Apache Hadoop
FineBI connects effortlessly to Apache Hadoop, one of the most foundational big data tools. This connection allows you to analyze large datasets stored in Hadoop Distributed File System (HDFS). FineBI’s self-service analytics capabilities enable you to explore Hadoop data without relying on IT teams.
FineDataLink enhances this integration by synchronizing data between Hadoop and FineBI in real time. It reduces latency and ensures you always work with the most current data. FineReport complements this setup by generating detailed reports from Hadoop datasets, providing a clear and accurate representation of your insights.

Integrating with Google BigQuery
Google BigQuery, a cloud-based big data platform, integrates seamlessly with FineBI. This combination allows you to analyze massive datasets stored in BigQuery while leveraging FineBI’s advanced visualization tools.
FineDataLink plays a crucial role in this integration. It ensures smooth data synchronization between BigQuery and FineBI, enabling real-time analytics. FineReport adds value by creating detailed reports from BigQuery data, ensuring clarity and precision in your presentations. Together, these tools create a robust ecosystem for big data processing and analysis.
Best Practices for FineBI
Creating Interactive Dashboards
To create effective dashboards in FineBI, focus on simplicity and clarity. Use charts and graphs that convey information quickly. Group related data points together to make insights easier to understand. FineBI’s drag-and-drop functionality simplifies this process, allowing you to design dashboards that highlight key trends and anomalies.
FineReport complements this by generating detailed reports that provide additional context for your dashboards. FineDataLink ensures your dashboards always display the most current data, enhancing their accuracy and relevance.
Ensuring Data Quality
Data quality is critical for reliable analytics. Always validate your data sources before importing them into FineBI. Use FineBI’s built-in tools to clean and organize datasets. Regularly update your data connections to ensure they reflect the latest information.
FineDataLink plays a vital role in maintaining data quality. Its real-time synchronization capabilities ensure that FineBI always works with accurate and up-to-date data. FineReport adds another layer of reliability by generating reports that highlight anomalies or inconsistencies in your datasets.
Tip: Combining FineBI, FineReport, and FineDataLink creates a powerful ecosystem for big data analytics. FineBI empowers you to explore data independently, FineReport delivers precise reporting, and FineDataLink ensures seamless data integration.
Future Developments in FineBI
AI and Automation Features
FineBI is set to revolutionize how you interact with big data by integrating advanced AI and automation features. These developments aim to simplify data processing and enhance decision-making. AI will enable FineBI to identify patterns and trends in your data automatically. For example, it can highlight anomalies in sales figures or predict customer behavior based on historical data. This capability will save you time and provide actionable insights without requiring manual analysis.
Automation will further streamline your workflows. FineBI will automate repetitive tasks like data cleaning, report generation, and dashboard updates. Imagine setting up a dashboard that refreshes itself with real-time data, eliminating the need for manual intervention. This feature ensures you always have the most accurate and up-to-date information at your fingertips.
When combined with FineDataLink, these AI and automation features become even more powerful. FineDataLink ensures seamless data synchronization across multiple sources, enabling FineBI to process data in real time. FineReport complements this setup by generating detailed reports that present AI-driven insights clearly. Together, these tools create a cohesive system for big data analytics, empowering you to make informed decisions quickly.
Enhanced Collaborative Tools
Collaboration is essential in today’s data-driven world, and FineBI is evolving to meet this need. Future updates will introduce enhanced collaborative tools that allow your team to work together more effectively. For instance, multiple users will be able to edit and share dashboards simultaneously. This feature fosters teamwork and ensures everyone stays aligned on key metrics.
FineBI will also integrate more deeply with communication platforms. Imagine receiving real-time updates on your dashboards directly in your team’s chat application. This integration will keep your team informed and enable faster decision-making.
The collaborative capabilities of FineBI are amplified when used alongside FineReport and FineDataLink. FineReport allows you to share pixel-perfect reports with stakeholders, ensuring clarity and precision. FineDataLink keeps your team working with the most current data by synchronizing updates in real time. This trio of tools creates a unified environment where collaboration thrives, making it easier for your team to achieve its goals.
Tip: By leveraging FineBI’s AI, automation, and collaborative tools, you can unlock the full potential of your big data ecosystem.
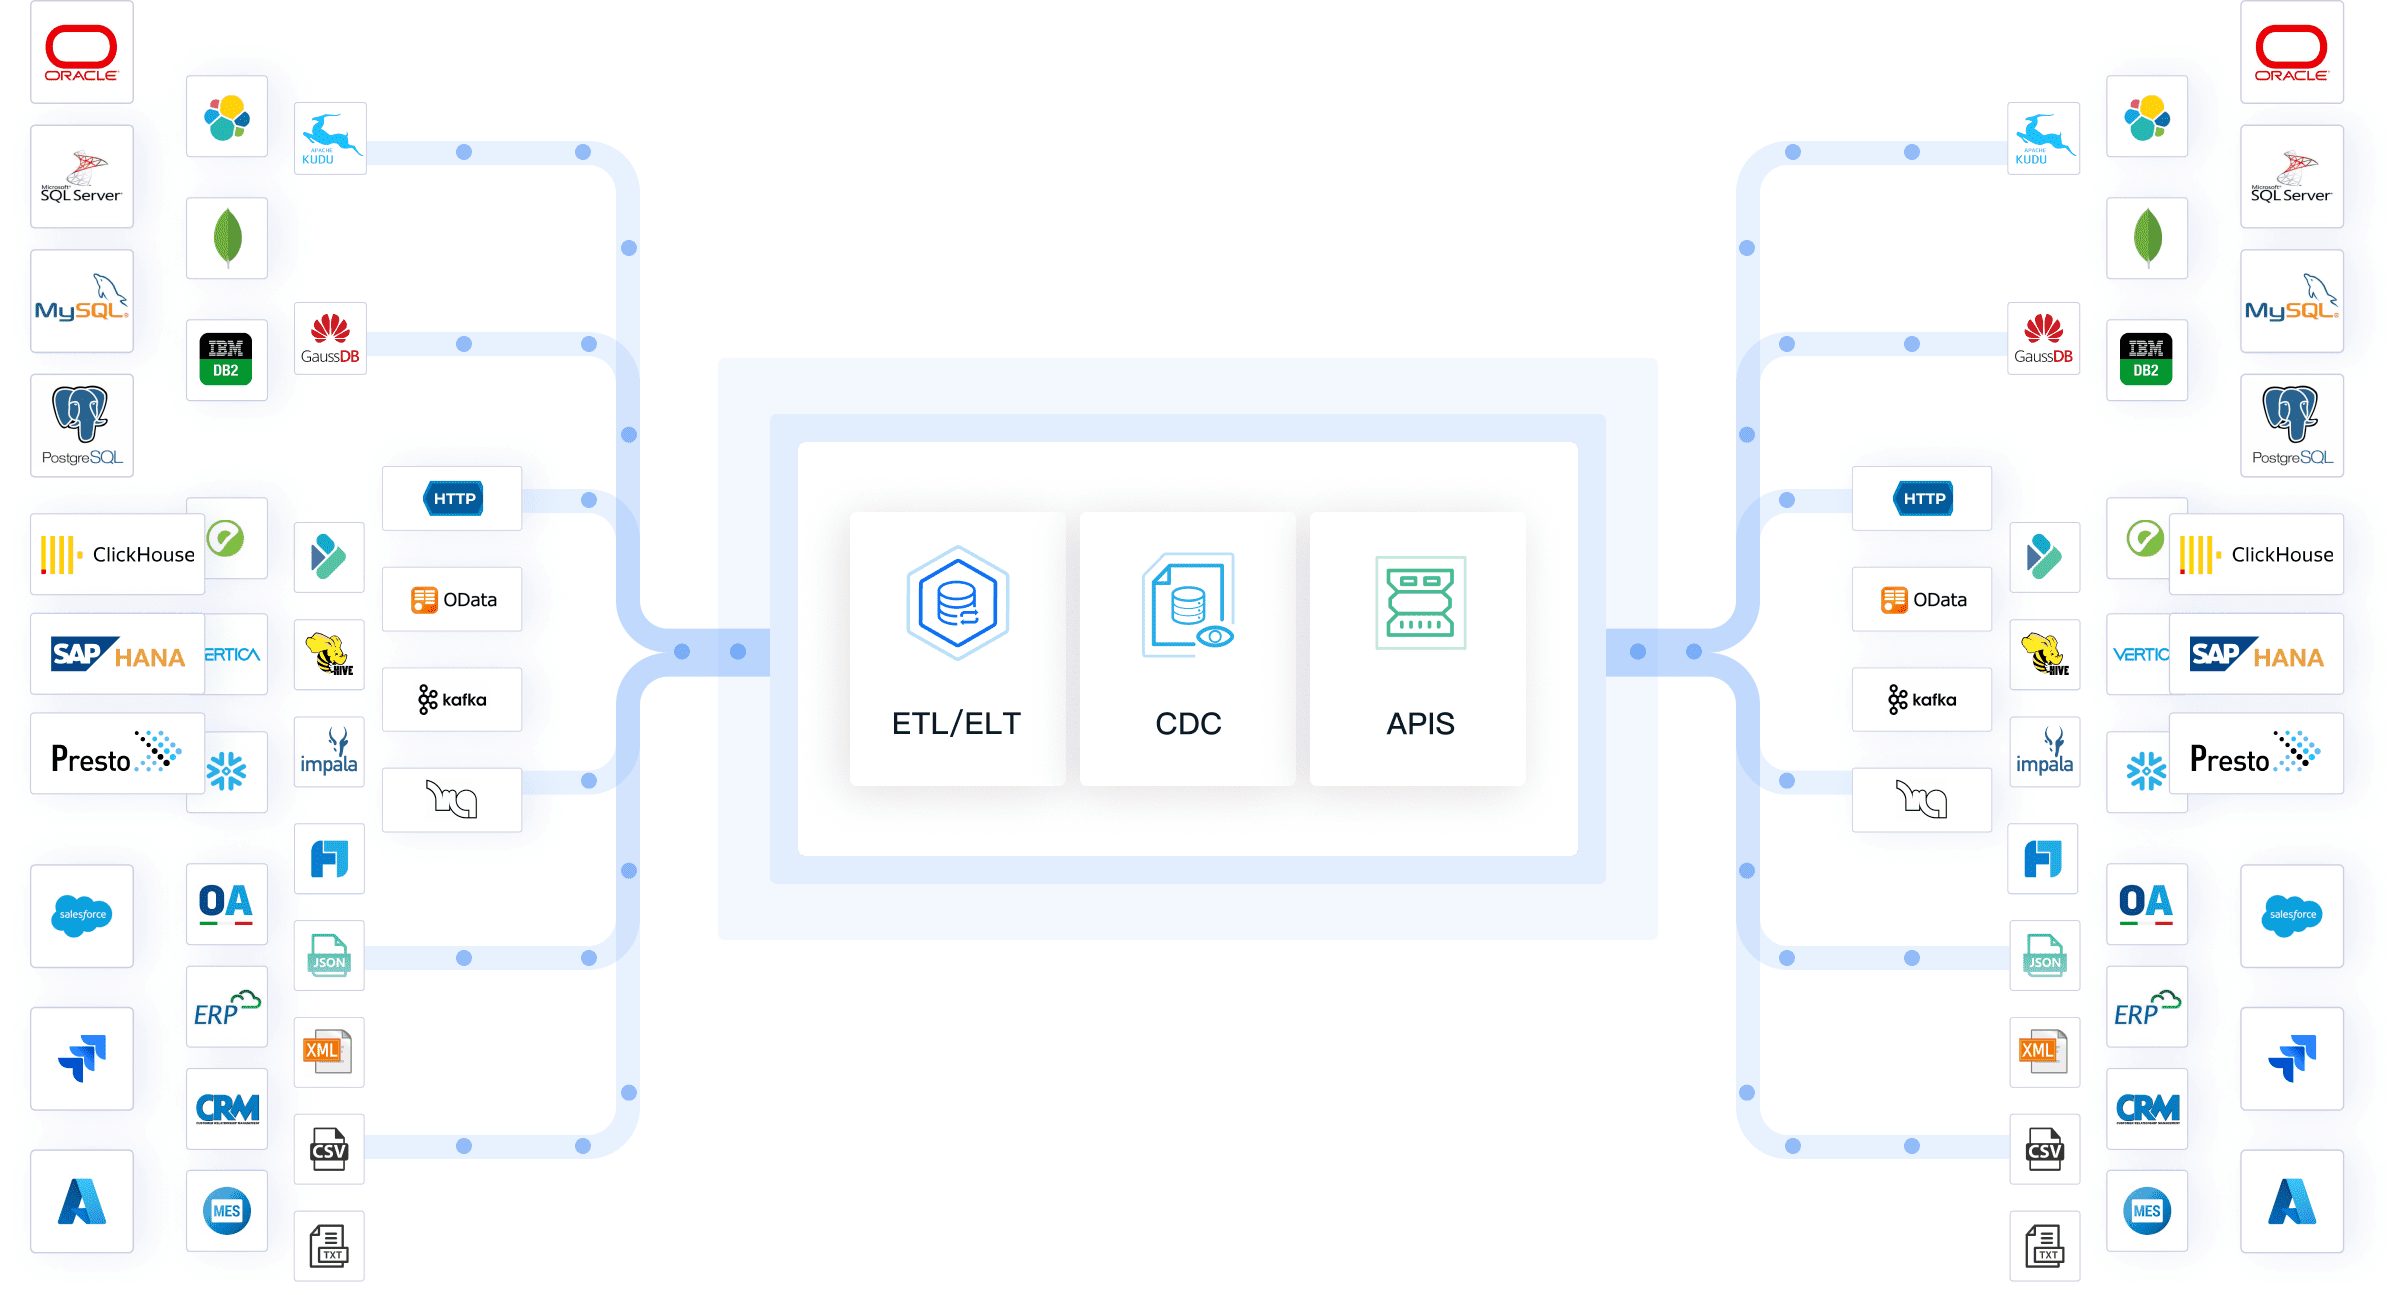
10.FanRuan FineDataLink: Big Data Tools
Key Features
FanRuan‘s FineDataLink simplifies how you integrate and process data from multiple sources. Its real-time synchronization ensures that your data remains up-to-date across systems. This feature is essential for tasks like database migration or building real-time data warehouses. FineDataLink also supports advanced ETL (Extract, Transform, Load) and ELT (Extract, Load, Transform) processes. These capabilities allow you to preprocess data efficiently, making it ready for analysis.
Website: https://www.fanruan.com/en/finedatalink
Another standout feature is its low-code API development. You can create and deploy APIs in just minutes without writing complex code. This functionality enables seamless data sharing between systems, especially for SaaS applications. FineDataLink supports over 100 data sources, including relational databases, big data platforms, and cloud services. Its visual interface makes it easy for you to manage data pipelines, reducing the complexity of data integration tasks.
Benefits
FineDataLink offers several advantages that enhance your data processing workflows. Its real-time synchronization minimizes latency, ensuring that your data is always current. This feature is particularly useful for businesses that rely on real-time insights. The platform’s low-code design reduces the technical expertise required, making it accessible to a broader range of users.
By integrating FineDataLink with FineBI and FineReport, you can create a unified ecosystem for big data analytics. FineDataLink handles data integration and synchronization, ensuring that FineBI and FineReport always work with accurate and up-to-date data. FineBI empowers you to explore and visualize this data independently, while FineReport generates detailed, pixel-perfect reports. Together, these tools streamline your data workflows and improve decision-making efficiency.
FineDataLink also enhances scalability. Its ability to handle large datasets ensures that your system grows with your business needs. Additionally, its support for diverse data sources eliminates the need for multiple integration tools, reducing costs and simplifying operations.

Use Cases
FineDataLink is versatile and supports various applications across industries. In retail, you can use it to integrate sales data from multiple channels, enabling real-time inventory management. In healthcare, FineDataLink synchronizes patient records across systems, improving care coordination. For finance, it facilitates fraud detection by integrating transactional data from different sources in real time.
Manufacturers benefit from FineDataLink by using it to process IoT data from production lines. This capability enables real-time monitoring and predictive maintenance. When combined with FineBI, you can visualize this data through interactive dashboards. FineReport complements this setup by generating detailed reports that highlight key performance metrics.
FineDataLink’s integration with big data platforms like Hadoop and cloud services like Google BigQuery further expands its use cases. It ensures seamless data flow, enabling you to focus on analytics and machine learning tasks. This integration creates a robust foundation for data-driven decision-making.
Tip: Combining FineDataLink with FineBI and FineReport creates a powerful ecosystem for managing, visualizing, and reporting big data. This approach maximizes the value of your data investments.
How to Choose the Right Big Data Tools
Choosing the right big data tools can transform how you manage and analyze data. To make an informed decision, focus on three critical aspects: scalability and performance, ease of use and accessibility, and cost and ROI.
Scalability and Performance
Scalability ensures your tools can handle growing data volumes and workloads. Performance determines how efficiently they process data and deliver insights. When evaluating tools, consider their ability to scale horizontally as your data increases. For example, platforms like Snowflake separate storage and compute, allowing you to scale resources independently. Similarly, Amazon EMR dynamically adjusts resources based on workload demands, ensuring consistent performance.
Big data tools must also support diverse data types and sources. Tools like FineDataLink excel in this area by integrating over 100 data sources, including relational databases and big data platforms. Its real-time synchronization ensures seamless data flow, even during high-volume processing tasks. FineBI complements this by enabling self-service analytics, allowing you to explore data independently. FineReport adds value by generating detailed reports that highlight trends and anomalies, ensuring clarity in decision-making.
| Key Factor | Description |
|---|---|
| Scalability | Handles growing data volumes and scales horizontally as data increases. |
| Data Volume and Variety | Efficiently processes diverse data types and supports multiple data sources. |
| Integration Complexity | Manages complex data transformations and integration scenarios with advanced functions. |
Ease of Use and Accessibility
Ease of use determines how quickly you can adopt a tool and start analyzing data. Accessibility ensures that users across your organization can leverage its features. Tools with intuitive interfaces, like FineBI, simplify data exploration with drag-and-drop functionality. This design empowers non-technical users to create dashboards and analyze data without relying on IT teams.
Accessibility also includes compatibility with existing systems. FineDataLink’s low-code API development allows you to integrate data across platforms in minutes. This feature ensures that your tools work seamlessly with your current infrastructure. FineReport enhances accessibility by providing pixel-perfect reports that are easy to share and understand, fostering collaboration across teams.
| Criteria | Source |
|---|---|
| Ease of Use and Learning Curve | Data Integration — Picking the Right Tools in 2025 |
| Supported Data Types | 9 Top Big Data Analytics Tools For 2025 |
| Data Visualization Capabilities | 9 Top Big Data Analytics Tools For 2025 |
Cost and ROI
Cost efficiency is vital when selecting big data tools. Look for platforms that optimize resources and minimize expenses. Snowflake’s pay-as-you-go model lets you pay only for the storage and compute you use, reducing unnecessary costs. Amazon EMR offers flexible pricing options, including Spot Instances, which significantly lower expenses for large-scale processing.
ROI (Return on Investment) measures the value a tool brings to your organization. FineBI boosts ROI by enhancing data analysis efficiency, reducing dependency on IT teams, and empowering users to make faster decisions. FineDataLink further improves ROI by streamlining data integration, saving time and resources. FineReport ensures your data insights are presented clearly, enabling stakeholders to act on them effectively.
By combining FineBI, FineReport, and FineDataLink, you create a unified ecosystem for big data analytics. FineBI empowers you to explore data independently, FineReport delivers precise reporting, and FineDataLink ensures seamless data integration. Together, these tools maximize your ROI and simplify your workflows.
Tip: Prioritize tools that balance scalability, ease of use, and cost efficiency. This approach ensures your big data investments deliver long-term value.
Integration with Existing Systems
Integrating big data tools with your existing systems can significantly enhance your organization's efficiency. Tools like FineBI, FineDataLink, and FineReport simplify this process by offering seamless compatibility with various platforms. FineBI connects to diverse data sources, including relational databases, big data platforms, and cloud services. This capability ensures that you can analyze data from multiple systems without additional complexity.
FineDataLink plays a crucial role in real-time data processing. It synchronizes data across systems, ensuring consistency and accuracy. For example, you can use FineDataLink to integrate data from legacy systems with modern platforms like Hadoop or Google BigQuery. This integration allows you to build a unified data warehouse for advanced analytics.
FineReport complements this ecosystem by providing dynamic visualizations. It integrates with FineBI and FineDataLink to transform raw data into interactive dashboards. These dashboards enable you to monitor key metrics and identify trends in real time. Together, these tools create a cohesive environment for managing, processing, and visualizing data.
Community Support and Documentation
When adopting big data tools, community support and documentation are essential. FanRuan's products excel in this area. FineBI offers extensive tutorials and a user-friendly interface, making it accessible even to non-technical users. Its active community provides solutions to common challenges, ensuring you can maximize its potential.
FineDataLink includes detailed documentation for setting up data pipelines and APIs. This guidance simplifies complex tasks like ETL and ELT processes. Additionally, its low-code platform reduces the learning curve, enabling faster adoption.
FineReport benefits from a growing user base that shares best practices for creating effective visualizations. Its intuitive design and comprehensive resources empower you to unlock the full value of your data. By leveraging these tools, you gain access to a supportive ecosystem that fosters innovation and collaboration.
Why FanRuan’s FineBI, FineDataLink, and FineReport Stand Out
FanRuan's suite of tools stands out due to its seamless integration and user-centric design. FineBI empowers you to explore data independently through self-service analytics. Its drag-and-drop functionality simplifies data analysis, enabling faster decision-making. FineDataLink ensures that your data remains accurate and up-to-date by synchronizing it across systems in real time. This capability is vital for tasks like machine learning, where data consistency is critical.
FineReport enhances this ecosystem by transforming processed data into actionable insights. Its zero-code interface allows you to create interactive dashboards without technical expertise. These dashboards provide a clear view of your data, helping you identify trends and anomalies quickly.
The synergy between these tools creates a powerful ecosystem for big data processing and analytics. FineBI enables exploration, FineDataLink ensures integration, and FineReport delivers visualization. Together, they streamline your workflows and maximize the value of your data investments.
Tip: By combining FineBI, FineDataLink, and FineReport, you can build a robust foundation for data-driven decision-making. This approach ensures that your organization stays competitive in a rapidly evolving landscape.
The top 12 big data tools highlighted in this blog demonstrate their critical role in shaping industries in 2026. These tools empower businesses to harness big data for actionable insights, whether in healthcare, retail, or supply chain management. For instance, the healthcare big data analytics market is projected to reach $134.9 billion by 2032, while the retail sector is expected to grow at a CAGR of 21.8%, reaching $52.94 billion by the same year. Such growth underscores the importance of selecting tools that align with your business goals.
FanRuan’s FineBI, FineDataLink, and FineReport offer a cohesive ecosystem for big data solutions. FineBI esnables self-service analytics, FineDataLink ensures seamless data integration, and FineReport transforms raw data into dynamic visualizations. Together, they simplify workflows and maximize the value of your data investments. By choosing tools tailored to your needs, you can stay competitive in an increasingly data-driven world.
Click the banner below to try FineBI for free and empower your enterprise to transform data into productivity!
Continue Reading About Data Analysis
How to Fix Data Analysis Excel Not Showing in 2026
What is SaaS Analytics and Why Businesses Need It
Top Beginner-Friendly Data Analysis Projects to Build Your Portfolio
Data Analysis vs Data Analytics: What’s the Real Difference?


FAQ

The Author
Lewis
Senior Data Analyst at FanRuan
Related Articles

What Recruiters Look for in a Data Analysis Portfolio: 10 Criteria to Score Yours Fast
A $1 is not judged like a school assignment. It is judged like a hiring shortcut. Recruiters, hiring managers, and analytics leads use it to answer one question fast: Can this person solve business problems with data in
Lewis Chou
May 29, 2026

What Is Data Analytics Consulting? Beginner’s Guide to Services, Deliverables, and Business Value
$1 helps organizations turn raw data into decisions they can trust. For many business leaders, the challenge is not a lack of data. It is a lack of clarity. Reports conflict, teams track different KPIs, dashboards are un
Lewis Chou
Jun 03, 2026

Data Analyst Job Description [+2026 Guide]: Compare Responsibilities, Skills, and Salary by Industry
A strong $1 does more than list tasks. It defines how a company turns raw data into business decisions, which teams the analyst supports, and what measurable outcomes the role is expected to influence. For employers, tha
Lewis Chou
Jun 02, 2026