An inventory dashboard is a digital tool that displays key inventory metrics and trends in one interactive view. You use it to monitor stock levels, track product movement, and analyze supply chain performance. The dashboard helps you spot issues fast and make better decisions for your business. Real-time data from inventory dashboards improves efficiency by giving you instant updates on inventory. You avoid stockouts and overstocking, and you respond quickly to market changes. FineReport offers advanced inventory dashboard solutions that support real-time visibility and smarter management.
Inventory Dashboard Overview
What Is an Inventory Dashboard?
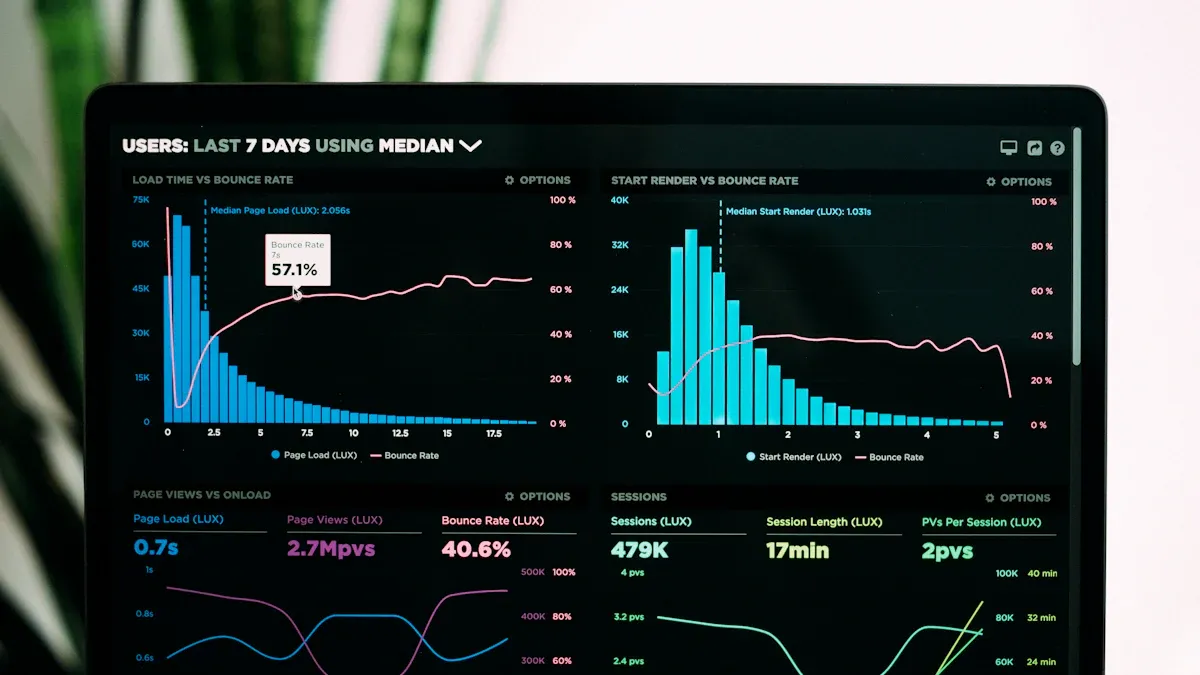
An inventory dashboard is a visual tool that helps you manage and monitor your inventory. You see all the important metrics in one place, including stock levels, sales, forecasts, and supply chain performance. This dashboard gives you a clear overview of your inventory health. You can track trends, spot potential issues, and make quick decisions. Businesses use inventory management dashboards to oversee stock availability and detect problems before they affect operations.
An inventory management dashboard serves as a visual tool that aggregates and presents essential metrics related to inventory levels, sales, forecasts, and supply chain performance. It enables you to oversee stock availability, monitor trends, and detect potential issues in real-time.
The core purpose of an inventory management dashboard is to help you run your business more efficiently. You gain transparency across complex inventory structures and improve accuracy. The dashboard supports informed decision-making by providing critical insights into inventory health.
| Core Purpose | Description |
|---|---|
| Enhancing Operational Efficiency | Inventory health dashboards create transparency across complex inventory structures. |
| Providing Real-Time Data | They enable data-based decisions to be made in real time, improving responsiveness. |
| Facilitating Informed Decision-Making | Dashboards support informed decision-making by providing critical insights into inventory health. |
How Inventory Dashboards Work
Inventory management dashboards work by integrating data from different sources. You connect your inventory management software with other business systems, such as sales, procurement, and logistics. The dashboard synchronizes information and updates metrics automatically. This process improves data visibility and accuracy. You can automate many tasks, such as tracking inventory levels and generating alerts for low stock.
Here is how an inventory management dashboard typically operates:
- Synchronizes inventory management software with other business systems.
- Improves data visibility and accuracy.
- Supports automation and enhances decision-making.
You benefit from seamless integration with your existing logistics and supply chain infrastructure. The dashboard provides immediate improvements in inventory accuracy and operational efficiency. You can track inventory movement, monitor supplier performance, and analyze sales trends in one place.
| Metric | Improvement |
|---|---|
| Operational Efficiency | 30% |
| Reduction in Inventory Discrepancies | 25% |
Inventory management dashboards also use advanced technologies to deliver real-time updates. You may see features such as sensor-driven updates, automated alerts, and predictive analytics. These tools help you anticipate stockouts, optimize delivery routes, and manage replenishment needs.
- Sensor-driven updates provide live feedback on item movement and replenishment needs.
- Automated alerts notify staff of low inventory and approaching expiry dates.
- Predictive analytics help anticipate stockouts and optimize delivery routes.
Real-Time Inventory Visibility
Real-time inventory visibility means you always know the status of your inventory. You can see stock levels, item locations, and movement as they happen. This visibility helps you respond quickly to changes in demand and avoid costly mistakes like stockouts or overstocking.
Inventory management dashboards use technologies such as RFID, IoT devices, cloud infrastructure, and automated systems to provide real-time data. These technologies enable you to track inventory accurately and make faster decisions.
| Technology | Description |
|---|---|
| RFID | Utilizes radio-frequency identification tags to track inventory in real-time, providing live feedback on item movement and conditions. |
| IoT | Internet of Things devices that monitor stock levels and environmental conditions, enabling automated alerts and predictive analytics. |
| Cloud Infrastructure | Supports centralized data management and real-time visibility across platforms, enhancing order and inventory management. |
| Automated Systems | Systems that generate alerts for low inventory and optimize replenishment processes based on predictive analytics. |
Ecommerce retailers often use cloud-based order management systems to achieve both order and inventory visibility from a single platform. This integration improves the customer experience by making shopping and fulfillment smoother and more accurate.
When you have real-time inventory visibility, you can optimize resource use and streamline operations. Automated updates reduce manual checks, saving time and minimizing errors. You can align priorities across your organization and escalate decisions when necessary. This agility helps you respond to market changes and improve overall efficiency.
Businesses that implement real-time inventory management dashboards report measurable improvements:
| Improvement Type | Before AI Adoption | After AI Adoption | Source |
|---|---|---|---|
| Inventory Accuracy | 63% | 95% | IJAEM, Sayonetech |
| Fulfillment Accuracy | N/A | 99.5% | IJAEM, Sayonetech |
| Reduction in Stockouts | N/A | 35% | Cimulate AI, Sayonetech |
| Reduction in Overstocks | N/A | 20% | Cimulate AI, Sayonetech |
| Efficiency of Demand Forecasting | N/A | 40% more efficient | Sayonetech, IJAEM |
| Reduction in Inventory Carrying Costs | N/A | 25% | Sayonetech, IJAEM |
You can see how inventory management dashboards transform inventory tracking and business operations. You gain accurate, up-to-date insights that support smarter, faster decisions. This capability helps you maintain optimal stock levels, reduce costs, and improve customer satisfaction.
Why Inventory Dashboard Matters for Businesses
Key Benefits of Inventory Management Dashboard
You rely on inventory management dashboards to keep your business running smoothly. These dashboards give you instant access to critical inventory data, helping you avoid common problems like stockouts and overstocking. Real-time inventory tracking provides visibility across all your sales channels and warehouses. You see exactly what you have and where it is, so you can reorder before stock runs out. This reduces the risk of missing sales due to empty shelves.
Inventory management dashboards also help you order only what you need. You avoid tying up cash in excess stock, which can lead to waste and higher carrying costs. With accurate tracking, you forecast demand based on actual purchase behavior. You eliminate guesswork and make smarter decisions about what to buy and when.
Tip: Use inventory management dashboards to set dynamic min/max levels for each product. This helps you adjust quickly to changes in demand and prevents both shortages and excess inventory.
Here are some ways inventory management dashboards help you manage stock more effectively:
- Real-time data enables you to order only what is needed, avoiding overstock situations.
- Accurate tracking allows for better demand forecasting and smarter purchasing.
- Automated replenishment triggers restocking based on real-time data, preventing shortages.
- Monitoring supplier performance helps you adjust reorder timing and reduce risks.
- Optimized safety stock ensures critical products are available during demand surges.
| Benefit | Description |
|---|---|
| Min/Max Levels | Dynamically adjust based on usage to prevent stockouts and overstock. |
| Identify Stockouts and Overstock | Helps in recognizing when inventory levels are critical. |
| Monitor Supplier Performance | Adjust reorder timing based on supplier reliability. |
| Forecast Demand | Anticipate needs by location or product, reducing guesswork. |
| Automated Replenishment | Triggers restocking based on real-time data, preventing shortages. |
| Optimized Safety Stock | Reduces excess inventory and ensures critical products are available during demand surges. |
Inventory management dashboards give you the tools to maintain inventory visibility and control. You respond faster to market changes and keep your business agile.
Impact on Profitability and Efficiency
Inventory management dashboards have a direct impact on your profitability and operational efficiency. You track key business KPIs such as inventory turnover rate, gross margin return on investment, and days sales of inventory. These metrics show how well you manage your inventory and how quickly you convert stock into sales.
| KPI | Description | Impact on Profitability Metrics |
|---|---|---|
| Inventory turnover rate | Measures how quickly inventory is sold and replaced. | Higher rates indicate efficiency and lower carrying costs. |
| Gross margin return on investment (GMROI) | Shows profitability of inventory investment. | Rising GMROI indicates improved efficiency in generating profit from stock. |
| Days sales of inventory (DSI) | Average number of days it takes for inventory to be sold. | Lower DSI means faster inventory movement and quicker cash conversion. |
| Stock to sales ratio | Compares inventory on hand to sales for a given period. | A balanced ratio is crucial to avoid overstocking or stockouts. |
| Inventory carrying costs | Total cost of holding inventory (storage, insurance, obsolescence). | Reducing these costs directly boosts profitability. |
You use dashboards to monitor these metrics in real time. This helps you spot inefficiencies and take action before they affect your bottom line. For example, if your inventory turnover rate drops, you can investigate the cause and adjust your purchasing or sales strategy.
Inventory management dashboards also improve operational efficiency. You get real-time insights into inventory performance, which helps you optimize inventory management. In manufacturing, dashboards streamline operations and reduce downtime. You empower your team with actionable data, improving quality and reducing missed opportunities.
- Inventory dashboards provide real-time insights into inventory performance.
- They help you optimize inventory management and reduce costs.
- Dashboards enable data-driven decision-making, which enhances operational efficiency.
- Manufacturing dashboards streamline operations and reduce downtime.
- They improve quality and empower teams with actionable data.
FineReport offers advanced inventory dashboard solutions for manufacturing companies. You can track raw material levels, production rates, and work-in-progress items. This helps you avoid delays due to shortages and keeps your production lines running smoothly.
| Dashboard Type | Key Features | Business Impact |
|---|---|---|
| Inventory Dashboard | Real-time stock levels, trend analysis for stock movement | Prevents missed sales, improves customer satisfaction, supports strategic supplier planning |
| Inventory Turnover Dashboard | Metrics for assessing inventory efficiency, balance between holding costs and sales performance | Enhances understanding of inventory management efficiency, aids in decision-making |
| Inventory Planning Dashboard | Current stock levels, past purchasing trends, future needs forecasting | Helps avoid overstocking or stockouts, refines inventory management processes |
| Manufacturing Inventory Dashboard | Reorder levels, tracking raw material levels, production rates, work-in-progress items | Optimizes inventory management, improves operational efficiency, reduces delays due to shortages |
You see measurable improvements in profitability and efficiency when you use inventory management dashboards. You reduce inventory carrying costs, improve cash flow, and increase customer satisfaction.
Role in Data-Driven Decision-Making
Inventory management dashboards play a key role in data-driven decision-making. You use real-time data to make informed choices about inventory, purchasing, and supply chain management. This reduces waste and improves profitability.
- Minimized waste: Dashboards help you identify issues like spoilage and obsolescence, so you can reduce waste and improve profitability.
- Optimized order management: You guarantee fast fulfillment and restocking, which enhances customer satisfaction and loyalty.
- Supplier management improvement: Dashboards provide data on supplier performance, enabling better partnerships and cost reductions.
Industry studies show that real-time monitoring can reduce logistics costs by up to 15 percent and lower inventory holding costs by over 30 percent. You improve service levels and make decisions quickly, based on accurate data.
A data-driven supply chain gives you clarity. You see how every decision affects financial performance, service levels, and customer satisfaction. Real-time data creates visibility across your network, allowing you to act immediately instead of relying on outdated information.
FineReport supports data-driven decision-making with customizable dashboards and automated reporting. You track business KPIs, analyze trends, and share insights across your organization. In the manufacturing industry, companies use FineReport to integrate procurement, sales, and warehouse management. This leads to better inventory tracking, improved supplier relationships, and optimized inventory management.
You gain a competitive edge when you use inventory management dashboards for data-driven decision-making. You respond faster to market changes, reduce costs, and improve overall business performance.
Inventory Dashboard Features and Types
Essential Features of Inventory Management Dashboard
When you use an inventory dashboard, you gain access to a wide range of features that make inventory management easier and more effective. The most important features help you track stock, monitor inventory movement, and analyze trends. You see product categorization, product history, and collaborative inventory functions. Automated stock out reports and vendor managed inventory tools keep your business running smoothly. You can manage e-commerce orders, perform stock inquiries, and customize reports to fit your needs.
- Product categorization and history
- Collaborative inventory and automated stock out reports
- Vendor managed inventory and e-commerce integration
- Stock inquiries and report customization
- KPI and metric assistance for better decision-making
- Shipment by ID and multi-carrier shipping
- API integration and labeling for efficient tracking
You benefit from an easy-to-use interface that does not require advanced training. Automation eliminates manual processes, reducing errors and labor costs. A secure database provides accurate, real-time data for fast, actionable inventory monitoring. You can scale the system by adding modules with minimal configuration. Software integrations and automated features minimize manual inventory updates.
Automation dramatically reduces the time and effort required for asset tracking and audits. You log into a dashboard, access real-time data, and generate reports instantly. This reduction in manual work frees up time for more strategic initiatives, boosting overall productivity.
Types of Inventory Dashboards
You can choose from several types of inventory dashboards to match your business needs. Some dashboards focus on inventory control, while others specialize in inventory management or inventory tracking. You may use dashboards for inventory barcoding, optimization, or alerts. Each dashboard type helps you monitor stock levels, track movement, and optimize inventory analytics.
| Dashboard Type | Main Function | Use Case |
|---|---|---|
| Inventory Control | Manage stock levels | Warehouse operations |
| Inventory Management | Oversee inventory processes | Retail and manufacturing |
| Inventory Tracking | Track inventory movement | Logistics and supply chain |
| Inventory Barcoding | Barcode-based tracking | Asset management |
| Inventory Optimization | Analyze and optimize stock | Demand forecasting |
| Inventory Alerts | Automated notifications | Prevent stockouts and overstock |
FineReport Capabilities for Inventory Management
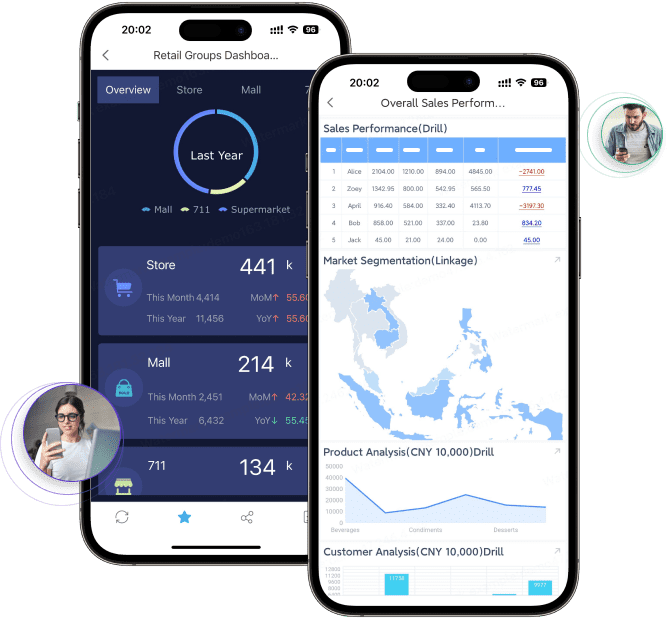
FineReport gives you advanced tools for inventory analytics dashboard creation. You can design dashboards with drag-and-drop simplicity and integrate data from multiple sources. FineReport supports mobile dashboards, so you access inventory analytics dashboard insights on any device. You use 3D visualization to explore inventory analytics dashboard data in new ways. The platform offers real-time inventory analytics dashboard updates, automated reporting, and seamless integration with your existing systems.
Mobile data visualization reports serve as a compass for real-time business analysis and daily business processing. You stay informed and make decisions wherever you are.
FineReport helps you track stock, monitor inventory analytics dashboard trends, and optimize inventory management dashboard processes. You gain control over inventory tracking and improve business performance with powerful inventory analytics dashboard features.
Driving Business Value with Inventory Dashboard

Improving Operations and Reducing Costs
You can transform your business operations by using a real-time inventory dashboard. This tool automates many inventory management tasks, streamlining workflows and reducing turnaround times by up to 40%. You gain instant visibility into stock levels, shipment status, and supply chain activities. Automated alerts notify you about delays or shortages, minimizing downtime and boosting efficiency by 25%. When you maximize visibility, you reduce errors and operational costs. Optimized routing and real-time shipment tracking can lower transportation costs by as much as 25%. Immediate access to supply chain data shortens lead times by 30%, ensuring timely deliveries and minimizing costs from delays. These improvements help you maintain effective inventory control and support better resource allocation.
- Real-time dashboards automate processes and reduce manual errors.
- You adjust inventory levels proactively, avoiding overstock and stockouts.
- Actionable insights from inventory analytics enable smarter decisions.
Enhancing Data Visibility and Control
An inventory management dashboard gives you a unified view of your entire inventory process. You see historical order behavior, multi-channel SKU movement, and seasonal patterns. This level of visibility strengthens demand forecasting and reduces friction in your operations. High-quality data inputs improve forecasting accuracy, helping you maintain effective inventory control. Accurate inventory data reduces picking and packing errors, leading to higher order fulfillment rates and increased customer satisfaction. You allocate resources more efficiently, spending less time searching for items and more time on value-added tasks. Companies that use integrated data for demand planning often lower inventory levels and operational costs.
| Benefit | Description |
|---|---|
| Improved order fulfillment | Accurate inventory data reduces errors and enhances fulfillment rates. |
| Effective forecasting | Precise data allows for better demand forecasting, minimizing overstocking and stockouts. |
| Efficient use of resources | Real-time visibility enables better allocation of staff and assets. |
| Increased customer satisfaction | Accurate orders and reduced lead times improve the customer experience. |
| Cost savings | Fewer errors and better resource allocation lead to significant cost reductions. |
Supporting Strategic Planning with FineReport
You can support strategic planning by leveraging the advanced features of FineReport’s inventory management dashboard. Centralizing data ensures collaboration across departments, making communication easier and decisions more accurate. Classifying inventory by profit impact helps you monitor and prioritize stock. Real-time dashboards provide current inventory levels, supporting accurate forecasting and timely decision-making. FineReport’s solution enables you to maximize visibility and maintain control over your inventory. The BOE customer story highlights these benefits: after implementing FineReport, BOE reduced inventory costs by 5% and increased operational efficiency by 50%. You can scale the dashboard as your business grows, adapting to new requirements without major redevelopment.
Tip: Use FineReport’s inventory analytics dashboard to centralize data and automate reporting. This approach improves forecasting, supports strategic planning, and drives business growth.
Implementing an Inventory Dashboard
Steps for Successful Implementation
To implement an inventory dashboard effectively, you should follow a structured approach. Start by validating your data. Clean and standardize your inventory records to ensure reliable information. Next, pilot the dashboard in one location or product line. This allows you to gather feedback and refine your processes before a full rollout. Deliver role-specific training sessions so each team member understands how to use the dashboard for their responsibilities. Monitor key metrics from day one to identify issues early and celebrate quick wins. Iterate quickly and expand gradually, adjusting your processes based on pilot results. Keep improvement cycles short by scheduling regular check-ins to capture feedback and make enhancements.
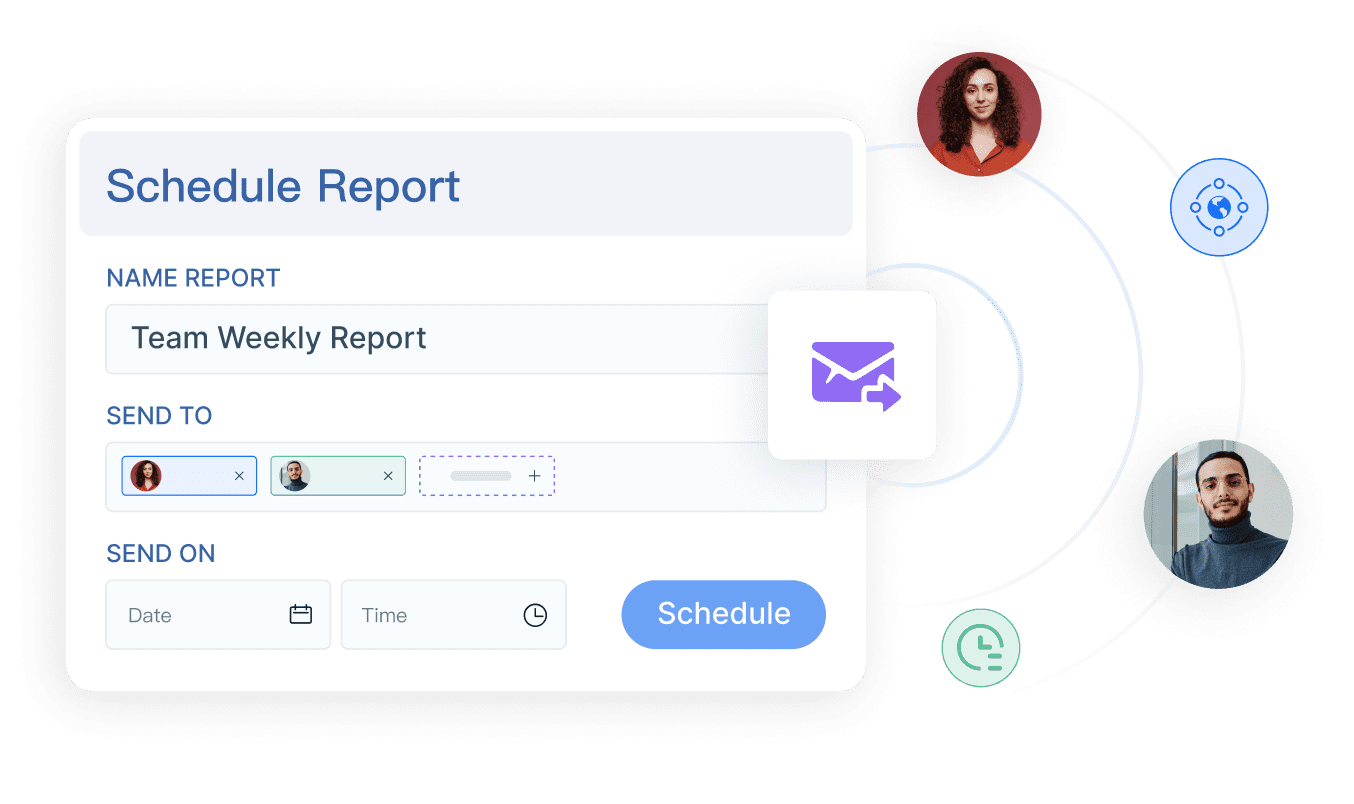
FineReport supports you throughout this process. You can automate inventory tracking, design custom dashboards with a drag-and-drop interface, and connect to multiple data sources for real-time updates. Scheduled reporting and collaboration features help your team stay informed and aligned.
Best Practices for Inventory Management
You can ensure ongoing success by following best practices. Set clear usage targets for user engagement and track metrics to measure progress. Communicate transparently about changes and highlight the benefits for users. Provide comprehensive, role-specific training and ongoing support. Design hands-on training modules with interactive exercises. Offer detailed documentation and video tutorials to reinforce learning. According to recent studies, ongoing training increases employee retention and adoption of new systems.
FineReport's training and support services make it easier for your team to adapt. You receive tailored guidance and resources to maximize the value of your inventory management system.
Common Pitfalls to Avoid
When deploying an inventory control system, avoid common mistakes. Failing to maintain precise records can lead to operational inefficiencies and asset loss. Overlooking software updates exposes your business to security threats. Starting with too much complexity can overwhelm users. Using dashboard gadgets that lack context may confuse viewers. Prioritize usability over variety to ensure effective data visualization.
| Pitfall | Description |
|---|---|
| Failing to maintain precise records | Leads to chaos, inefficiencies, and asset loss |
| Overlooking software updates | Increases risk of security threats and compatibility issues |
By following these steps and best practices, you can achieve improved forecasting, better inventory control, and a more efficient inventory management software experience.

You gain a powerful advantage when you use an inventory dashboard to manage your inventory. Real-time insights help you make smarter decisions and improve business performance. FineReport offers a flexible solution for optimizing inventory management and driving operational excellence. To get started, follow these steps: gather your inventory data, customize the system, install and configure the software, migrate and verify data, train your team, test the system, go live, and monitor for improvements.

Continue Reading About Inventory Dashboard
Best Dashboard Apps for Business Insights
What is a Call Center Dashboard and Why Does It Matter
What is a Reporting Dashboard and How Does it Work
What is An Interactive Dashboard and How Does It Work
What is a Call Center Metrics Dashboard and How Does It Work


FAQ

The Author
Lewis
Senior Data Analyst at FanRuan
Related Articles

How to Build an Investment Portfolio Reporting Dashboard for Executives: KPIs, Benchmarks, and Drill-Down Views
Investment portfolio reporting for executives is not about showing every holding, transaction, and chart your investment team can produce. It is about giving CEOs, CFOs, CIOs, boards, and investment committees a fast, re
Yida YIn
Jun 25, 2026

12 KPI Reporting Examples for Executive Dashboards: What to Show in Weekly, Monthly, and Quarterly Reviews
Executive leaders do not need more data. They need decision ready $1 examples that match how often they review the business and what actions they are expected to take. A weekly $1 should surface fast moving risks and per
Yida YIn
Jun 25, 2026

How to Build a Digital Marketing Reports Dashboard: Executive Examples, KPIs, and Templates
A $1 is the control layer that helps executives and marketing leaders turn scattered channel data into fast, confident decisions. If you are a CEO, CMO, operations director, or marketing analytics lead, the real problem
Yida Yin
May 07, 2026