What is a competitor dashboard? A competitor dashboard is a visual tool that helps you track, compare, and analyze your competitors’ performance across key metrics. You use a competitor dashboard to collect data from various sources and turn it into clear, actionable insights. This dashboard allows you to monitor shifts in the market and identify new opportunities.
You rely on a competitor dashboard to guide your strategic decisions. With a competitor dashboard, you see how your company stands against other competitive players. You gain competitor insights that drive your business forward. An effective competitor dashboard gives you a real-time view of the competitive landscape.
Many companies now use self-service BI tools like FineBI to build a dashboard without waiting for IT support. FineBI empowers you to create an effective competitor dashboard, access competitor insights, and respond quickly to competitive changes. A well-designed dashboard transforms raw data into market insights and supports your competitive strategy every day.
Set Goals and Identify Competitors For Competitor Dashboard
Define Business Objectives
You need to set clear goals before you start building your competitor dashboard. A strong competitive analysis begins with understanding what you want to achieve. Many organizations use competitor dashboards to spot trends early and benchmark their performance against industry standards. You can refine your strategy by using market data to adjust your marketing, pricing, or product focus. Automating data collection saves you time and reduces manual effort.
When you define your objectives, you avoid common pitfalls. Some teams struggle with information overload and overcrowded dashboards. Others face confusion from poor data visualization choices or inconsistent updates. You should focus on the most important metrics for your competitive landscape. Make sure your competitor dashboard provides enough context for each metric. This approach helps you avoid misunderstandings and ensures your competitive analysis delivers actionable insights.
Tip: Get buy-in from all stakeholders before finalizing your objectives. This step ensures your competitor dashboard meets the needs of everyone involved in your competitive analysis.
Select Key Competitors
Choosing the right competitors is essential for effective competitor research. Start by identifying companies that directly impact your market position. Look for those with similar products, services, or target customers. Consider both established players and emerging challengers in your industry. You should also pay attention to competitors who show rapid growth or innovation.
When selecting competitors, use criteria such as market share, product offerings, and geographic reach. Evaluate how these competitors respond to trends like AI adoption, supply chain risks, or regulatory changes. Watch for signs of information overload or decision paralysis in your own process. Gathering competitors' data from reliable sources ensures your competitor dashboard reflects the true competitive environment.
You should also address challenges like siloed intelligence and slow market response. Manual processes can slow down your competitive analysis and lead to missed opportunities. By focusing on gathering competitors' data efficiently, you improve your ability to act quickly and maintain a competitive edge.
Note: Test your competitor dashboard with a small group before rolling it out to your entire team. This step helps you refine your approach and ensures your competitive analysis remains relevant.
Choose Metrics and Data Sources for Your Competitor Dashboard
Identify Essential Metrics
You need to select the right metrics to make your competitor dashboard effective. Start by thinking about what matters most in your industry. For example, if you work in ecommerce, you might track rank intelligence trends and compare paid versus organic performance. In digital agencies, you may focus on rank intelligence and search analytics. Each industry uses different widgets and metrics to gain insights.
Here is a table showing common metrics used in competitor dashboards across industries:
| Industry | Metrics/Widgets Used |
|---|---|
| Travel | Multi-Domain Analytics widget |
| Education | Search Analytics Trend Widget |
| Digital Agencies | Rank Intelligence Trend widget |
| Media and Publications | Search Analytics Trend widget, Clarity Audits Summary |
| Ecommerce | Rank Intelligence Trend widget, PPC vs. Organic widget |
| Real Estate | SERP Features Trend widget |
| Business Technology Solutions | Rank Intelligence: Geo Location widget |
You should also consider universal metrics that apply to most competitor dashboards. These include Net Promoter Score (NPS), Customer Satisfaction Score (CSC), churn rate, customer lifetime value, and share of voice. Tracking these metrics helps you understand both your position and your competitors’ strengths and weaknesses.
Tip: Focus on metrics that align with your business goals. Avoid adding too many metrics, as this can make your competitor dashboard confusing and less actionable.
Gather Reliable Data
You need reliable data sources to build a trustworthy competitor dashboard. Reliable data ensures your insights are accurate and your decisions are sound. Common data sources include web traffic analytics, user engagement metrics, and industry trend reports. You can also track campaign reach, earned media value, and total mentions to measure brand visibility.
Here is a table of useful data sources and the insights they provide:
| Insight Type | Description |
|---|---|
| Web Traffic Sources | Shows where traffic is coming from |
| User Engagement Metrics | Reveals how users interact with competitor sites |
| Industry Trends | Highlights market shifts affecting competitors |
Many organizations use tools like Meltwater, Supermetrics, Sprout Social, and Agency Analytics to collect and analyze competitor data. These tools offer features such as traffic monitoring, keyword research, customer support benchmarking, and influencer audience comparison.
To ensure your data is reliable, you should validate it before using it in your competitor dashboard. Use checks for data type, code, range, format, consistency, and uniqueness. Regularly verify the credibility of external data sources to avoid making decisions based on inaccurate information.
Note: Reliable data forms the foundation of a successful competitor dashboard. Always check your sources and update your data regularly to maintain accuracy.
Build Your Competitor Dashboard with FineBI
A competitor dashboard gives you a clear view of your competitive landscape. You use it to track competitors, compare their performance, and spot trends that matter. Building a competitor dashboard helps you turn raw data into actionable insights. You can see how your company measures up and respond quickly to changes in the market. A well-designed competitor dashboard supports your strategy and keeps you ahead of competitors.
Integrate and Prepare Data
You start your competitor dashboard by bringing together data from all relevant sources. This step is critical for accurate competitor analysis. You need to connect to systems that hold information about your competitors, such as sales platforms, marketing tools, and industry databases. The more sources you connect, the more complete your competitor insights dashboard becomes.
Here is a table showing the types of data sources you might use for your competitor dashboard:
| Data Source Type | Examples |
|---|---|
| Enterprise Systems | SAP, Oracle E-Business Suite |
| Industry Focus | Manufacturing, Finance, Retail |
| Number of Connectors | Over 100 |
You should always choose data sources that give you the most reliable and up-to-date information about your competitors. This approach ensures your competitor dashboard reflects the real competitive environment.
Once you connect your data, you need to prepare it for analysis. Clean data leads to better insights and more effective competitor dashboards. Follow these best practices for preparing and cleaning your data before you build your competitor analysis dashboard:
- Analyze your datasets to find patterns and quality issues. Document what you find to guide your cleaning rules.
- Create automated cleaning procedures based on your analysis. Start with simple rules and add more as needed.
- Test your cleaning rules on a small sample before using them on all your data.
- Monitor your cleaning process. Set alerts for any big changes in data quality.
You improve your competitor dashboard by making sure your data is accurate and consistent. This step helps you avoid mistakes in your analysis and ensures your competitor insights dashboard delivers real value.

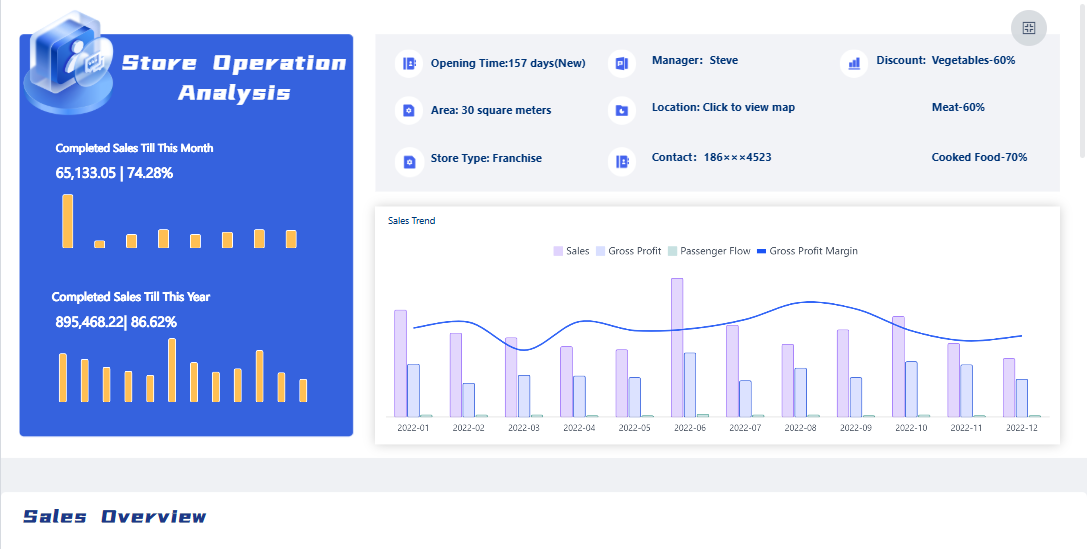
Design and Visualize Insights
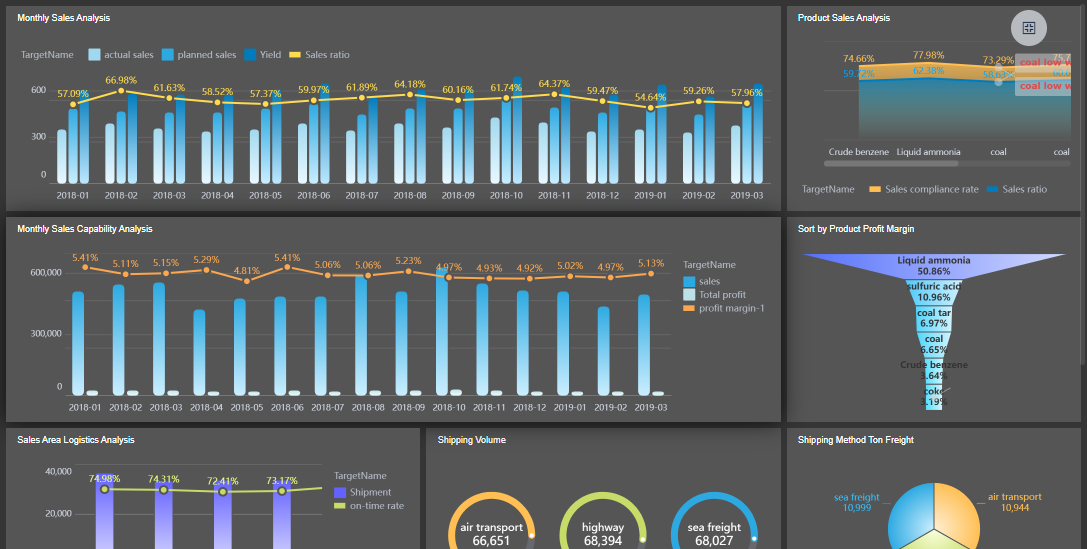
After you prepare your data, you move to the design stage of your competitor dashboard. This is where you turn numbers into visual stories. You use charts, graphs, and tables to make your competitor insights dashboard easy to understand. Good data visualization helps you and your team see trends, compare competitors, and make decisions faster.
Research shows that visual presentations convince more people than words alone. You should use the most effective visualization types for your competitor dashboard. Here are some popular options:
| Visualization Type | Description |
|---|---|
| Bar Charts | Ideal for comparing quantities across categories. |
| Bullet Graphs | Compact bar charts for performance comparison against a target. |
| Heat Maps | Use color gradients to emphasize data points and reveal patterns. |
| Sankey Diagrams | Show flows and relationships with line thickness representing data magnitude. |
You can also use pie charts to show proportions and heat maps to spot quick trends. Choose the right visualization for each metric to make your competitor dashboard clear and actionable.
Now, you can use FineBI to build your competitor analysis dashboard. FineBI supports over 100 connectors, so you can bring in data from many sources. You do not need technical skills to use FineBI. The drag-and-drop dashboard builder lets you create your competitor insights dashboard quickly. You can add charts, tables, and filters with just a few clicks.
Here is a comparison of FineBI with other BI tools:
| Feature | FineBI | Other BI Tools |
|---|---|---|
| Ease of Use | User-friendly, minimal training required | Often requires technical expertise |
| Visualization Options | Strong capabilities | May offer advanced analytics features |
| Accessibility | Designed for non-technical users | May not prioritize accessibility |
FineBI makes it easy for you to design a competitor dashboard that everyone in your team can use. You can set up real-time insights, so your competitor insights dashboard always shows the latest data. This feature helps you react quickly to changes in the competitive landscape.
FineBI also supports collaboration and governance. You can share your competitor dashboard with your team and control who sees what data. This keeps your competitor analysis secure and organized. You can set up alerts for important changes, so you never miss a shift in your competitive environment.
A strong competitor dashboard built with FineBI gives you the power to track competitors, analyze trends, and act on insights. You can make better decisions and stay ahead in your market. Your competitor insights dashboard becomes a central tool for your competitive strategy.
Tip: Review your competitor dashboard regularly. Update your data sources and visualizations to keep your competitor analysis dashboard relevant and effective.
Optimize Your Competitor Dashboard
Automate Updates and Alerts
You need to keep your competitor dashboard current to gain timely competitive insights. Automation helps you track competitors efficiently and ensures your dashboard always reflects the latest data. You can use AI agents to automate competitor tracking and data updates. This approach reduces manual work and speeds up your analysis. Set up validation protocols to check data quality. These protocols evaluate source reliability, schema compliance, and signal uniqueness.
You should optimize alert rules to capture subtle shifts in your competitive environment. Route notifications through your preferred communication channels. Automated alerts notify you of critical changes or trends in real time. This feature helps you act quickly and capitalize on opportunities before your competitors do. Automation transforms your data into actionable insights and empowers you to make informed decisions faster.
Tip: Review your alert settings regularly. Adjust them to match your evolving competitive landscape and ensure you receive only the most relevant notifications.
Review and Refine for Action
Regular monitoring and updating of your competitor dashboard ensures you always have access to key dashboard insights. Set a consistent schedule for reviewing your dashboard. Make this review a team ritual, especially before strategy meetings. This habit keeps your competitive analysis sharp and your insights actionable.
| Recommendation | Details |
|---|---|
| Set a consistent schedule | Dedicate time each month to update and review your dashboard. |
| Create a ritual | Make this review a part of your team's routine, ideally before strategy meetings. |
You should monitor metrics such as engagement, sentiment analysis, website traffic, user engagement, and social media activity. These metrics help you assess the ongoing effectiveness of your competitor dashboard and identify areas for improvement.
FineBI offers advanced features that enhance your competitor dashboard. You can use AI-driven insights to spot patterns and predict trends. Real-time data updates ensure you always see the latest numbers. Self-service analytics let you create and explore your own datasets. Collaboration tools make it easy to share insights and comment on reports. Robust data governance keeps your competitive analysis secure and compliant.
| Feature | Description |
|---|---|
| AI-driven insights | Provides advanced analytics to identify patterns and predict future trends. |
| Real-time data updates | Ensures that users always see the latest numbers, enhancing decision-making with current data. |
| Self-service analytics | Allows users to create their own datasets and explore data independently, improving usability. |
| Collaboration tools | Facilitates sharing insights and commenting on reports, enhancing teamwork and communication. |
| Robust data governance | Implements role-based access control and unifies metrics, ensuring data security and compliance. |
Real-world examples show the impact of a well-optimized competitor dashboard. For instance, a manufacturer increased sales by 71% in two months by sharing best practices through their dashboard. An e-commerce company reduced refunds by 25% and saved over $10,000 in the first month. These results highlight how regular monitoring and updating of your competitor dashboard can drive real business outcomes.
Note: Use your competitor dashboard as a living tool. Update it often, refine your analysis, and share key dashboard insights with your team to stay ahead in your competitive market.
Turn Insights From Competitor Dashboard into a Competitive Analysis Report
Interpret Dashboard Findings
You need to turn the data from your competitor dashboard into a competitive analysis report that drives action. Start by reviewing the visualizations and summaries in your dashboard. Focus on the top three to five most important findings. For each insight, write a short description, explain why it matters, and suggest what your team should do next. This approach helps you prioritize what matters most in your competitive analysis.
Use clear visuals in your competitive analysis report. Add summary slides, comparison charts, and timelines to make your findings easy to understand. Good design and accessibility features help everyone on your team see the value of your competitor dashboard. Prepare to answer questions about your data sources, the confidence in your insights, and any gaps in your analysis. This preparation builds trust in your competitive analysis report.
Tip: Always connect your findings to key decisions. Show how each insight from your competitor dashboard links to strategic questions, such as changes to your product roadmap or sales approach.
Drive Strategic Actions
You use your competitive analysis report to guide your next steps. Start with clean, high-quality data in your competitor dashboard. Make sure your dashboard gives everyone in your company a clear view of competitors. Use analytics tools that include machine learning to find patterns and predict trends. Train your team on how to use the competitor dashboard and explain the value of the insights.
When you present your competitive analysis report, focus on recommendations. Decide which strategies to stop or change based on competitor performance. Highlight successful actions to amplify. Address priorities that need immediate attention because of competitor moves. Your competitive analysis report should include both long-term changes and quick actions. Sometimes, you may confirm that your current strategy works and no change is needed.
Organizations that use a well-designed competitor dashboard see real results. You can improve alignment, speed up decision-making, and achieve more predictable outcomes. For example, automated dashboards have helped companies save thousands of hours and make faster, more confident decisions.
Note: Share your competitive analysis report with all key stakeholders before meetings. This step ensures everyone is prepared and ready to discuss the next steps.
You have learned how to build a competitor dashboard by following key steps: create profiles for competitors, analyze market positioning, compare products, track pricing, assess customer sentiment, perform SWOT analysis, set benchmarks, and review win/loss outcomes. FineBI helps you design interactive dashboards with real-time insights, supporting agile competitive analysis. Start by reviewing your current methods or try FineBI to enhance your dashboard. Use data-driven insights to respond quickly to competitors and secure your competitive advantage.

Continue Reading About Competitor Dashboard
Best Dashboard Apps for Business Insights
What is a Call Center Dashboard and Why Does It Matter
What is a Reporting Dashboard and How Does it Work
What is An Interactive Dashboard and How Does It Work
What is a Call Center Metrics Dashboard and How Does It Work


FAQ

The Author
Lewis
Senior Data Analyst at FanRuan
Related Articles

How to Build an Investment Portfolio Reporting Dashboard for Executives: KPIs, Benchmarks, and Drill-Down Views
Investment portfolio reporting for executives is not about showing every holding, transaction, and chart your investment team can produce. It is about giving CEOs, CFOs, CIOs, boards, and investment committees a fast, re
Yida YIn
Jun 25, 2026

12 KPI Reporting Examples for Executive Dashboards: What to Show in Weekly, Monthly, and Quarterly Reviews
Executive leaders do not need more data. They need decision ready $1 examples that match how often they review the business and what actions they are expected to take. A weekly $1 should surface fast moving risks and per
Yida YIn
Jun 25, 2026

How to Build a Digital Marketing Reports Dashboard: Executive Examples, KPIs, and Templates
A $1 is the control layer that helps executives and marketing leaders turn scattered channel data into fast, confident decisions. If you are a CEO, CMO, operations director, or marketing analytics lead, the real problem
Yida Yin
May 07, 2026