Self service analytics lets you explore and analyze data on your own, without waiting for IT experts. You gain the power to create reports, spot trends, and answer business questions directly. This approach matters because it puts you in control of insights that drive business intelligence.
Many organizations now choose self service analytics platforms. The table below shows how quickly adoption is rising:
| Year | Number of Organizations Adopting Self-Service Analytics |
|---|---|
| 2025 | Over 1,200 enterprises deployed self-service analytics solutions |
| 2025 | Over 900 companies adopted self-service analytics solutions |
You see a major shift from IT-centric reporting to user-driven analytics. Today, AI tools automate dashboards and routine reports, so you can focus on interpreting results and making decisions. FineBI stands out as a leading self-service analytics solution, helping you move from experience-based choices to data-driven strategies. With self service analytics, you can respond faster, boost efficiency, and shape a customer-focused culture.
You encounter self service analytics as a modern approach in business intelligence. This method gives you direct access to data, letting you analyze information without waiting for IT support. You use intuitive tools to create dashboards, generate reports, and visualize trends. The goal is to help you make decisions based on facts, not assumptions.
Here is how leading industry sources define self service analytics:
| Source | Definition |
|---|---|
| TechTarget | Self-service analytics requires a front-end BI application with a user-friendly interface that enables users to easily view and manipulate the data. It allows users to work directly with data from multiple sources and create dashboards and reports without needing IT support. |
| Denodo | Self-service analytics enables non-technical users to independently access, analyze, and visualize data without requiring support from IT or data specialists. It provides intuitive tools for generating insights and making data-driven decisions. |
| AtScale | Self-service analytics are BI tools that empower users to access, analyze, and visualize data independently, allowing them to generate reports and uncover insights without relying on IT. |
You see four key concepts in self service analytics platforms:
Self service analytics platforms focus on these components to help you explore data confidently and independently.
You may wonder how self service analytics differs from traditional analytics. The main difference is who controls the process. In traditional analytics, IT professionals and data analysts handle most tasks. You must submit requests and wait for reports. This process can slow down your decision-making.
The table below highlights the differences:
| Feature | Traditional Analytics | Self-Service Analytics |
|---|---|---|
| User Type | Designed for IT professionals and data analysts. | Accessible to non-technical users, like business teams. |
| Speed | Time-consuming due to reliance on IT for reports. | Faster, as users can create reports independently. |
| Complexity | Requires advanced technical knowledge. | User-friendly with intuitive interfaces. |
| Customization | Limited customization options. | High customization; users can tailor dashboards easily. |
You gain autonomy with self service analytics. You access and analyze data directly, which speeds up your workflow and reduces your reliance on IT. You create customized visualizations that fit your needs, making your data more engaging and useful.
Tip: Self service analytics lets you generate reports and dashboards on-demand. You avoid delays and get answers when you need them.
Self service analytics also democratizes data access. You and your colleagues can explore information independently, increasing productivity and collaboration. You see real-time insights and respond quickly to changes in your business environment.
Self service analytics matters because it transforms how you and your organization use data. You experience several advantages:
| Benefit | Description |
|---|---|
| Increased Agility in Decision Making | Self service analytics enables teams to quickly ask questions and receive answers, allowing for immediate action and faster decision-making, which can lead to competitive advantages. |
| Reduced Dependence on IT | Business users can generate their own reports and analyses, reducing delays caused by IT bottlenecks and allowing data teams to focus on more strategic projects. |
| Enhanced Cross-team Collaboration | Access to shared data fosters collaboration across departments, aligning efforts and improving communication, which leads to better overall performance. |
| Establishment of a Data-first Culture | Making data accessible to all promotes evidence-based decision-making, reducing reliance on intuition and fostering a culture that prioritizes data-driven strategies, ultimately leading to improved outcomes. |
You measure the impact of self service analytics using several metrics:
| Metric Type | Description |
|---|---|
| Data Quality Metrics | Completeness, Accuracy, Consistency, Timeliness |
| User Adoption | Active users, Feature utilization, Self-service ratio |
| Decision Impact | Decision velocity, Decision confidence, Course corrections, Value attribution |
You notice that organizations with high adoption rates of self service analytics report better performance. You see faster decisions, higher confidence in outcomes, and more effective course corrections. You also observe improved data quality and greater user engagement.
Note: Self service analytics helps you build a data-first culture. You rely on facts, not guesses, and you make smarter choices for your business.
Self service analytics empowers you to take control of your data journey. You drive business intelligence forward, making your organization more agile, collaborative, and successful.
Self service analytics platforms help you unlock the full value of your data. You gain the ability to connect, prepare, analyze, and share information without relying on IT specialists. These platforms follow a structured workflow that guides you from raw data to actionable insights. You see how each stage supports your journey toward data-driven decision-making.
You start with data integration and preparation. This step brings together information from different sources and ensures it is ready for analysis. Most self service analytics platforms support a wide range of connectors, allowing you to access databases, cloud warehouses, and file-based data.
Here is a table showing common databases and connection options:
| Supported Databases | Data Extraction | Direct Connection |
|---|---|---|
| Amazon Redshift | √ | √ |
| Apache Impala | √ | √ |
| PostgreSQL | √ | √ |
| Microsoft SQL Server | √ | √ |
| MySQL | √ | √ |
| Oracle | √ | √ |
| SAP HANA | √ | √ |
| IBM DB2 | √ | √ |
| Hadoop Hive | √ | × |
| MongoDB | √ | × |

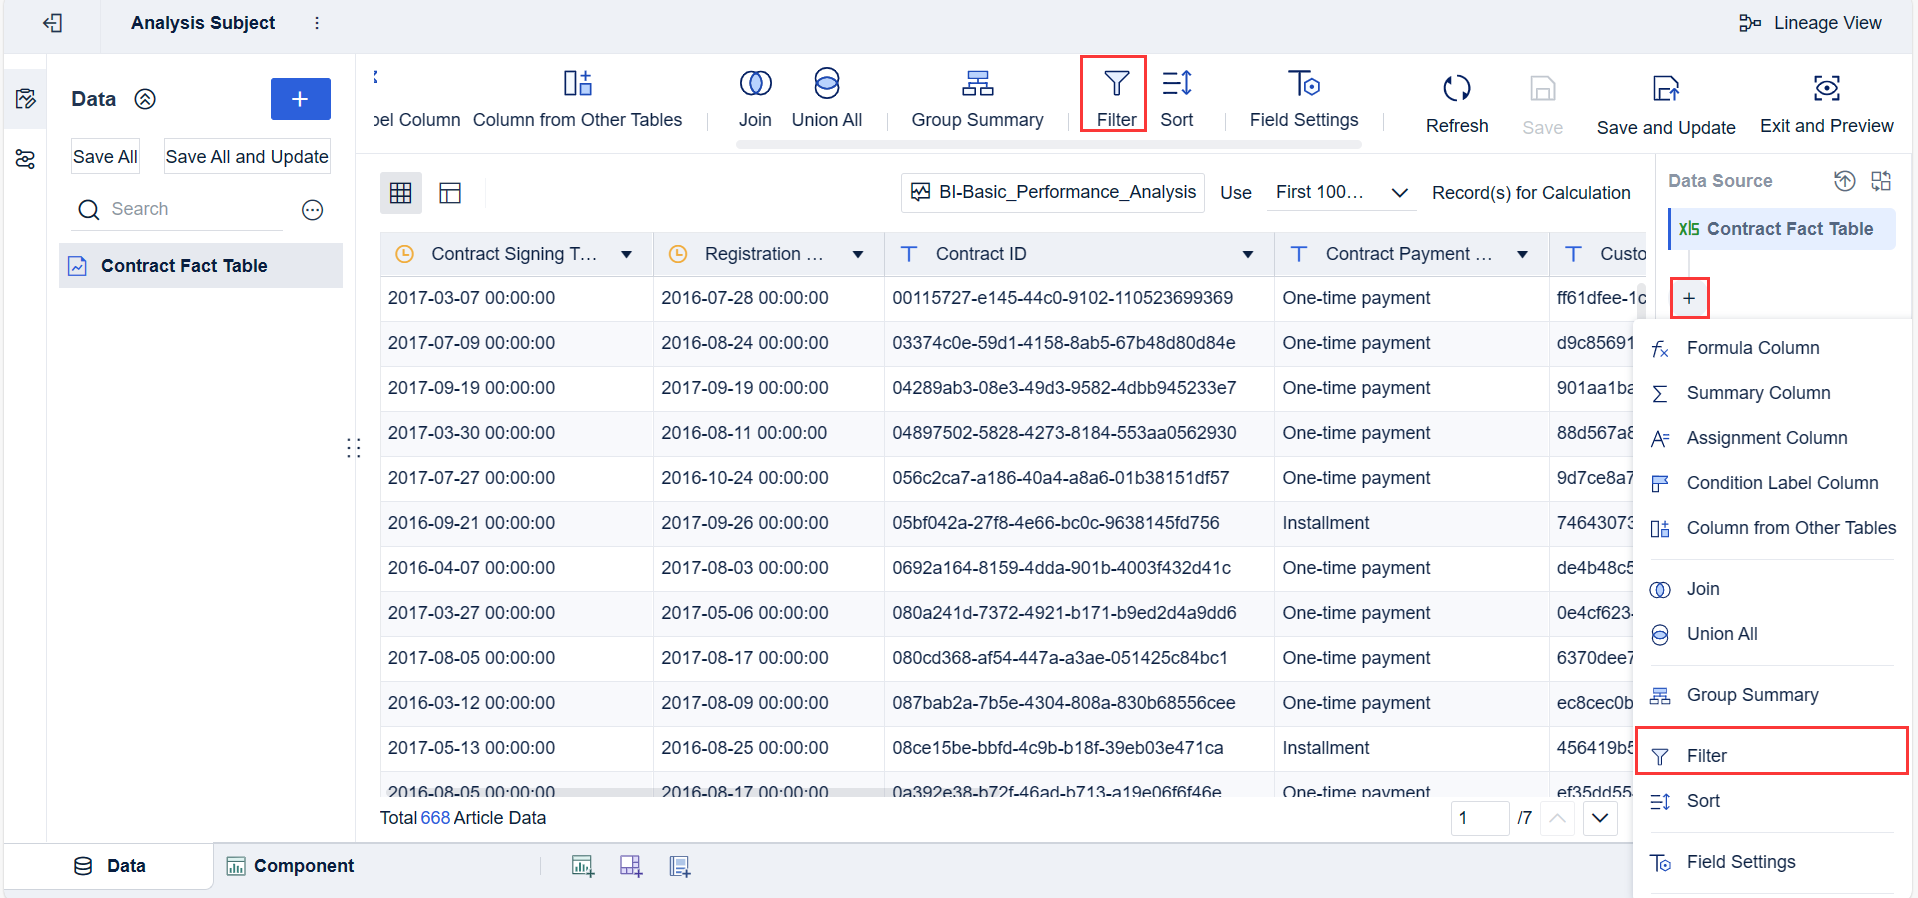
Once you connect your data, you need to prepare it for analysis. You use drag-and-drop tools to clean, merge, and reshape your data. You can create calculated fields and validate your dataset. The table below outlines typical steps in data integration and preparation:
| Step | Description |
|---|---|
| Data Cleansing | Correcting or removing inaccurate, corrupted, or incomplete data. |
| Normalization | Standardizing formats to ensure data consistency. |
| Combining data | Merging data from different sources to create a cohesive dataset. |
| De-duplication | Removing duplicate records to ensure uniqueness. |
| Reshaping data | Pivoting, aggregating, or splitting data to fit analysis needs. |
| Creating calculated fields | Adding new data fields derived from existing data. |
| Validation | Applying rules to ensure data meets quality standards. |
| Anomaly detection | Identifying outliers or unusual patterns in the data. |
| Drag-and-drop tools | Allowing users to perform complex operations without coding. |
| Visualizations | Providing visual interfaces to understand data transformations and relationships. |
| Adding context | Integrating external data to enrich the analysis. |
| Output formats | Exporting data in formats suitable for analytics tools or reporting software. |
| Collaboration | Sharing capabilities to collaborate with other team members. |
You see that self service analytics platforms make data preparation accessible. You do not need coding skills. You use visual interfaces to understand and transform your data. This process ensures your analysis starts with high-quality information.
FineBI, a leading self service analytics platform, supports over 60 connectors. You can link to relational databases, big data platforms, and cloud warehouses. You also upload files and connect to APIs. FineBI’s workflow guides you through data integration, processing, and preparation with intuitive tools.

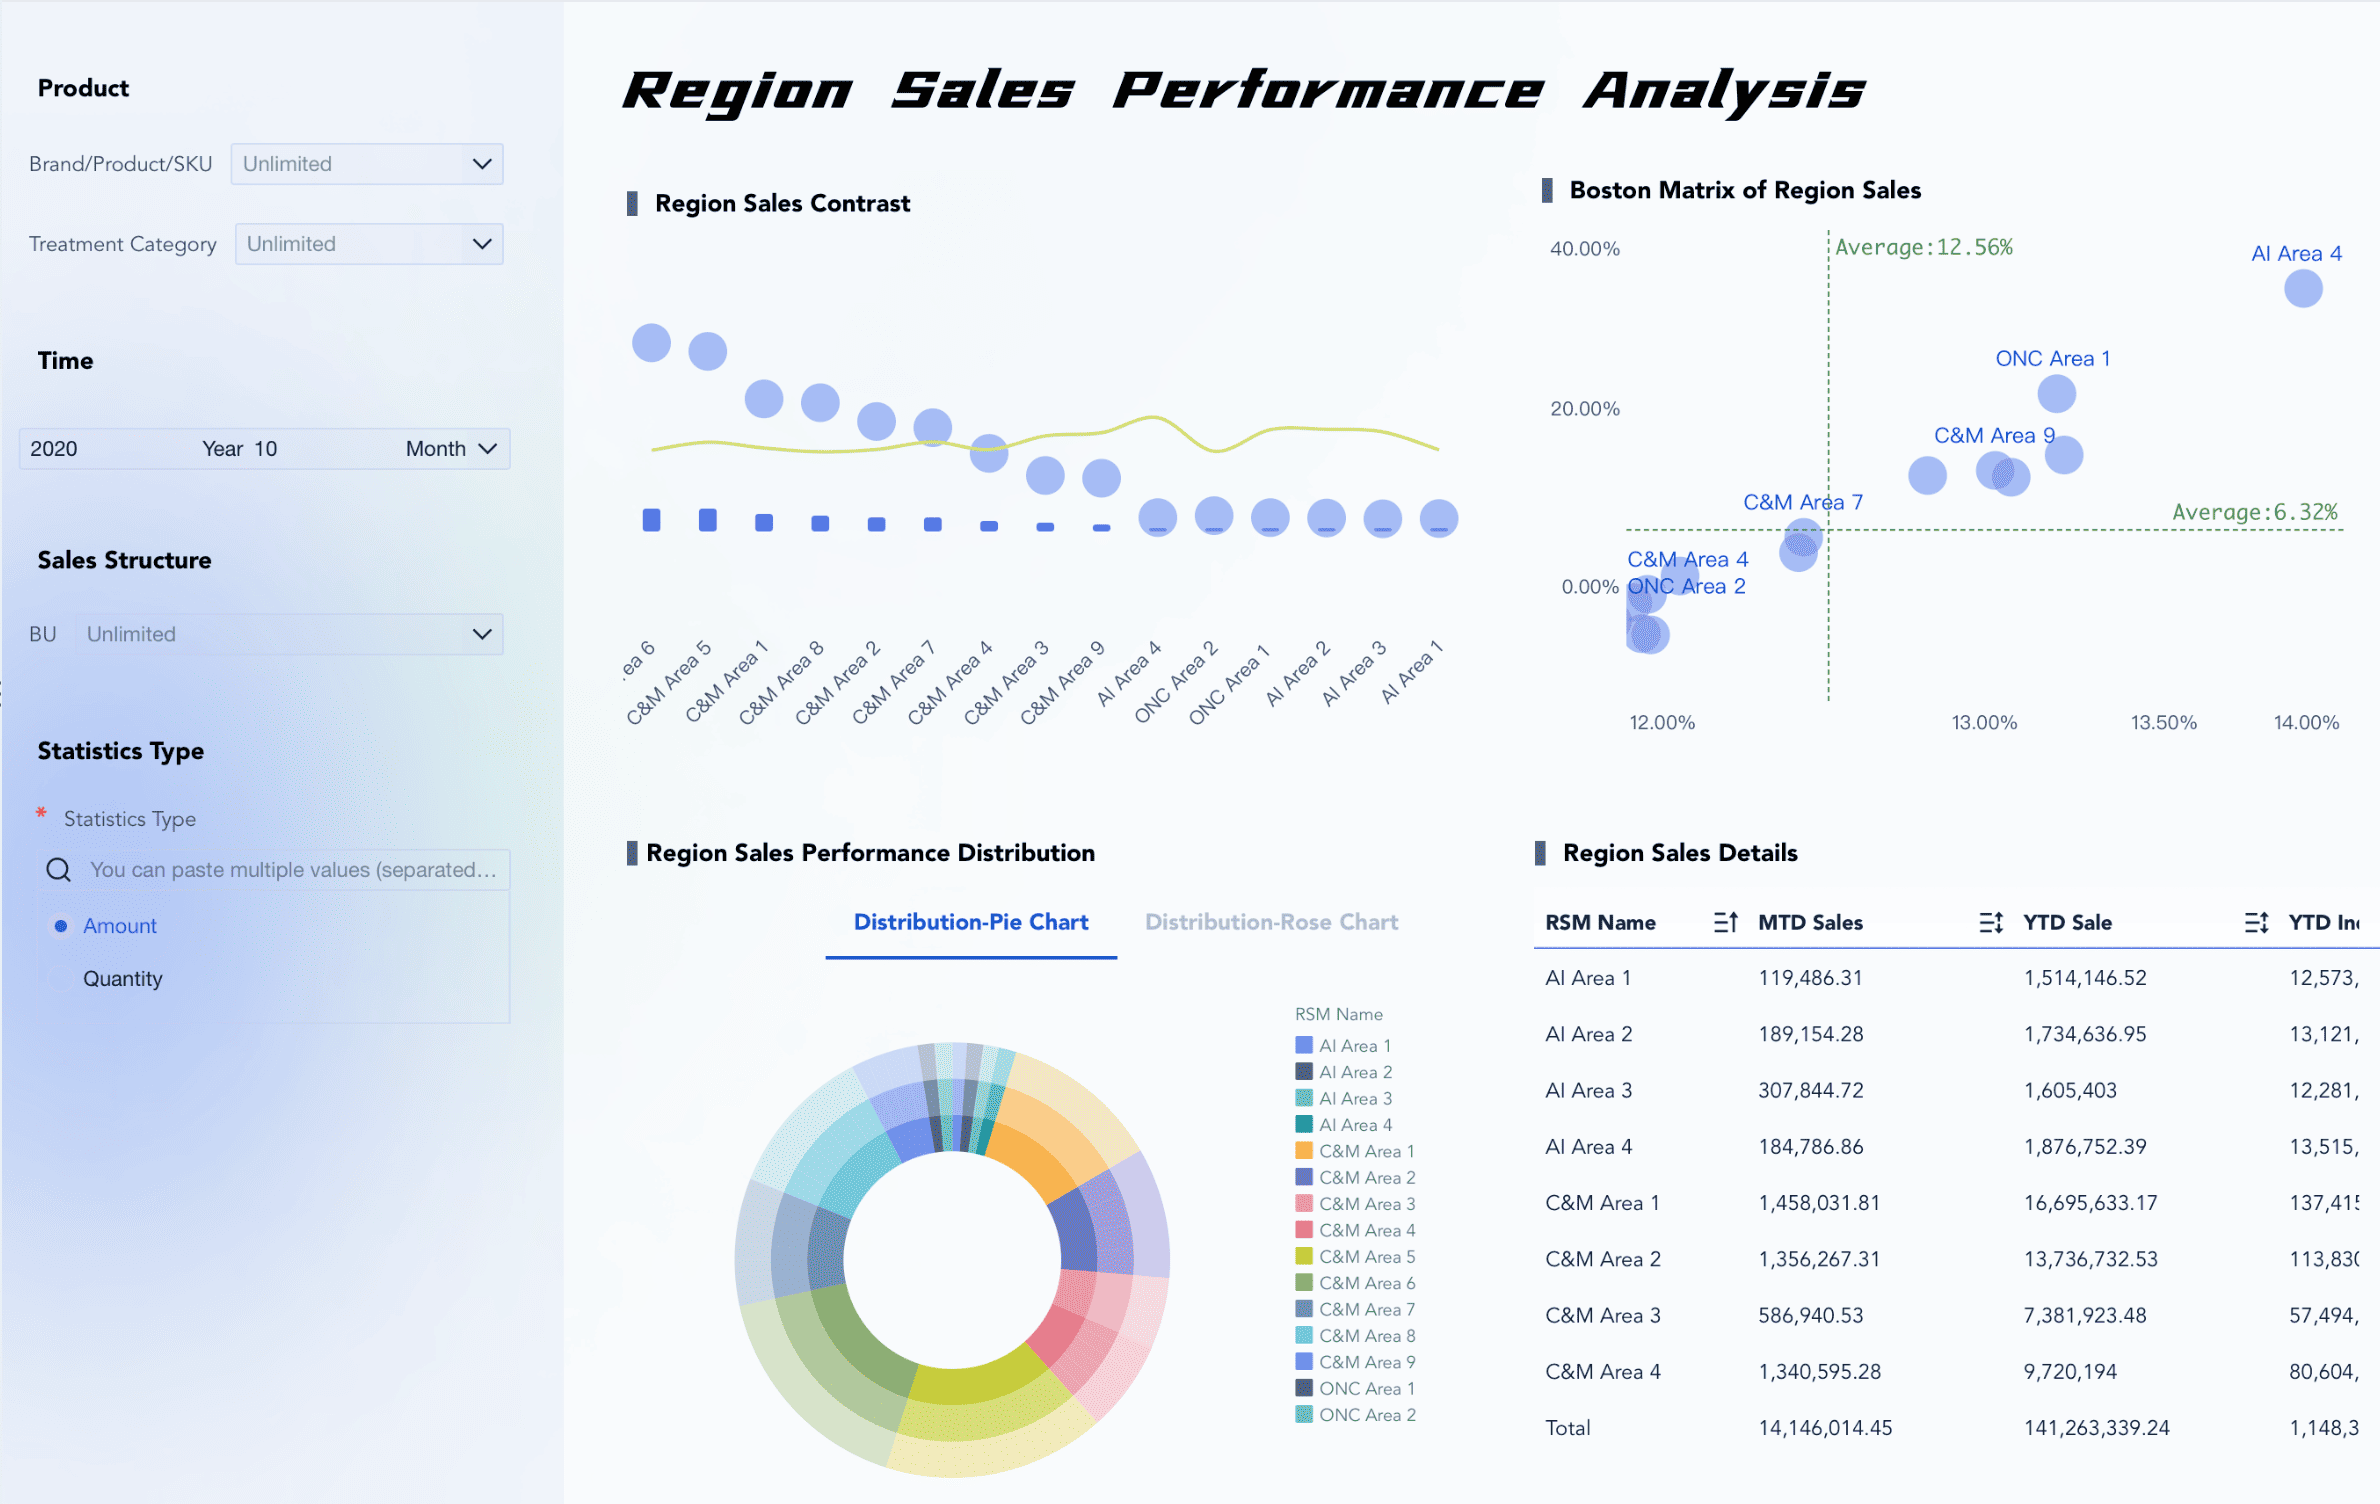
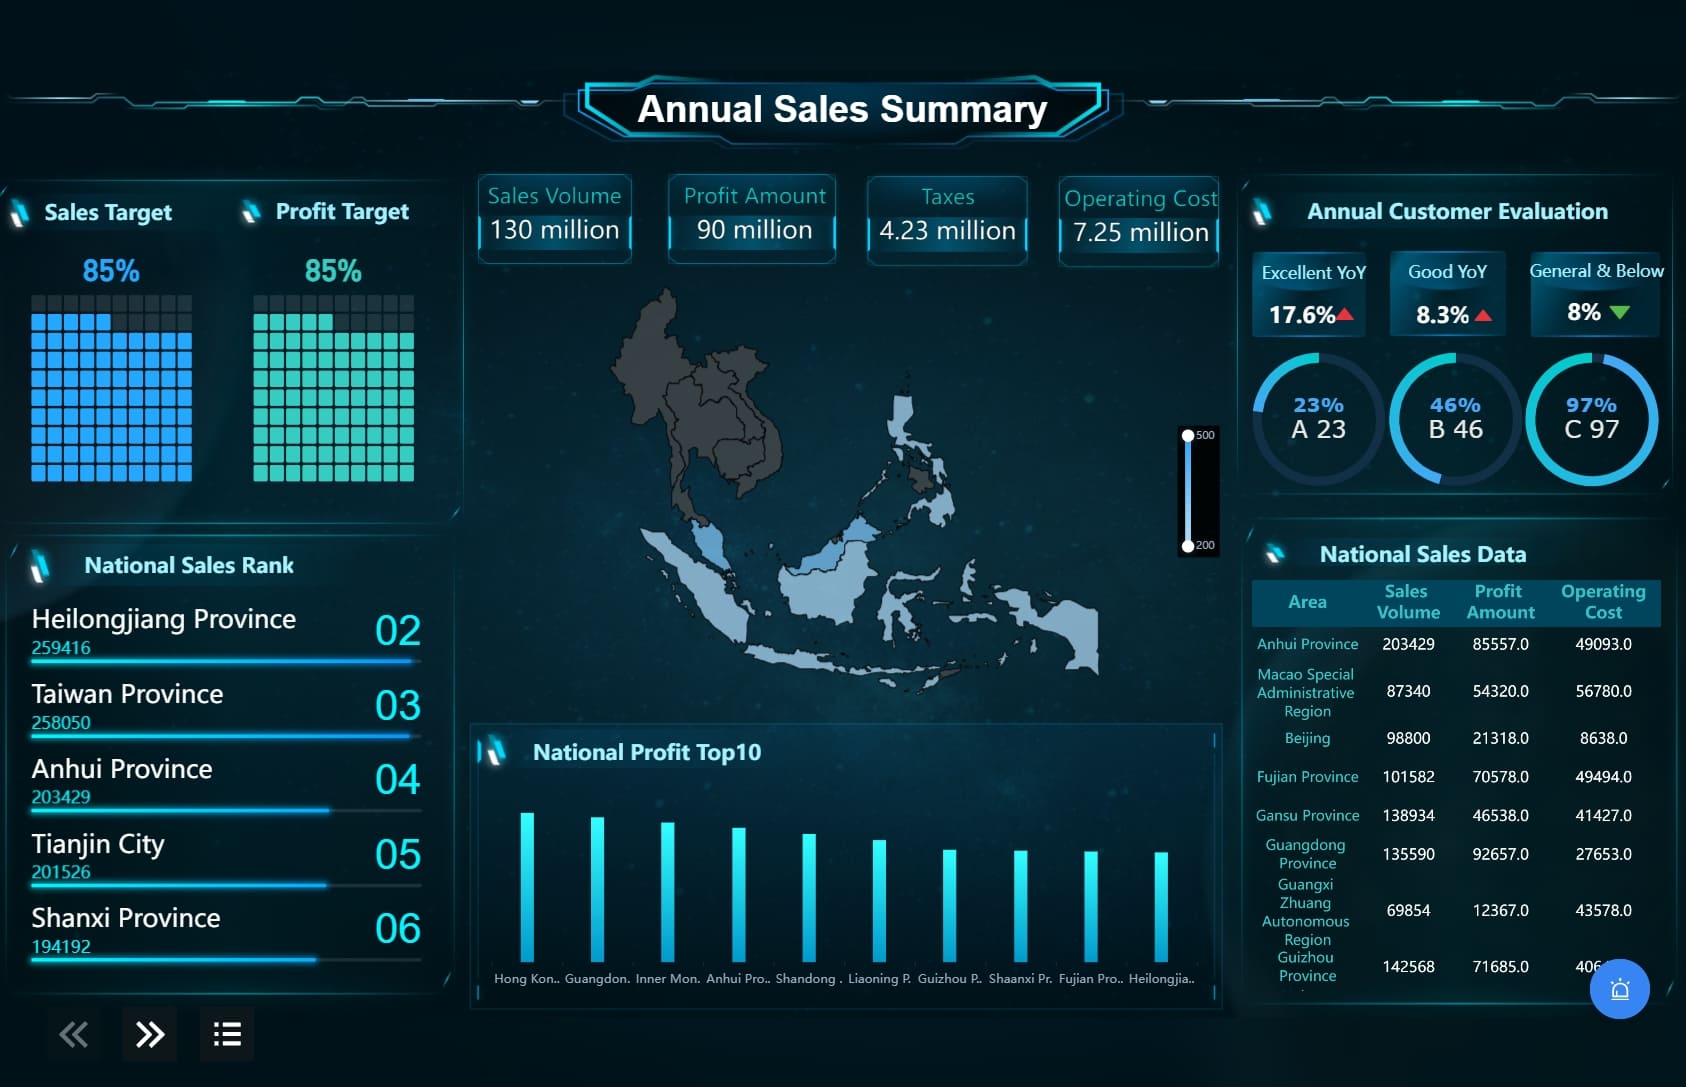
After preparing your data, you move to visual exploration and dashboard creation. Self service analytics platforms give you the power to build interactive dashboards without technical expertise. You use drag-and-drop features to create charts, tables, and maps.
You benefit from:
You interact with your data using filters, dropdowns, and drill-down options. You see trends, compare metrics, and uncover insights in real time. Popular visualization types include bar charts, line graphs, pie charts, and custom charts tailored to your data.
FineBI makes dashboard creation simple. You select components, arrange layouts, and apply styles. You can preview and publish dashboards for your team. FineBI supports responsive design, so you access dashboards on any device.
Tip: You can use real-time filters to explore different dimensions and time periods. This helps you answer business questions quickly.
FineBI also integrates with FineReport, allowing you to share data sources and report pages across platforms. This unified approach supports both structured reporting and dynamic analysis.
Collaboration and governance are essential in self service analytics platforms. You work with your team to share insights and validate findings. These platforms provide secure sharing options and role-based access controls.
Key steps for governance include:
| Key Steps for Governance in Self-Service Analytics | Description |
|---|---|
| Set up your environment rapidly | Create immediate value for users. |
| Centralize and standardize your data models | Ensure consistency and reliability of data. |
| Empower your people to be self-reliant | Build trust and enhance user independence. |
| Monitor and audit usage | Optimize performance and ensure compliance. |
You see robust security features that protect data integrity and confidentiality. Platforms like FineBI offer row-level security, audit logs, and compliance with regulations such as GDPR. You maintain user trust by ensuring accurate and reliable data usage.
Essential governance features include:
| Feature | Description |
|---|---|
| Data Integrity | Measures and policies that protect data integrity, ensuring accurate and reliable data usage. |
| Confidentiality | Safeguards that protect sensitive data from unauthorized access. |
| Compliance | Adherence to regulatory standards such as GDPR, SOC 2 Type II, and HIPAA to ensure legal safety. |
| User Trust | Effective security measures that maintain user confidence in the platform's data handling. |
You collaborate with colleagues using shared dashboards and datasets. You comment, annotate, and discuss findings within the platform. FineBI supports team collaboration, allowing multiple users to work on the same dashboard and share analysis approaches.
Macao Water, a leader in the Asian water industry, adopted FineBI to overcome scattered and siloed data. The company integrated data from multiple sources, streamlined analysis, and empowered teams to make data-driven decisions. This transformation improved operational efficiency and fostered a smarter, more connected organization.
Self service analytics platforms help you work faster and make clearer decisions. You reduce technical barriers and strengthen collaboration across departments. You maintain data quality and compliance while empowering your organization to achieve business intelligence goals.

You experience faster decision-making when you use self service analytics. You access data instantly, create reports quickly, and update dashboards without waiting for IT support. This direct access means you get timely insights and respond to business changes with agility. You avoid bottlenecks and reduce the backlog of requests.
Self service analytics empowers you to explore data sources directly. You retrieve critical information, such as user engagement statistics, almost instantly. This speed enriches your decision-making process and helps you stay ahead in a competitive environment.
| Aspect | Self-Service Analytics | Traditional Reporting |
|---|---|---|
| User Empowerment | Non-technical users can create reports independently | Reliance on IT teams for report generation |
| Speed of Report Generation | Faster due to direct access to data | Slower due to bottlenecks in IT assistance |
| Real-Time Insights | Provides immediate access to data | Often delayed due to processing time |
Self service analytics gives you the tools to analyze data without technical expertise. You use intuitive interfaces and drag-and-drop features to create meaningful visualizations. Automated data preparation reduces complexity, so you focus on insights rather than technical details.
You see increased productivity as more employees access and use data independently. Data democratization breaks down silos and fosters collaboration. You understand trends across teams and make informed decisions.
| Source | Evidence |
|---|---|
| Gartner | 49% of executives see self-service data and analytics as a driver of employee productivity, enhancing organizational speed and agility. |
| QRvey | Business users can explore data and generate insights independently, allowing technical teams to focus on strategic tasks. |
FineBI demonstrates the value of self service analytics in real-world scenarios. Macao Water, a leader in the Asian water industry, adopted FineBI to overcome scattered and siloed data. The company integrated data from multiple sources and empowered teams to make data-driven decisions. This transformation led to enhanced data accessibility and increased productivity. You see how FineBI streamlines data connection, management, and analysis, supporting a culture of data-driven decision-making.
Tip: When you use FineBI, you gain the ability to create interactive dashboards, collaborate with your team, and access real-time insights on any device.
Self service analytics platforms like FineBI help you respond quickly to business needs, improve data literacy, and drive organizational success.
When you implement self service analytics, you may face several barriers. Data silos often appear as a major challenge. Departments store information in separate databases, making it hard to create a unified view. Risk management becomes difficult when you cannot trust the accuracy of your data. Cost control can slip if employees run duplicate queries without oversight. You may also encounter delays in creating consistent data sets, hesitation to invest in trusted data stores, and ongoing issues with data quality.
To overcome these barriers, you can use proven strategies:
A quick reference table helps you match challenges with solutions:
| Challenge | Impact Level | Solution Approach | Timeline |
|---|---|---|---|
| User Resistance | High | Champions program + quick wins | 4-8 weeks |
| Data Quality Issues | Medium | Governance framework + training | 8-12 weeks |
| Security Concerns | High | Role-based access + audit trails | 2-4 weeks |
Data governance and security are critical in self service analytics. You must protect sensitive data and ensure compliance with regulations. Risks include unauthorized access, poor data quality, and privacy violations. Effective governance balances control with usability. Regular reviews and leadership support help maintain standards. User education reduces risks.
Leading platforms address these concerns by:
Ethical data collection and clear consent controls build trust and ensure compliance.
Training is essential for successful self service analytics adoption. You should identify and train super users early. These individuals support others and help establish best practices. Hands-on training and structured programs make learning effective. A mature governance strategy maintains data integrity and security.
You can measure training success by monitoring productivity, evaluating work quality, and tracking employee retention. Learning management systems help you track participation and progress. Collecting feedback from participants gives you insights into training effectiveness. Linking training to business outcomes shows the real impact of your self service analytics initiative.
You need a clear plan to launch a successful self service analytics strategy. Start by focusing on data quality. High-quality data forms the foundation for reliable insights. Provide user-friendly tools so everyone can engage with data, not just technical experts. Establish governance to control data access and ensure everyone uses trusted sources. Offer training to help users avoid errors and improve the quality of their analysis. Develop standards to keep metrics and reports consistent across teams.
| Best Practice | Description |
|---|---|
| Data Quality | Build a strong foundation for analytics by maintaining clean, accurate data. |
| User-Friendly Tools | Make analytics accessible for all users. |
| Governance | Control data access and ensure reliability. |
| Training | Teach users how to use analytics tools effectively. |
| Standards Development | Keep metrics and reporting consistent. |
You can also embrace good data quality practices, create a report certification process, embed data science in reporting, and establish security practices early.
Selecting the right platform is a key step in your self service analytics strategy. Look for ease-of-use so you can access and analyze data quickly. Choose a platform that scales with your business and handles more users and data without slowing down. Flexibility lets you create custom reports independently. Strong security features protect your data from unauthorized access. AI-powered features help you find insights faster, even if you lack advanced skills.
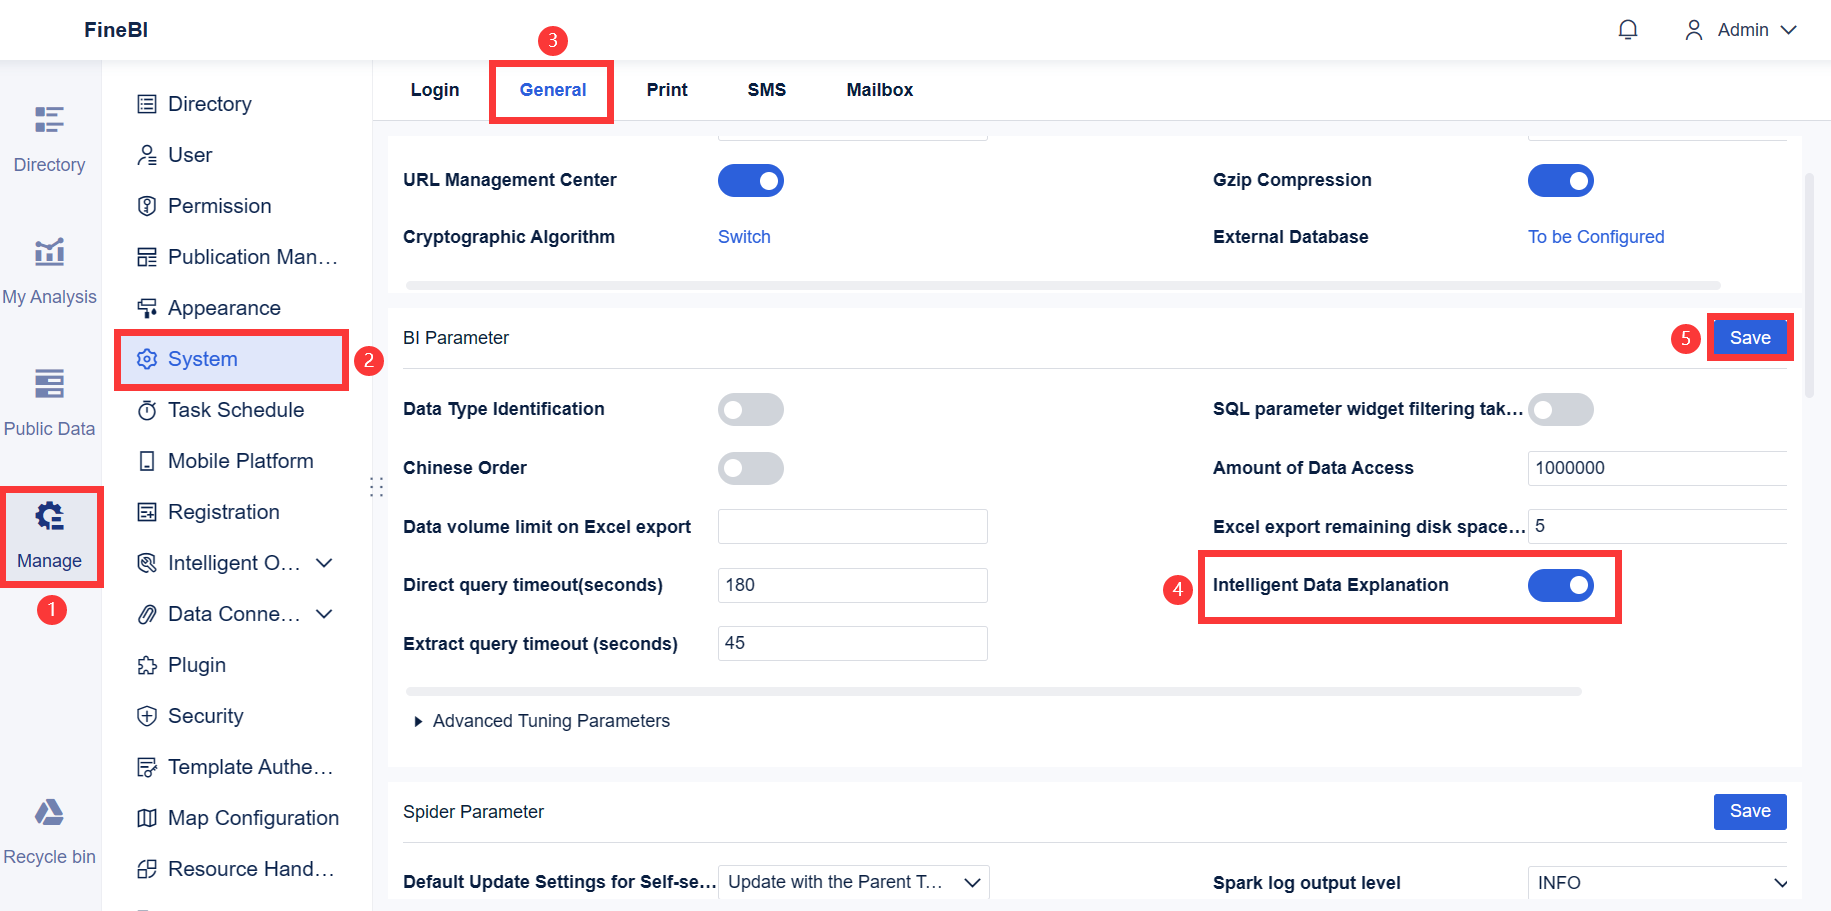
Tip: FineBI offers multitenancy, AI assistance, and robust data governance. These features support multiple departments, automate insights, and ensure data accuracy.
You should assess data sources, document governance policies, leverage metadata, automate validation checks, and monitor performance metrics to maintain data quality and consistency.
You will see major changes in self service analytics strategy over the next five years. Augmented analytics will use AI and machine learning to automate data analysis. Natural Language Processing (NLP) will let you interact with data using everyday language. Voice-based queries will become common, making data access even easier. Predictive insights will help you make proactive decisions. Embedded analytics will integrate insights into your daily workflow, empowering non-technical users and promoting data democratization.
Note: Staying updated with these trends will help you build a future-ready self service analytics strategy.
Self service analytics gives you the power to make faster, smarter decisions. You improve efficiency and build a data-driven culture in your organization. FineBI helps you connect, analyze, and share data with ease. You see practical benefits like real-time insights and better collaboration. To get started, review your current data processes, choose a platform like FineBI, and train your team. You can unlock the full value of your data and drive business success.

How to Do Retention Analysis for Business Success
What is Pareto Chart and How Does it Work
How DuPont Analysis Helps You Understand Your Business

The Author
Lewis
Senior Data Analyst at FanRuan
Related Articles
Data Analyst Dashboard: A Scenario-Based Guide to KPI Views That Drive Better Business Decisions
Learn how data analyst dashboards turn raw data into actionable KPI views for operational, analytical, and strategic decisions. Drive better business outcomes.
Lewis Chou
May 03, 2026

Self-Service Analytics Defined and Why You Need It
Self-service analytics lets you analyze data without IT help, empowering faster, data-driven decisions and boosting agility for your business.
Lewis
Jan 04, 2026
Best Self-Service Tools for Analytics You Should Know
See which self-service tools for analytics let business users access data, build dashboards, and make decisions faster—no IT help needed.
Lewis
Dec 29, 2025


