

Data interpretation involves analyzing raw information to uncover meaningful patterns and insights. In 2025, its importance is skyrocketing as businesses rely heavily on data to stay competitive. For instance, organizations using data as a strategic asset are 178% more likely to outperform their competitors in revenue and profitability. This shift reflects a growing demand for roles focused on interpreting data in sectors like healthcare and finance.
Tools like FineBI are transforming how businesses approach data interpretation. By simplifying complex datasets, FineBI enables you to extract actionable insights efficiently. With this capability, you can make informed decisions that drive growth and innovation.
Key Takeaways
- Data interpretation turns raw data into useful ideas. It helps businesses make smart choices and stay ahead.
- Tools like FineBI make data analysis easier. They help users find real-time insights and adjust how they understand data.
- Knowing the difference between data analysis and interpretation is important. Analysis finds patterns, while interpretation shows why they matter.
- Using AI and machine learning improves data interpretation. These tools automate tasks and find hidden patterns for better decisions.
- Following good data interpretation methods can bring clear results. This includes making more money and creating products faster.
Understanding Data Interpretation
Definition and Core Purpose
Data interpretation is the process of transforming raw data into meaningful insights that guide decision-making. It involves examining datasets to uncover patterns, trends, and relationships that might not be immediately visible. The core purpose of data interpretation is to enable businesses to make informed decisions based on data-driven insights.
Modern enterprises rely on data interpretation to enhance decision-making, increase operational efficiency, and gain a competitive advantage. For example:
- Enhanced decision-making allows you to make choices backed by comprehensive data analytics.
- Increased operational efficiency comes from automating data processes, saving time and resources.
- Real-time insights help businesses adapt quickly to market changes.
However, defining data interpretation in today’s digital landscape comes with challenges:
- Over-reliance on one data source can lead to incomplete conclusions.
- Using outdated data may result in decisions that fail to align with current market dynamics.
- Ignoring external factors can skew the interpretation and affect outcomes.
By addressing these challenges, you can unlock the full potential of data interpretation and ensure your business strategies remain relevant and effective.
How Data Interpretation Differs from Data Analysis
While data interpretation and data analysis are closely related, they serve distinct purposes. Data analysis focuses on processing and organizing raw data to identify patterns and trends. It involves techniques like regression analysis, segmentation analysis, and predictive modeling. On the other hand, data interpretation takes the results of data analysis and translates them into actionable insights.
Think of data analysis as the "what" and data interpretation as the "why." For instance:
- Data analysis might reveal a 20% drop in sales during a specific month.
- Data interpretation explains why this drop occurred, such as a decline in demand for a particular product or poor performance by a sales team.
Both processes are essential for effective decision-making. Data analysts often focus on the technical aspects of analysis, while business leaders rely on interpretation to guide their strategies. Together, they form the foundation for data-driven insights.
Real-World Examples of Data Interpretation
Data interpretation plays a vital role across industries, driving innovation and improving outcomes. Here are some real-world examples:
- Spotify: The music streaming giant uses data analytics to analyze user behavior and provide personalized music recommendations. This approach enhances customer satisfaction and drives business growth.
- Climate Change Studies: Researchers interpret temperature and precipitation data to identify patterns and inform policy decisions. These insights help governments and organizations address environmental challenges effectively.
- Pharmaceutical Industry: Companies use advanced analytics and predictive models to gain deeper insights into drug performance. This enables them to improve patient outcomes and optimize their research efforts.
In addition to these examples, businesses use various types of analysis to interpret data effectively. For instance, regression analysis helps identify factors affecting conversion rates, while cohort analysis tracks customer behavior over time.
The Importance of Data Interpretation in 2025
Role of AI and Machine Learning in Data Interpretation
Artificial intelligence has revolutionized how you approach data interpretation. By automating data processing, AI enhances efficiency and accuracy, especially when dealing with unstructured data sources like text or images. Machine learning models, on the other hand, uncover complex patterns that traditional methods often miss. These technologies allow you to extract deeper insights from your data analysis efforts.
Natural Language Processing (NLP) plays a significant role in analyzing text-based data. For example, it can help you understand customer feedback or social media trends. AI tools also provide real-time insights, enabling you to make timely adjustments in your decision-making processes. This capability is crucial for industries like healthcare and finance, where time-sensitive decisions can have significant impacts.
Key benefits of AI and machine learning in data interpretation include:
- Automating data processing to save time and reduce errors.
- Using NLP to analyze text-based data for richer insights.
- Detecting hidden patterns within datasets through machine learning models.
- Delivering real-time insights for faster and more informed decision-making.
By leveraging these technologies, you can enhance the importance of data interpretation in your organization and stay ahead in a competitive landscape.
Predictive Analytics and Real-Time Decision-Making
Predictive analysis has become a cornerstone of modern data-driven decision-making. It allows you to forecast future trends by analyzing historical data, enabling proactive strategies. For instance, sales teams can use predictive analytics to identify dissatisfied clients early, reducing churn rates. Similarly, businesses can manage inventories more effectively by understanding past patterns.
The benefits of predictive analytics for real-time decision-making include:
| Benefit | Description | | --- | --- | | Operational Efficiency | Data analytics can expose avenues for increasing profitability by managing risk and reducing waste. | | Strategic Decision-Making | Organizations can leverage past patterns to gain a business advantage in various operational facets. | | Risk Management | Predictive analytics enables proactive engagement with clients, helping to identify and mitigate risks. |
Managing the Growing Volume of Data with Tools like FineBI
The exponential growth of data in 2025 presents both challenges and opportunities. Managing this vast amount of information requires advanced tools like FineBI. This self-service business intelligence software simplifies data interpretation by integrating data from multiple sources and providing real-time analysis.

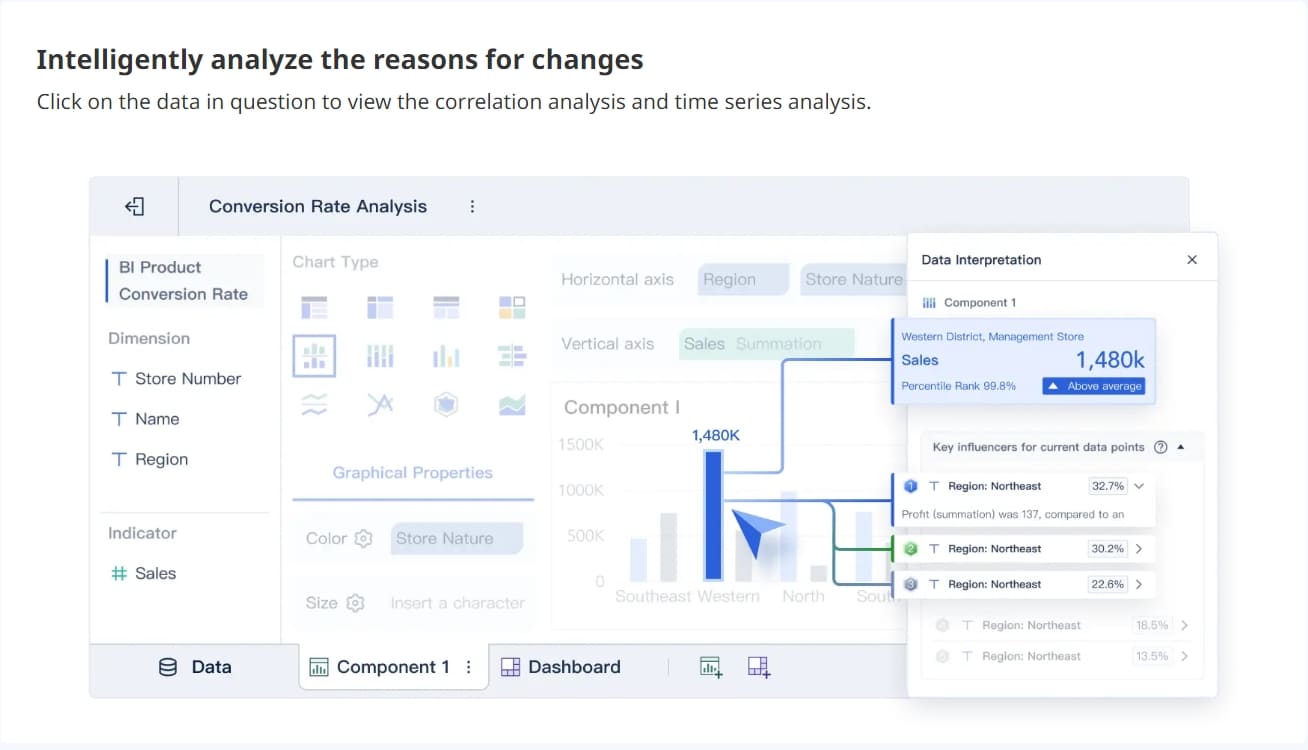
FineBI's data interpretation feature allows you to identify key factors influencing your business performance. For example, if sales drop during a specific month, FineBI can highlight the product categories or sales teams responsible. You can also customize your analysis to focus on the most relevant dimensions, ensuring that your insights align with your business objectives.
Key features of FineBI include:
- Real-time data analysis for immediate decision-making.
- Integration with various data sources for comprehensive insights.
- Customizable settings to tailor your data interpretation process.
By using tools like FineBI, you can manage the growing volume of data effectively and unlock its full potential. This approach not only enhances your data-driven decision-making but also ensures that your strategies remain relevant in a rapidly changing world.

Key Benefits of Data Interpretation
Driving Informed Decision-Making
Data interpretation empowers you to make informed decisions by transforming raw data into actionable insights. It simplifies complex datasets, enabling you to understand customer behavior, market trends, and operational inefficiencies. For example, data analytics enhances communication by breaking down intricate information into clear, actionable points. This clarity supports better planning and forecasting, helping you align your strategies with real-world data.
By relying on data-driven decisions, you can reduce risks and identify opportunities. For instance, analyzing customer feedback allows you to adjust your offerings to meet their needs. Similarly, understanding market trends helps you stay ahead of competitors. This approach ensures that your business decisions are based on facts rather than intuition, leading to improved performance and a competitive edge.
Identifying Trends and Patterns for Strategic Growth
Data interpretation plays a crucial role in identifying market trends and patterns that drive growth. By analyzing historical data, you can uncover insights that guide your long-term strategies. Businesses often rely on three types of trends:
| Type of Trend | Description | | --- | --- | | Linear Pattern | A continuous increase or decrease in numbers over time, represented as a straight line on a graph. | | Seasonal Trends | Trends that allow businesses to adjust strategies for profitability during peak and off-peak periods. | | Long-term Trends | Trends that help businesses align with macroeconomic developments and societal shifts for sustained growth. |
For example, seasonal trends enable you to optimize inventory during peak seasons, while long-term trends help you align with broader market shifts. By developing insight-based strategies, you can position your business for sustained success.
Gaining a Competitive Edge with Data Analytics
Data analytics gives you the power to outperform competitors by uncovering insights that drive smarter strategies. It transforms raw data into actionable knowledge, enabling you to make decisions that align with market demands and customer expectations. In 2025, businesses that leverage data analytics effectively will lead their industries.
FineBI: Your Partner in Gaining an Edge
FineBI empowers you to harness the full potential of data analytics. Its real-time analysis and visualization tools simplify complex datasets, enabling you to identify trends and opportunities quickly. With FineBI, you can:
- Track key performance indicators (KPIs) to measure success.
- Analyze customer feedback to refine your offerings.
- Collaborate with teams to share insights and align strategies.
Tip: Use FineBI’s data interpretation feature to uncover hidden factors influencing your business performance. This tool helps you make targeted adjustments that drive growth.
By integrating data analytics into your decision-making process, you can stay ahead of competitors and adapt to a rapidly changing business landscape.
Types of Data Interpretation and Tools for 2025
Qualitative Data Interpretation
Qualitative data interpretation focuses on analyzing non-numerical information, such as customer feedback, interviews, or social media posts. This method helps you understand the underlying reasons, motivations, and sentiments behind trends. For example, interpreting customer reviews can reveal why a product is popular or identify areas for improvement.
Using qualitative methods often saves time and resources compared to traditional approaches.
- A rapid qualitative analysis requires 409.5 analyst hours, significantly less than the 683 hours needed for traditional methods.
- It eliminates transcription costs, saving up to $7,250.
- Despite condensing data earlier, it achieves similar depth in insights.
Qualitative interpretation is ideal for businesses aiming to enhance customer experiences or refine marketing strategies. By focusing on themes and patterns, you can uncover actionable insights that drive growth.
Quantitative Data Interpretation
Quantitative data interpretation involves analyzing numerical data to identify patterns, trends, and correlations. This method provides structured insights that inform decision-making. For instance, analyzing sales figures can help you identify seasonal trends or predict future demand.
Key benefits of quantitative interpretation include:
- Uncovering insights and identifying patterns through structured analysis.
- Enhancing analytics accuracy with advanced techniques like machine learning.
- Improving reliability by ensuring representative data and addressing biases.
Quantitative methods are essential for industries like finance and healthcare, where precision and accuracy are critical. By leveraging these techniques, you can make data-driven decisions that align with your business objectives.
Leveraging FineBI for Advanced Data Analytics
FineBI empowers you to take data interpretation to the next level. Its advanced data visualization capabilities simplify complex datasets, enabling you to uncover hidden insights. For example, FineBI’s data interpretation feature highlights key influencing factors for any data point, such as identifying which product categories contributed to a sales decline.

FineBI offers tools that enhance your analytics process:
- Real-time data analysis ensures immediate insights for agile decision-making.
- Customizable settings allow you to focus on relevant dimensions.
- Integration with multiple data sources provides comprehensive analysis.
With FineBI, you can track trends, analyze correlations, and benchmark performance against industry standards. These features make it an indispensable tool for businesses aiming to optimize strategies and stay competitive in 2025.
Tip: Use FineBI’s data interpretation feature to perform time sequence comparisons and identify growth rates across different periods.
The Process of Data Interpretation
Data Collection and Preparation
Data collection and preparation form the foundation of the data analysis process. This step ensures that the data you work with is accurate, relevant, and ready for interpretation. To achieve this, you should focus on three key methodologies:
- Collect both direct and indirect evidence. Direct evidence includes tangible outputs like customer purchase records, while indirect evidence captures perceptions, such as survey responses.
- Design unbiased data collection methods. This ensures that all groups or categories are represented fairly, avoiding skewed results.
- Use multiple methods to gather data. Combining techniques like surveys, interviews, and automated data scraping enhances reliability and provides a more comprehensive dataset.
By following these practices, you can create a robust dataset that supports meaningful data interpretation. Tools like FineBI simplify this process by integrating data from multiple sources and ensuring consistency across datasets.

Data Analysis Techniques for 2025
Modern data analysis techniques have evolved significantly, offering businesses powerful tools to uncover insights. In 2025, methods like exploratory data analysis (EDA) and inferential statistics are driving better decision-making.
| Source | Improvement | Description | | --- | --- | --- | | Deloitte | 30% | Businesses using EDA improve decision-making. | | Harvard Data Science Review | Up to 40% | Businesses leveraging inferential statistics improve forecasting accuracy. |
EDA helps you identify patterns and anomalies in your data, while inferential statistics allow you to make predictions based on historical trends. These techniques, combined with tools like FineBI, enable you to analyze data efficiently and uncover actionable insights. FineBI’s advanced features, such as real-time analysis and customizable settings, further enhance the data analysis process.
Data Visualization and Communication of Insights
Data visualization plays a critical role in communicating complex insights effectively. Visual tools transform raw data into easily understandable formats, helping you share findings with stakeholders. Proven methods for visual representation include:
- Line charts for tracking trends over time.
- Bar and column charts for comparing data across categories.
- Pie charts for illustrating proportions within a dataset.
- Maps for analyzing geographic patterns.
- Dashboards for combining multiple visualizations into a single interface.
FineBI excels in this area by offering over 60 chart types, including advanced options like Sankey diagrams and waterfall charts. These tools allow you to present data in a visually compelling way, ensuring your audience grasps the key insights quickly. By leveraging effective data visualization, you can bridge the gap between analysis and actionable decision-making.
Enhancing Efficiency with FineBI’s Data Interpretation Features
FineBI’s data interpretation features revolutionize how you analyze and act on data. These tools simplify complex datasets, allowing you to focus on what truly matters—making informed decisions quickly and effectively.
Key Features That Boost Efficiency
- Automatic Analysis
FineBI automatically identifies key factors influencing your data. For example, if sales drop in a specific month, the tool pinpoints the product categories or sales teams responsible. This automation saves you time and eliminates guesswork. - Customizable Settings
You can tailor the analysis to focus on dimensions that align with your business goals. This flexibility ensures that you only see insights relevant to your objectives, reducing distractions and improving clarity. - Time Sequence Comparisons
FineBI enables you to compare data across different time periods. This feature helps you identify trends, growth rates, and seasonal patterns, empowering you to plan more effectively.
Benefits of Using FineBI
Tip: Use FineBI’s built-in plugins to streamline your workflow. No installation is required, making it easier to get started.
- Save Time: Automating data interpretation reduces the hours spent on manual analysis.
- Improve Accuracy: FineBI minimizes human error by providing precise, data-driven insights.
- Enhance Collaboration: Teams can share dashboards and analysis results, ensuring everyone stays aligned.
FineBI’s data interpretation features transform raw data into actionable insights. By leveraging these tools, you can enhance efficiency, make smarter decisions, and stay ahead in a competitive market.
The growing importance of data interpretation in 2025 cannot be overstated. With 90% of all data created in just the last two years and daily data generation reaching 2.5 quintillion bytes, businesses must harness this information effectively. Tools like FineBI empower organizations to navigate this data explosion by offering robust visualizations, KPI alignment, and industry-specific solutions.
By adopting advanced data interpretation skills, you can achieve measurable outcomes such as an 8% increase in profit margins and a 26% faster time-to-market for new products. The future of data interpretation tools, driven by AI and immersive technologies like AR, promises even deeper insights into consumer behavior.
Tip: Start enhancing your data interpretation skills today to stay competitive in this data-driven era.
Click the banner below to experience FineBI for free and empower your enterprise to convert data into productivity!
FAQ
Data interpretation focuses on understanding the meaning behind the data, while data visualization presents data in graphical formats like charts or graphs. Visualization helps you see patterns, but interpretation explains why those patterns exist and how they impact your decisions.
FineBI automates analysis, highlights key factors, and provides customizable settings. You can quickly identify trends, compare time periods, and focus on relevant dimensions. Its user-friendly interface ensures you extract actionable insights without needing advanced technical skills.
Absolutely! FineBI’s intuitive design and self-service features make it accessible to users without technical expertise. You can explore data, generate insights, and collaborate with teams effortlessly, empowering you to make data-driven decisions independently.
Real-time analysis allows you to respond instantly to market changes. It helps you adjust strategies, optimize operations, and seize opportunities as they arise. In a fast-paced world, staying agile gives you a competitive edge.
FineBI uses a high-performance computing engine to process massive datasets efficiently. It supports over 10,000 users for online viewing and integrates data from multiple sources, ensuring seamless analysis even with complex data environments.


