Ad hoc reporting tools are designed to help business users answer specific questions on demand instead of waiting for a scheduled report or a custom build from IT. If your team needs to quickly check why sales dipped, compare regional performance, filter inventory by supplier, or export a one-off finance summary, you are looking for software that supports fast self-service reporting without sacrificing accuracy or governance.
For IT managers, analysts, operations leaders, and finance teams, the real challenge is not just finding a tool with charts. It is finding one that balances speed, usability, data control, and reporting depth. Some tools are excellent for interactive analysis. Others are better for governed enterprise reporting, printable reports, scheduled distribution, or operational workflows.
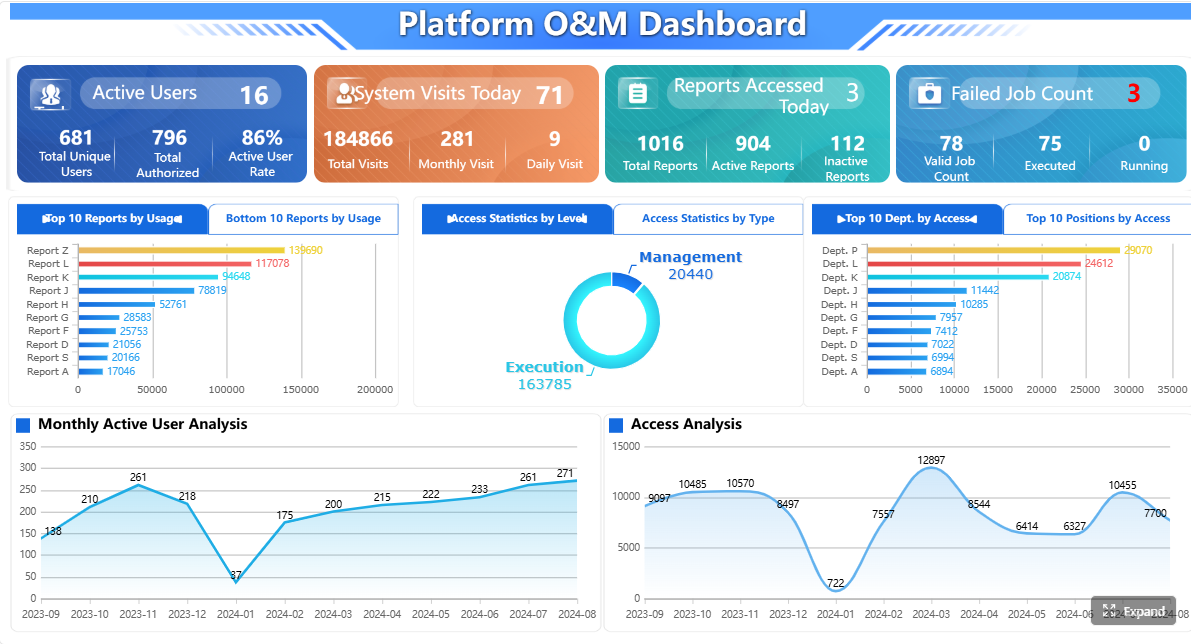 Click To Try The Dashboard
Best ad hoc reporting tools at a glance
If you need a fast shortlist, this table compares leading ad hoc reporting tools by reporting style, team fit, and typical buying pattern.
Quick Comparison Table
| Tool | Best for | Dashboarding | Ad hoc self-service | Pixel-perfect reporting | Scheduling and distribution | Governance | Pricing model | Recommended users |
|---|---|---|---|---|---|---|---|---|
| Microsoft Power BI | Microsoft-centric BI teams | Strong | Strong | Limited for highly formatted reporting | Good | Strong | Per-user and capacity options | Analysts, BI teams, enterprise departments |
| Tableau | Visual exploration and interactive analytics | Very strong | Strong | Limited for formal paginated output | Good | Strong | Per-user tiers | Data analysts, business intelligence teams |
| Qlik Sense | Associative exploration across complex datasets | Strong | Strong | Limited | Good | Strong | Quote-based / enterprise pricing | Enterprises needing flexible exploration |
| SAP Analytics Cloud | SAP-centered analytics and planning | Strong | Moderate to strong | Limited | Good | Strong | Subscription / quote-based | SAP-heavy organizations |
| Looker Studio | Simple dashboarding in the Google ecosystem | Moderate | Moderate | Weak | Basic | Moderate | Free with paid ecosystem dependencies | Small teams, marketers, lightweight reporting |
| Zoho Analytics | Affordable self-service reporting | Good | Strong | Moderate | Good | Moderate | Tiered subscription | SMBs and mid-market teams |
| Domo | Broad cloud BI with packaged connectors | Strong | Strong | Moderate | Good | Strong | Quote-based | Mid-market and enterprise business teams |
| Sisense | Embedded and scalable analytics | Strong | Moderate to strong | Moderate | Good | Strong | Quote-based | Product teams, embedded analytics use cases |
| IBM Cognos Analytics | Governed enterprise reporting and analysis | Good | Moderate | Stronger than many BI tools | Strong | Strong | Subscription / quote-based | Large enterprises, regulated environments |
| Yellowfin BI | Guided analytics and operational BI | Good | Moderate | Moderate | Good | Moderate to strong | Quote-based | Mid-market operational reporting teams |
| Metabase | Lightweight self-service analytics | Moderate | Strong for simple use cases | Weak | Basic | Moderate | Open-source and paid cloud options | Startups, internal analytics teams |
| GoodData | Governed analytics and embedded use cases | Good | Moderate | Moderate | Good | Strong | Quote-based | SaaS and enterprise teams |
| Mode | Analyst-centric reporting with SQL workflows | Moderate | Moderate | Weak | Basic to moderate | Moderate | Quote-based | Data teams and advanced analysts |
| AnswerRocket | Search and AI-assisted analytics | Good | Moderate to strong | Weak | Moderate | Moderate | Quote-based | Business users exploring NLQ-style reporting |
| InetSoft Style Intelligence | Reporting plus dashboard flexibility | Good | Moderate | Strong for formatted reporting use cases | Strong | Moderate to strong | Quote-based | Teams needing a mix of BI and structured reports |

Quick recommendations
- Small teams on a budget: Looker Studio, Zoho Analytics, or Metabase
- Enterprise BI and governance: Power BI, Tableau, Qlik Sense, SAP Analytics Cloud, IBM Cognos Analytics
- Embedded or product analytics: Sisense, GoodData
- Operational reporting with scheduled, formatted output: IBM Cognos Analytics, InetSoft Style Intelligence, and in many enterprise reporting scenarios, FineReport is worth evaluating alongside BI-first tools
How to evaluate ad hoc reporting tools for business teams
Choosing ad hoc reporting tools is less about feature count and more about fit. The right platform depends on who builds reports, how often data changes, how much governance you need, and whether your output is mainly exploratory dashboards or structured operational reports.
Core features that matter most
Flexible drag-and-drop report building
Business teams usually expect ad hoc reporting to be fast and visual. A good tool should let users select fields, apply filters, group results, and switch between tables and charts without writing code for every request.
Look for:
- Drag-and-drop report builders
- Reusable dimensions and metrics
- Drill-down and pivot-style views
- Easy export to Excel, PDF, or CSV
Real-time data access and filtering
Ad hoc reporting loses value if users are working from stale extracts. Many teams need near-real-time access for sales, operations, finance, or service monitoring.
Important capabilities include:
- Live or frequently refreshed data connections
- Date, region, product, and department filters
- Parameter queries for reusable report templates
- Fast response time under common business workloads
Dashboard sharing, exports, and scheduled delivery
Even though ad hoc reports are often one-off, useful findings usually need to be shared. Teams may also want to turn ad hoc discoveries into recurring reports later.
Evaluate whether the tool supports:
- Shared dashboards and report links
- PDF, Excel, image, and CSV exports
- Email subscriptions
- Scheduled delivery for recurring reports
Governance, permissions, and data accuracy controls
Self-service only works when users trust the numbers. Without governance, ad hoc reporting can create duplicate metrics, version confusion, and report sprawl.
Core controls include:
- Role-based access permissions
- Certified datasets or governed semantic layers
- Auditability and usage tracking
- Row-level or column-level security where needed
Questions to ask before choosing a tool
Who will build reports: analysts, managers, or cross-functional teams?
If analysts are the main users, a tool with deeper modeling may work well. If managers and department users need to self-serve, simplicity matters more than analytical breadth.
How many data sources need to be connected?
A single CRM or ERP source is very different from a reporting environment that combines sales, finance, operations, and external data. Integration fit should be reviewed early.
Do you need embedded analytics, collaboration, or advanced visualization?
Some teams need customer-facing analytics inside applications. Others need internal KPI dashboards. Others need formal reporting packs and printable statements. These are different buying criteria.
What level of training and admin support will the team need?
A powerful platform may still fail if business users need constant help from BI developers. Consider adoption effort, onboarding time, and administration complexity.
The 15 best ad hoc reporting tools for 2026
Below is a balanced look at the most relevant ad hoc reporting tools across enterprise BI, self-service reporting, and specialized operational use cases.
Enterprise and BI-focused platforms
Microsoft Power BI
 Power BI remains a common choice for organizations already invested in Microsoft. It is widely used for dashboarding, self-service analytics, and departmental reporting.
Strengths
- Strong integration with the Microsoft ecosystem
- Good dashboarding and interactive exploration
- Broad adoption in enterprise environments
- Strong governance options when deployed well
Limitations
- Advanced modeling often requires DAX knowledge
- Can become complex for non-technical users
- Highly formatted, pixel-perfect operational reporting is not its main strength
Pricing
- Typically follows per-user licensing, with higher-cost options for broader enterprise capacity and distribution scenarios
Best use case
- Organizations that want mainstream BI with strong Microsoft alignment
Tableau
 Tableau is known for interactive visual analytics and exploratory reporting. It is often favored by analysts who want flexible data discovery and polished visual storytelling.
Strengths
- Rich visual exploration
- Strong interactivity and drill-down experiences
- Flexible for analyst-led ad hoc analysis
Limitations
- Learning curve can be higher for casual users
- Viewer and role licensing can add up
- Less focused on formal paginated reporting workflows
Pricing
- Usually sold through user-based subscription tiers
Best use case
- Teams prioritizing visual analysis and data storytelling
Qlik Sense
 Qlik Sense stands out for associative exploration, helping users analyze relationships across data without being limited to one fixed query path.
Strengths
- Flexible exploration across large, connected datasets
- Strong enterprise governance options
- Useful for discovering non-obvious relationships in data
Limitations
- Can require more setup and expertise than lightweight tools
- Not primarily designed for highly formatted operational documents
Pricing
- Usually quote-based or enterprise-oriented
Best use case
- Enterprises with complex data relationships and governed self-service goals
SAP Analytics Cloud
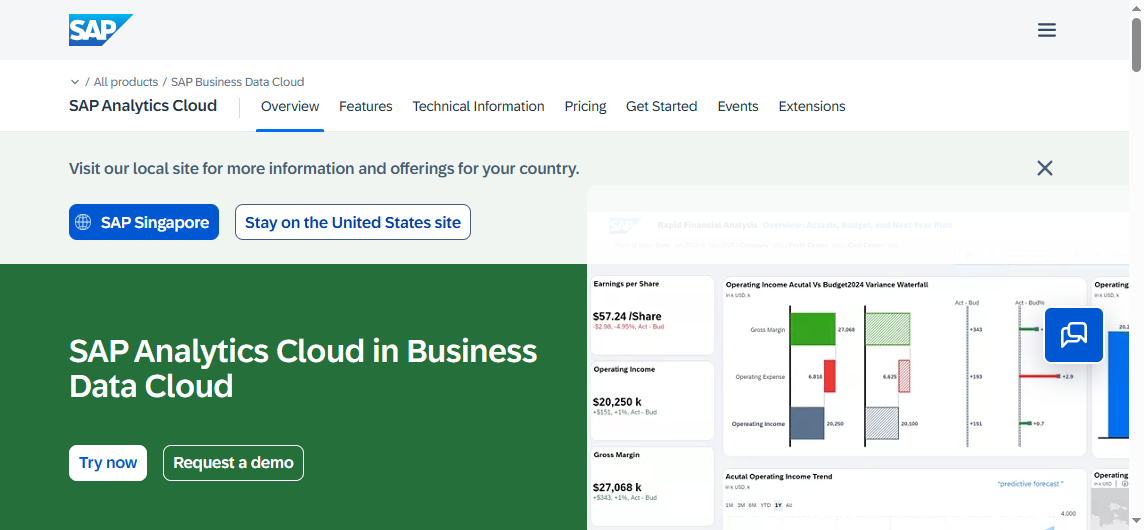 SAP Analytics Cloud is often evaluated by organizations that already rely on SAP systems for enterprise planning and analytics.
Strengths
- Natural fit for SAP environments
- Combines analytics and planning workflows
- Strong enterprise governance potential
Limitations
- Broader platform complexity may be more than some teams need
- May be less appealing outside SAP-centered environments
Pricing
- Subscription or enterprise quote-based pricing
Best use case
- Large organizations with existing SAP investments
Mid-market and self-service reporting tools
Looker Studio
 Looker Studio is popular for lightweight reporting, especially in Google-centric marketing and web analytics environments.
Strengths
- Easy to start with
- Accessible for basic dashboarding
- Useful for lightweight reporting needs
Limitations
- Limited for deeper enterprise governance
- Can struggle with complex data modeling and larger-scale performance
- Not ideal for structured enterprise reporting outputs
Pricing
- Commonly free to start, though broader stack costs may still apply
Best use case
- Small teams needing quick, simple dashboards
Zoho Analytics
 Zoho Analytics is often considered by small and mid-sized businesses that need affordable self-service BI.
Strengths
- User-friendly report creation
- Broad business reporting coverage
- Generally approachable for non-technical users
Limitations
- Can become less efficient with very large or highly complex data needs
- Advanced customization may require more knowledge than expected
Pricing
- Tiered subscription plans
Best use case
- SMBs wanting accessible reporting without enterprise-level overhead
Domo
 Domo offers a broad cloud BI platform with a strong business-user orientation and many packaged integrations.
Strengths
- Good dashboarding and sharing
- Wide connector coverage
- Suited to cross-functional business reporting
Limitations
- Can feel heavyweight for simple ad hoc needs
- Cost structure often requires direct vendor evaluation
Pricing
- Usually quote-based
Best use case
- Mid-market or enterprise teams wanting a broad all-in-one BI platform
Sisense
 Sisense is commonly evaluated for embedded analytics and scalable analytic delivery.
Strengths
- Strong embedded analytics potential
- Scales for customer-facing and internal use cases
- Flexible analytics architecture
Limitations
- May require heavier implementation effort
- Could be more than needed for simple departmental reporting
Pricing
- Typically quote-based
Best use case
- Embedded analytics and product reporting scenarios
Operational reporting and specialized use cases
IBM Cognos Analytics
 IBM Cognos Analytics remains relevant where enterprise governance, reporting consistency, and structured outputs matter.
Strengths
- Mature enterprise reporting capabilities
- Strong governance and security
- Better fit than many BI tools for more formal reporting use cases
Limitations
- May feel less lightweight than modern self-service-first tools
- User experience can be more enterprise-oriented than casual-user-friendly
Pricing
- Subscription or enterprise pricing
Best use case
- Large organizations needing governed reporting and analytics
Yellowfin BI
Yellowfin BI is often considered for operational BI and collaborative analytics.
Strengths
- Good balance between dashboards and business reporting
- Useful for guided analytics and operational use cases
- Supports team sharing and recurring reporting workflows
Limitations
- Less market visibility than larger BI vendors
- Some advanced enterprise scenarios may need careful evaluation
Pricing
- Usually quote-based
Best use case
- Teams needing practical BI for recurring operational decisions
Metabase
 Metabase is a popular lightweight analytics option, especially for startups and technical teams.
Strengths
- Fast to deploy
- Friendly for simple self-service analytics
- Open-source path appeals to cost-conscious teams
Limitations
- Less robust for advanced governance and enterprise reporting
- Limited fit for highly formatted scheduled reporting
Pricing
- Open-source and hosted paid options
Best use case
- Startups and internal teams needing straightforward self-service analytics
GoodData
 GoodData is typically evaluated for governed analytics delivery and embedded scenarios.
Strengths
- Strong focus on governed analytics
- Suitable for embedded reporting and reusable metrics
- Useful for organizations standardizing analytics delivery
Limitations
- Not always the fastest fit for lightweight, casual ad hoc usage
- Pricing usually requires direct evaluation
Pricing
- Quote-based
Best use case
- Embedded and governed analytics programs
Mode
 Mode is often selected by analyst-heavy teams that want SQL-first flexibility with shareable reporting.
Strengths
- Strong for analyst workflows
- Good mix of notebook-style analysis and reporting
- Helpful for collaborative data teams
Limitations
- Less suitable for non-technical business users
- Self-service outside the analyst group may be limited
Pricing
- Usually quote-based
Best use case
- Data teams doing exploratory analysis and sharing insights
AnswerRocket
 AnswerRocket focuses on search- and AI-assisted analytics for business questioning.
Strengths
- Natural language style exploration can speed up initial analysis
- Useful for users who prefer question-driven interfaces
Limitations
- Real value depends on data quality and modeling
- Not every business question maps cleanly to NLQ-style interaction
Pricing
- Quote-based
Best use case
- Teams experimenting with AI-assisted self-service analytics
InetSoft Style Intelligence
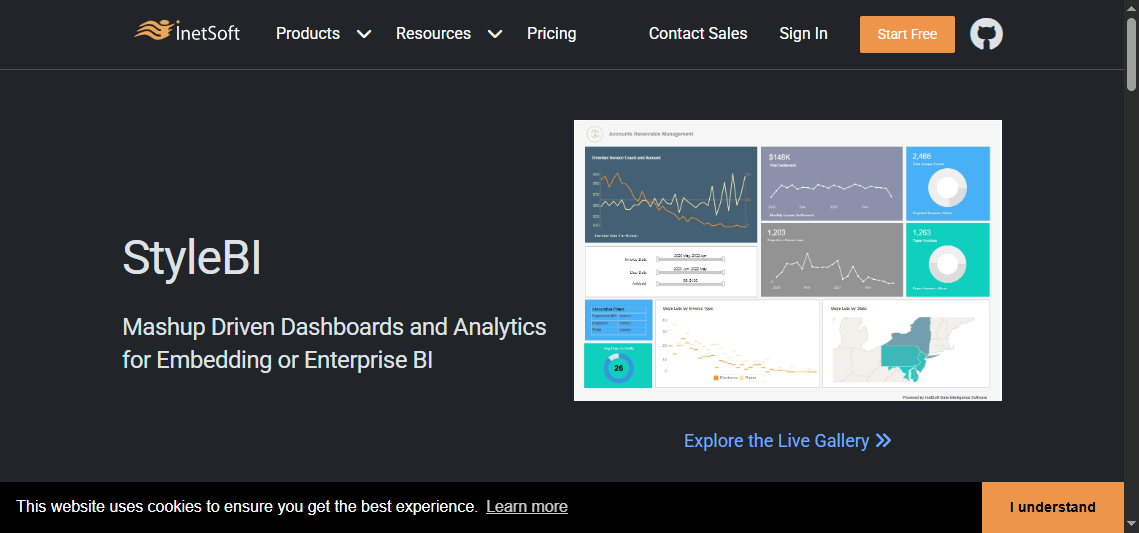 InetSoft Style Intelligence blends dashboarding with more structured reporting capabilities.
Strengths
- Can serve both visual BI and formatted reporting needs
- Useful for organizations wanting flexibility across reporting styles
- Supports scheduled outputs for operational workflows
Limitations
- Less mindshare than mainstream BI vendors
- Buyers should review product fit carefully for large-scale governance needs
Pricing
- Typically quote-based
Best use case
- Organizations needing both dashboards and structured report delivery

Pros, cons, pricing, and best use cases by tool
When comparing ad hoc reporting tools side by side, most differences come down to usability, governance maturity, deployment fit, and the type of reporting output the business needs.
Pros and limitations to compare side by side
Ease of use for non-technical teams
- Easier for casual business users: Looker Studio, Zoho Analytics, Metabase
- Balanced but may need onboarding: Power BI, Domo, Yellowfin BI
- More analyst or admin intensive: Tableau, Qlik Sense, Sisense, Mode, SAP Analytics Cloud, IBM Cognos Analytics
Depth of customization and advanced analysis
- Strong analytical flexibility: Tableau, Power BI, Qlik Sense, Mode
- Balanced self-service with business usability: Domo, Zoho Analytics, Yellowfin BI
- Specialized or governed delivery focus: GoodData, Sisense, IBM Cognos Analytics, SAP Analytics Cloud
Data connector coverage and integration flexibility
- Broad ecosystem fit: Power BI, Tableau, Domo, Sisense
- Best in specific ecosystems: Looker Studio for Google-oriented environments, SAP Analytics Cloud for SAP, Power BI for Microsoft
- More variable depending on architecture: Metabase, Mode, InetSoft Style Intelligence
Performance at scale and governance maturity
- Stronger enterprise governance: Power BI, Tableau, Qlik Sense, SAP Analytics Cloud, IBM Cognos Analytics, GoodData
- Good for smaller-scale agility: Looker Studio, Zoho Analytics, Metabase
- Requires case-by-case review for scaling strategy: Yellowfin BI, InetSoft Style Intelligence, AnswerRocket, Mode

Pricing patterns to expect in 2026
Ad hoc reporting tools usually follow one of a few pricing models, and the model affects long-term cost as much as the sticker price.
Free tiers and entry-level plans for small teams
These are common with lightweight tools and can be useful for testing adoption before enterprise rollout.
Typical examples:
- Free or low-cost entry paths for Looker Studio
- Lower entry tiers for Zoho Analytics
- Open-source or free-core options for Metabase
Per-user pricing vs usage-based pricing
- Per-user pricing is common with BI platforms like Power BI and Tableau
- Quote-based pricing is common with enterprise platforms such as Domo, Sisense, SAP Analytics Cloud, GoodData, and IBM Cognos Analytics
- Capacity or infrastructure-related costs may appear once distribution scales
Enterprise quotes, implementation costs, and hidden overhead
The biggest hidden costs are often:
- Admin time
- Data modeling effort
- User training
- Governance cleanup
- Rebuilding reports when self-service sprawl appears
For many organizations, the lowest license price does not equal the lowest total cost of ownership.
Best use cases by business need
Executive reporting and KPI tracking
Best fits:
- Power BI
- Tableau
- Domo
- SAP Analytics Cloud
These tools are strong when leadership wants interactive dashboards and routine KPI visibility.
Sales, finance, and marketing analysis
Best fits:
- Tableau for rich visual exploration
- Power BI for broad departmental BI
- Zoho Analytics for affordability
- Looker Studio for lightweight marketing reporting
- Mode for analyst-led deep dives
Embedded analytics for customer-facing products
Best fits:
- Sisense
- GoodData
These are often evaluated when analytics need to be delivered inside an application experience.
Operational and scheduling-focused reporting workflows
Best fits:
- IBM Cognos Analytics
- InetSoft Style Intelligence
And this is also where many BI-first evaluations reveal a gap: business teams may need not only ad hoc analysis, but also formatted operational reports, scheduled distribution, parameterized reports, print-ready outputs, and workflow-oriented reporting.
Which ad hoc reporting tool is best for your use case?
There is no single best ad hoc reporting tool for every organization. The better question is which platform matches your reporting style, governance needs, and user profile.
Best picks by team type
Best for small businesses with limited budgets
- Looker Studio
- Zoho Analytics
- Metabase
These are practical for teams that need quick answers without a large platform investment.
Best for enterprise governance and scalability
- Power BI
- Tableau
- Qlik Sense
- SAP Analytics Cloud
- IBM Cognos Analytics
These platforms are usually stronger for broad governance and multi-team deployment.
Best for fast self-service reporting
- Zoho Analytics
- Looker Studio
- Power BI
- Metabase
These are often easier to adopt for day-to-day business questions, depending on team skill level.
Best for data-driven scheduling and operational planning
- IBM Cognos Analytics
- InetSoft Style Intelligence
Also, for organizations where ad hoc reporting is only one part of a broader reporting workflow, FineReport deserves consideration.
Final shortlist and selection tips
To narrow your choices:
- Shortlist by user type first: analyst-led, manager-led, or mixed self-service
- Validate data source compatibility before feature comparisons
- Test a real scenario, such as “build a filtered regional sales report and schedule it weekly”
- Check whether users need dashboards only or also printable, paginated, and parameterized reports
- Review governance controls early, especially if multiple departments will self-serve
Common signs a tool may be the wrong fit:
- It looks powerful, but only specialists can build reports
- Users can self-serve, but no one trusts the metrics
- Dashboards look good, but operational teams still need Excel exports and manual formatting
- The platform handles analysis well, but recurring report distribution is awkward
Actionable guidance for choosing ad hoc reporting tools
Here are four practical recommendations I would give a reporting team before running demos:
1. Separate exploratory analytics from operational reporting
Many buyers bundle these together, but they are different needs. If your team asks one-off business questions, dashboard-first BI may be enough. If they also need board packs, statements, batch reports, or print-ready documents, evaluate structured reporting capabilities separately.
2. Use one real business workflow as your evaluation test
Instead of watching generic demos, test a realistic use case:
- Connect data
- Build an ad hoc report
- Filter by department and date
- Export to Excel and PDF
- Share with a manager
- Schedule recurring delivery
That workflow reveals usability and admin overhead much faster than a feature checklist.
3. Evaluate governance as early as visualization
A self-service tool only scales if definitions remain consistent. Ask how the platform handles permissions, reusable metrics, report certification, and auditability.
4. Check what happens after the ad hoc question is answered
The best tools support the full lifecycle:
- ask a question
- explore the data
- share the result
- operationalize it if needed
This matters for finance, operations, and management reporting teams.
When FineReport is a good fit for ad hoc reporting
Tools like Tableau and Power BI are widely used for visualization and BI analysis, but teams with complex reporting workflows may also need a dedicated enterprise reporting platform like FineReport.
FineReport is generally positioned for organizations that need more than dashboard-based self-service. It is especially relevant when ad hoc reporting overlaps with enterprise reporting, operational reporting, parameterized queries, printable reports, scheduled distribution, and form-based workflows.
Where FineReport fits naturally
FineReport is a strong option when business users need to:
- Build pixel-perfect reports with precise layouts
- Create paginated and printable reports for operations, finance, and management
- Run parameter queries for flexible on-demand filtering
- Automate scheduled report distribution
- Combine dashboards and detailed reports in one reporting environment
- Support data entry and form-based workflows in reporting scenarios
- Standardize reporting across departments with better governance
This makes FineReport particularly relevant for use cases such as:
- Financial statements and management reports
- Sales performance reports with drill-down detail
- Production, logistics, and inventory reporting
- Daily operational summaries and exception reports
- Enterprise reporting environments where business teams need both self-service access and controlled output
Unlike BI tools that focus primarily on interactive visual analysis, FineReport is often considered when the reporting requirement includes layout precision, recurring business workflows, and report distribution at scale.

Get Ready-to-Use Dashboard and Report Templates in Fine Gallery
FineReport compared with BI-first ad hoc tools
For readers evaluating mainstream ad hoc reporting tools, a practical way to think about FineReport is this:
- If your main goal is interactive BI exploration, tools like Power BI, Tableau, and Qlik Sense are common choices
- If your team also needs enterprise-grade report formatting, scheduling, parameterized operational reporting, and integrated forms, FineReport can be a better fit for that reporting layer
That does not mean one category replaces the other in every environment. Many organizations need both visual BI and structured enterprise reporting. The key is matching the tool to the reporting workload.
Final thoughts
The best ad hoc reporting tools in 2026 are not necessarily the ones with the most charts or the biggest brand presence. The right choice depends on whether your team needs lightweight self-service, governed enterprise BI, embedded analytics, or operational reporting with scheduled and printable outputs.
If your needs are mainly dashboard-driven, tools like Power BI, Tableau, Qlik Sense, and Zoho Analytics are logical places to start. If your organization also requires structured enterprise reports, parameterized queries, scheduled distribution, and report-driven workflows, FineReport is worth adding to the shortlist.
FAQs
An ad hoc reporting tool lets users create on-demand reports to answer specific business questions without waiting for a prebuilt report from IT. It is mainly used for fast, self-service analysis with filters, drill-downs, and exports.
Scheduled or static reports follow fixed templates and delivery times, while ad hoc reports are created whenever a new question comes up. Ad hoc reporting is more flexible, but it still needs clear data definitions and governance to stay reliable.
The most important features are an easy drag-and-drop builder, live or frequently refreshed data access, flexible filtering, export options, and strong permissions. Teams should also check whether the tool supports dashboards, formatted reports, scheduling, and the data sources they already use.
Small teams often start with lower-cost options like Looker Studio, Zoho Analytics, or Metabase. Enterprises usually need stronger governance and scalability from tools such as Power BI, Tableau, Qlik Sense, SAP Analytics Cloud, or IBM Cognos Analytics.
Some can, but many BI-first tools are stronger for interactive analysis than highly formatted output. If you need printable operational reports, scheduled distribution, or structured documents, tools like IBM Cognos Analytics, InetSoft Style Intelligence, or FineReport may be a better fit.


The Author
Yida Yin
FanRuan Industry Solutions Expert
Related Articles

Environmental Reporting Software Comparison: ESG Platforms vs BI Reporting Tools for Enterprise Teams
Environmental $1 helps enterprises collect, manage, analyze, and present environmental data such as emissions, energy, water, waste, and related sustainability metrics. If you are evaluating this category, you are likely
Yida Yin
Jul 02, 2026

Best KPI Reporting Software for 2026: 10 Tools Compared for Dashboards, Reports, and KPI Tracking
If you are searching for kpi $1 , you are likely trying to solve one of three problems: you need a better way to track business performance, you want clearer dashboards and reports for stakeholders, or you need a platfor
Yida Yin
Jun 29, 2026

12 Best KPI Reporting Tools for 2026: Compare Dashboarding, Automation, and Reporting Depth
If you are searching for the best KPI $1 , you are likely trying to solve a practical problem: how to track the metrics that matter, present them clearly, automate recurring updates, and turn performance data into decisi
Yida Yin
Jun 29, 2026