Environmental reporting software helps enterprises collect, manage, analyze, and present environmental data such as emissions, energy, water, waste, and related sustainability metrics. If you are evaluating this category, you are likely trying to solve one of three problems: improve compliance and disclosure readiness, give leadership better visibility into environmental performance, or replace fragmented spreadsheet-based processes with a more scalable reporting workflow.
For enterprise teams, the real decision is often not just which environmental reporting software to buy, but which type of software is the better fit. In practice, buyers usually compare two broad options:
- Purpose-built ESG platforms, which are designed to manage governed sustainability data and disclosure workflows
- General BI reporting tools, which are designed to visualize, analyze, and distribute data across the business
Both categories can play an important role, but they solve different parts of the problem. ESG platforms are often stronger in structured environmental data management and framework-aligned reporting, while BI tools are often stronger in dashboarding, cross-functional analytics, and operational reporting delivery.
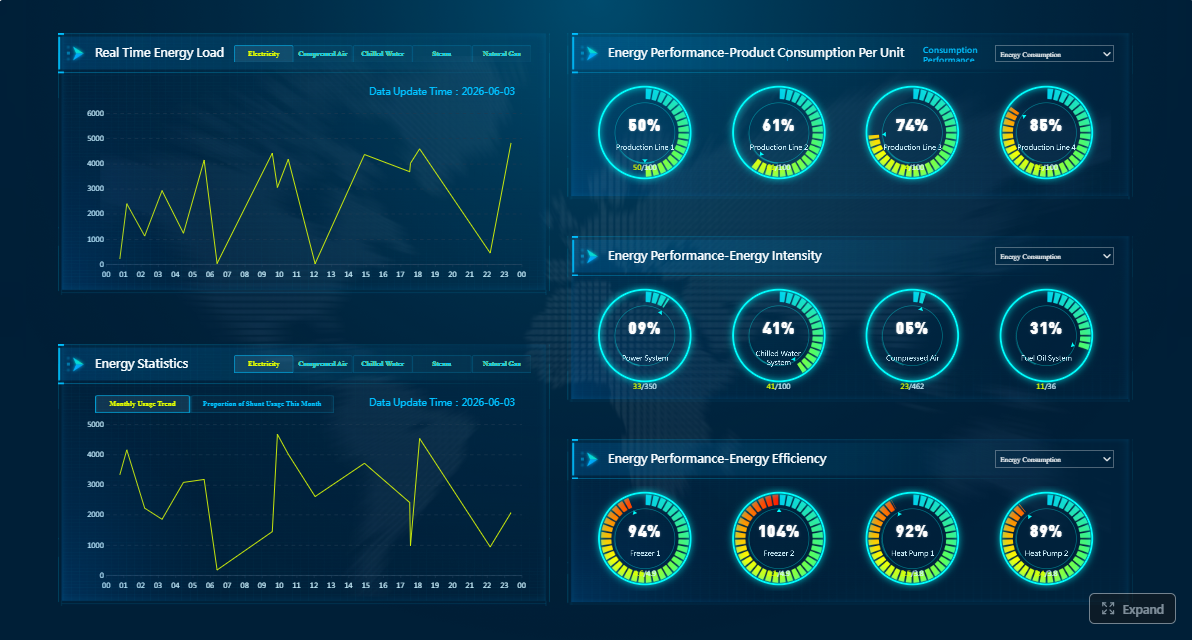 Click To Try The Dashboard
Quick Comparison Table
| Criteria | ESG Platforms | BI Reporting Tools | FineReport Relevance |
|---|---|---|---|
| Best for | Sustainability programs, disclosure management, governed ESG workflows | Enterprise dashboards, operational analytics, report distribution | Strong fit when teams need structured reporting, printable reports, dashboards, and workflow-driven reporting |
| Dashboarding | Usually available, but often centered on ESG metrics and compliance views | Typically strong for visual dashboards and interactive analysis | Supports dashboards integrated with detailed reports |
| Pixel-perfect reporting | Varies by vendor; not always the main focus | Varies widely; many BI tools focus more on visualization than formatted reporting | Strong fit for pixel-perfect, paginated, and print-ready reports |
| Paginated reports | Often limited or secondary to disclosure workflows | Available in some tools, weaker in others depending on platform | Well suited for paginated enterprise reporting |
| Data entry/forms | Common for ESG data collection, approvals, and attestations | Often requires customization or external apps | Supports data entry and form-based workflows |
| Scheduling and distribution | Common for submission cycles and recurring reporting | Common for dashboard subscriptions and report sharing | Supports scheduled reporting and automated distribution |
| Enterprise deployment | Good for ESG governance programs, often with dedicated admin models | Good for broad analytics deployment across departments | Relevant for enterprise reporting standardization |
| Ease of use | Better for sustainability teams needing guided workflows | Better for analysts and business users familiar with BI | Useful for teams that need both business-facing reports and controlled report design |
| Recommended users | Sustainability, compliance, ESG program leaders, assurance stakeholders | Data analysts, finance, operations, executives, enterprise BI teams | Good for reporting teams needing dashboards plus operational reports |
 |
Environmental reporting software at a glance
Enterprise teams need environmental reporting software that does more than display charts. In most organizations, environmental reporting spans multiple workflows: gathering site-level activity data, validating ownership, applying calculation logic, supporting audit review, producing management reports, and preparing external disclosures. That is why the category overlaps with ESG software, sustainability management tools, and business reporting platforms.
A useful evaluation starts with understanding where the tool fits in the broader reporting stack:
- System of record layer: where raw environmental data is collected and governed
- Calculation and control layer: where emissions factors, conversions, approvals, and business rules are managed
- Reporting and analytics layer: where dashboards, reports, and decision support outputs are delivered
Some products cover all three layers reasonably well. Others focus heavily on one layer and depend on integrations for the rest.
What enterprise teams need from environmental reporting software
Large organizations typically need a combination of the following:
- Reliable data collection across sites, regions, and business units
- Auditability for source records, changes, ownership, and approvals
- Scalability as reporting scope expands from energy and emissions into waste, water, suppliers, or broader ESG data
- Usability for sustainability teams, local contributors, executives, and auditors
- Compliance support for internal controls and external disclosure preparation
- Operational reporting for recurring business reviews, exception tracking, and management action
Environmental reporting often becomes more complex as programs mature. What starts as a carbon or utility reporting need can quickly evolve into a broader enterprise requirement involving finance, operations, procurement, legal, and executive stakeholders.
ESG platforms and BI tools are not the same thing
A common mistake is treating ESG platforms and BI tools as direct substitutes. They overlap, but their design priorities differ.
- ESG platforms usually focus on governed data collection, standard metrics, workflow control, and reporting aligned to sustainability or disclosure needs.
- BI reporting tools usually focus on data modeling, dashboarding, visual analysis, and business reporting across many domains.
That distinction matters because enterprise teams may need both. An ESG platform can serve as the controlled source for environmental metrics, while a BI reporting tool can provide broader management dashboards, operational reports, and printable packs for internal decision-making.
Core evaluation criteria
When comparing environmental reporting software, enterprise buyers should assess five areas first:
- Data quality: Can the tool handle validation, ownership, and consistent metric definitions?
- Auditability: Can you trace where data came from, who changed it, and which evidence supports it?
- Scalability: Will it support multi-site, multi-region, and evolving reporting scope?
- Usability: Can both contributors and decision-makers use it without heavy friction?
- Compliance support: Does it help prepare reports, reviews, and disclosure outputs with confidence?
ESG platforms vs BI reporting tools: the core differences
The biggest difference is simple: ESG platforms are usually designed to manage environmental reporting processes, while BI tools are usually designed to present and analyze information.
That does not make one universally better. It means they solve different parts of the enterprise reporting problem.
What ESG platforms are designed to do
Purpose-built ESG platforms are generally intended to centralize sustainability data in one governed environment. This often includes emissions, utility consumption, waste, supplier inputs, and disclosure-related data points.
Common strengths include:
- Centralized environmental and broader ESG data repositories
- Structured workflows for site submissions and data collection
- Approval, review, and attestation steps
- Standardized calculations and conversion logic
- Support for reporting frameworks and disclosure preparation
- Audit trails and evidence attachment
For enterprise sustainability teams, that governed structure can be especially valuable when reporting spans many contributors and high scrutiny. If assurance, disclosure consistency, and formal controls are central requirements, ESG platforms often align well.
However, these tools may be less flexible for broader business reporting outside the sustainability function. Executive teams and operations leaders may still need additional reporting layers for cross-functional management.
What BI reporting tools are designed to do
BI reporting tools are built to help organizations analyze and present data visually. They are often used for dashboards, trend analysis, drill-down exploration, and management reporting across finance, sales, supply chain, manufacturing, and operations.
Common strengths include:
- Interactive dashboards
- Strong charting and data visualization
- Cross-functional analysis across multiple business domains
- Flexible data modeling and report design
- Broad enterprise adoption beyond sustainability teams
- Distribution of internal management reports
For environmental reporting, BI tools can work well when the main need is visibility rather than governed ESG workflow management. If environmental data already exists in trusted systems, BI can help transform that data into executive dashboards, operational scorecards, and recurring reports.
The limitation is that BI tools often rely on upstream systems or custom processes for:
- Emissions calculations
- Data validation workflows
- Evidence collection
- ESG-specific metric structures
- Approval and disclosure governance
In other words, BI tools are often strong at showing results, but they may not be the system that ensures those results were collected and controlled correctly.
Where each option fits best
The right fit depends on your reporting maturity and business context.
ESG platforms are often a better fit when:
- You have compliance-heavy environmental or ESG reporting requirements
- Your organization needs formal collection and approval workflows
- You expect assurance scrutiny and need stronger traceability
- Your data is spread across many sites and manual submissions
BI reporting tools are often a better fit when:
- You already have trusted environmental data in source systems
- Leadership needs strong dashboards and recurring internal reporting
- You want environmental reporting integrated with finance or operations views
- Your analytics team already supports enterprise BI standards
A combined approach often works best when:
- Sustainability teams need governed ESG data management
- Executives need high-quality dashboards and board-ready reports
- Operations teams need recurring site, plant, or regional reports
- Different stakeholders need different output formats from the same core metrics

Feature-by-feature comparison for enterprise teams
A category-level comparison is useful, but enterprise teams should also compare the practical workflows that determine long-term success.
Data collection and management
Environmental reporting starts with data capture. This is where ESG platforms often have the advantage because they are usually designed for structured collection of environmental indicators across many contributors.
ESG platforms typically offer:
- Automated ingestion from selected business systems
- Manual entry workflows for local teams
- Evidence or supporting document capture
- Versioning and change tracking
- Ownership assignment by metric, site, or department
- Reminders and approval routing
BI reporting tools typically offer:
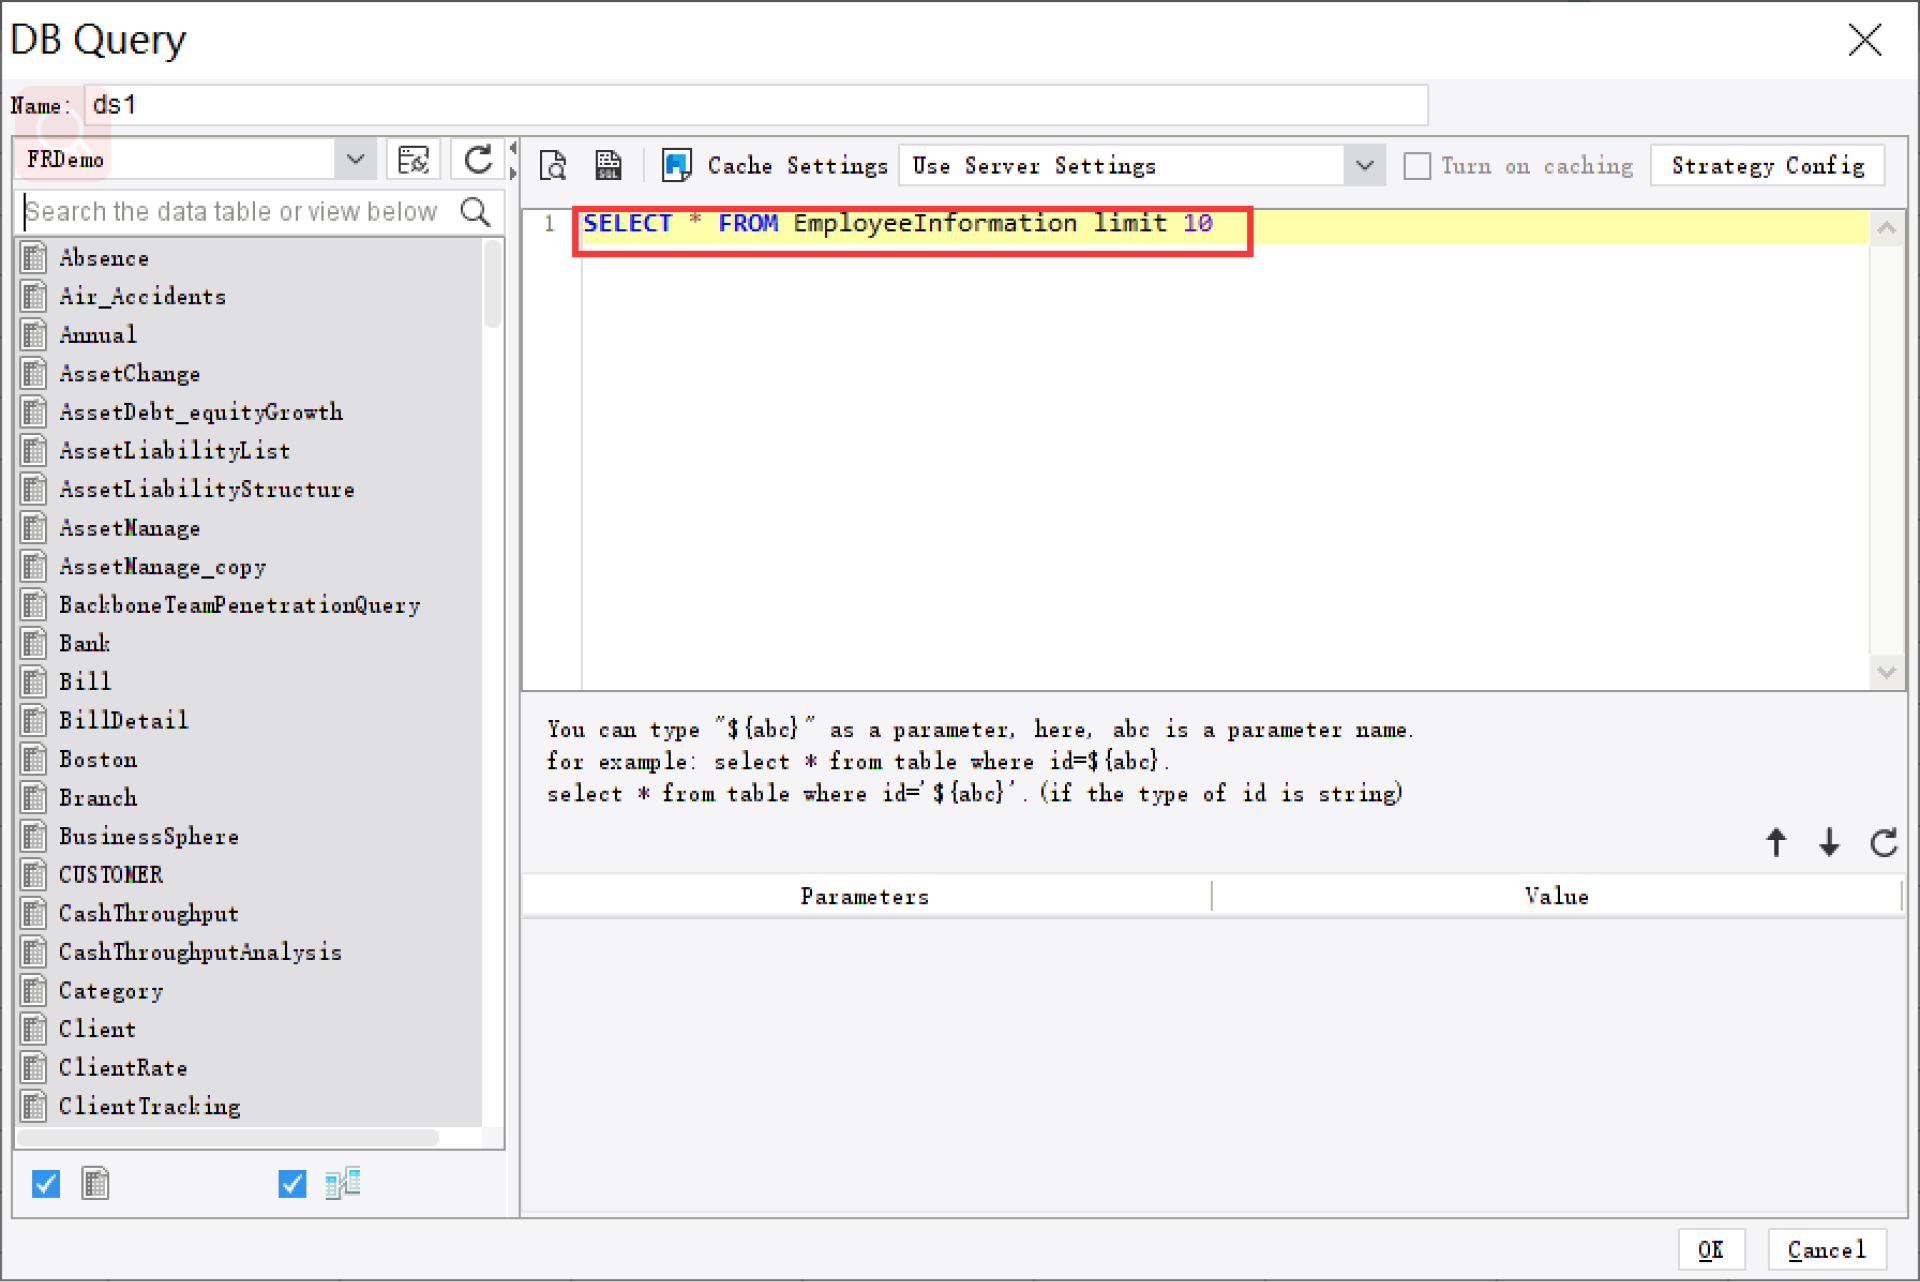
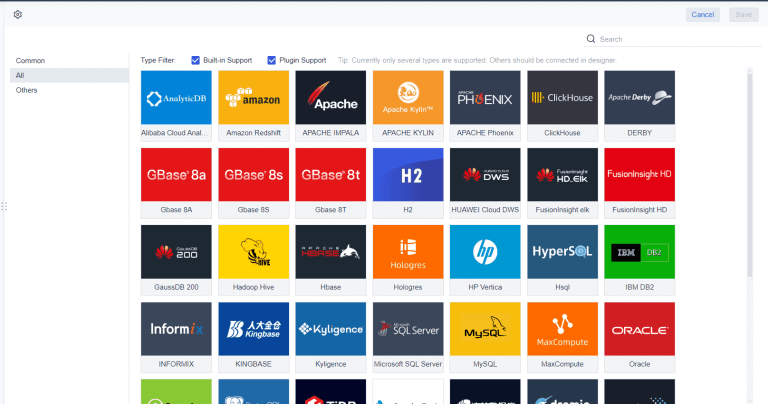
- Connections to databases, files, APIs, or enterprise applications
- Strong consumption and transformation of existing data
- Flexible report-layer presentation of collected data
- Limited native governance for environmental data submission unless customized
If your reporting process still depends on plant managers, facility teams, suppliers, or regional coordinators submitting data every month or quarter, ESG platforms usually reduce process risk. If your data is already clean and centralized, BI tools may be sufficient for the reporting layer.
Reporting, disclosures, and audit readiness
Environmental reporting is not just about dashboards. Many enterprise stakeholders still need formal reports, review packs, and documentation that supports assurance or external filing processes.
ESG platforms are typically stronger in:
- Framework-aligned disclosures
- Structured reporting packages for sustainability teams
- Review and approval controls
- Audit trail visibility
- Consistency of standard environmental metrics
BI reporting tools are typically stronger in:
- Internal management reporting
- Tailored executive reporting
- Department-level report customization
- Wider dissemination of business-friendly outputs
This is also where report formatting matters. A sustainability manager may need a disclosure-aligned dataset, while a board committee may want a clean monthly environmental performance pack. A regional operations leader may need a detailed site report with exceptions and notes.
Tools like Tableau and Power BI are widely used for visualization and BI analysis, but teams with complex reporting workflows may also need a dedicated enterprise reporting platform like FineReport. FineReport is particularly relevant where environmental reporting must be delivered as pixel-perfect reports, paginated documents, printable packs, parameterized queries, and scheduled distributions, not just interactive dashboards.
Analytics, dashboards, and decision support
For analytics and executive visibility, BI tools often stand out. They are built to help users track trends, slice by geography or business unit, and identify drivers behind performance changes.
BI reporting tools generally perform well for:
- Trend analysis over time
- Drill-down from enterprise to site level
- Combining environmental and operational KPIs
- Executive and management dashboards
- Self-service exploration in some deployments
ESG platforms generally perform well for:
- Sustainability-focused KPI tracking
- Program monitoring
- Target tracking tied to ESG initiatives
- Standardized environmental scorecards
The decision here depends on whether your stakeholders need specialized ESG oversight or broader business decision support. In many organizations, environmental performance needs to be reviewed alongside cost, output, logistics, or compliance indicators. That often pushes teams toward a BI layer even if ESG software remains the governed source.

Implementation, integrations, and total cost
Implementation effort is often underestimated. Software selection should account for not only licensing, but also data integration, internal ownership, workflow redesign, and long-term administration.
ESG platforms may involve:
- More process design around metric definitions and governance
- Configuration for sustainability frameworks and internal controls
- Integration with utility, ERP, or operational systems where available
- More specialized admin ownership by sustainability or ESG teams
BI reporting tools may involve:
- More internal work to define metric logic and validation processes
- Dependence on data engineering or BI teams
- Broader reuse across business functions
- Potentially lower friction if the BI stack is already established
Long-term cost should include:
- Internal technical support burden
- Data stewardship effort
- Change management across contributors
- Maintenance of calculation logic
- User training and report adoption
A platform that seems cheaper at procurement stage can become more expensive if your team must build large amounts of ESG-specific functionality from scratch.
Pros and cons of each approach
No environmental reporting software category is ideal for every use case. The trade-offs become clearer when you view them through governance, analytics, and enterprise reporting needs.
Advantages and trade-offs of ESG platforms
Advantages of ESG platforms
- Stronger governance for environmental and broader ESG data
- Better fit for structured collection and approval workflows
- More support for disclosure-oriented reporting
- Better standardization of environmental metrics across the enterprise
- Stronger audit trail expectations in many implementations
Trade-offs of ESG platforms
- Can require significant implementation effort
- May involve higher cost for narrower use cases
- Can be less flexible for broader enterprise analytics
- Risk of vendor lock-in if the process becomes highly platform-specific
- Internal users outside sustainability may still need separate reporting tools
For organizations under strong disclosure pressure or preparing for assurance-heavy reporting, these trade-offs may still be worth it.
Advantages and trade-offs of BI reporting tools
Advantages of BI reporting tools
- Flexible for dashboards, analytics, and management reporting
- Useful across many functions, not just sustainability
- Better for combining environmental metrics with operational and financial context
- Often align with existing enterprise data and reporting strategies
- Stronger visualization options in many use cases
Trade-offs of BI reporting tools
- Usually require more customization for ESG-specific workflows
- Weaker native controls for evidence capture and contributor governance
- Greater dependence on internal data and reporting teams
- Audit readiness may rely on upstream systems rather than the BI layer
- Sustainability teams may still need another tool for structured collection
For mature data organizations, BI tools can be highly effective. But they are rarely a complete replacement for governance-heavy
How to choose the right solution for your organization
The best environmental reporting software decision starts with the reporting problem, not the product demo. Too many teams choose based on dashboard appearance without clarifying whether they are buying a compliance platform, an analytics layer, or both.
Questions to ask before selecting a platform
Before you shortlist vendors, ask these questions:
-
What reporting scope do we need today and in two years?
Are you tracking only emissions and utilities, or also waste, water, suppliers, and broader ESG indicators? -
How important is assurance and auditability?
Will external stakeholders need traceable support for submissions, controls, and evidence? -
How complex are our operations?
Are you managing a few business units or a global, multi-site reporting network? -
Who are the primary audiences?
Sustainability teams, compliance teams, executives, plant managers, board members, investors, or all of the above? -
Is our biggest gap data governance or reporting delivery?
Do you need better collection controls, better dashboards, or better formatted enterprise reports? -
How much internal technical support do we have?
Can your BI or IT team build custom ESG workflows, or do you need more out-of-the-box structure?
Recommended decision framework
A practical selection process usually looks like this:
1. Match the tool to your maturity level
- Early-stage teams often need faster standardization and stronger workflow control
- Mature sustainability teams may prioritize integration, assurance, and cross-functional visibility
- Data-mature enterprises may combine ESG governance platforms with enterprise BI/reporting tools
2. Define your primary reporting objective
Choose the category based on the main business problem:
- Environmental compliance reporting: lean toward ESG platforms
- Executive visibility and operational analytics: lean toward BI reporting tools
- Broad ESG program management: ESG platforms often fit better
- Recurring enterprise report delivery: enterprise reporting tools become more important
3. Run a focused pilot
Test the shortlist on real scenarios such as:
- Site-level environmental data submission
- Monthly management pack creation
- Audit trail review
- Executive dashboard drill-down
- Multi-region metric consolidation
4. Use measurable success criteria
Evaluate pilots using:
- Time to collect and validate data
- Ease of producing recurring reports
- Ability to support reviews and approvals
- Traceability of metric changes
- Quality of dashboards and printable outputs
- Ongoing admin effort

Practical recommendations for enterprise teams
If you are comparing environmental reporting software right now, these recommendations can save time and reduce rework:
-
Separate governance needs from visualization needs.
A strong dashboard does not guarantee strong data controls, and a strong ESG workflow does not guarantee strong executive reporting. -
Evaluate printable and recurring reports, not just dashboards.
Many environmental reporting workflows still depend on board packs, site reports, review documents, and scheduled distribution. -
Map each stakeholder to a reporting format.
Executives may want dashboard summaries, auditors may want traceable records, and operations teams may need detailed tabular reports. -
Do not underestimate manual submission workflows.
If local teams still enter or confirm data, ownership tracking, forms, and approvals matter as much as analytics. -
Pilot with one real reporting cycle.
Test monthly or quarterly environmental reporting end to end before committing to enterprise rollout.
When FineReport is a good fit in environmental reporting workflows
For many enterprises, environmental reporting is not only a sustainability software question. It is also a reporting execution question. After data is collected and validated, teams still need to deliver reports that are readable, repeatable, and usable across management layers.
That is where FineReport can be relevant.
FineReport is an enterprise reporting platform designed for organizations that need more than visual dashboards alone. It is especially useful when environmental reporting outputs must support structured business workflows, such as:
- Monthly environmental performance packs
- Site or plant-level operating reports
- Management review reports with drill-down detail
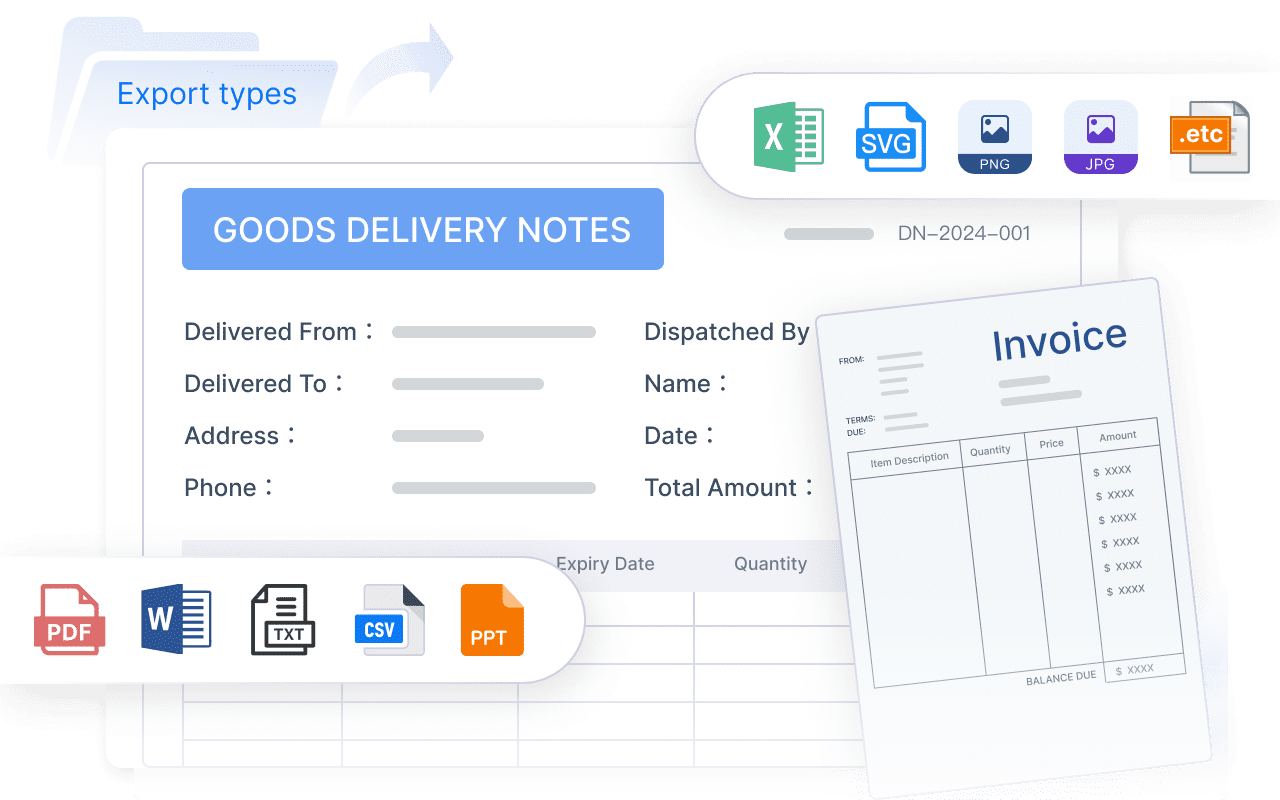
- Paginated and printable reporting documents
- Parameterized reports by period, region, or facility
- Scheduled report generation and distribution
- Form-based workflows for reporting input or confirmation
- Dashboards connected to underlying detailed reports
This makes FineReport a practical option for enterprise teams that already have environmental data in ESG systems, ERP systems, utility systems, or data warehouses, but still need a robust way to publish and distribute reporting outputs across the business.
Compared with visualization-first BI tools, FineReport is particularly relevant when report formatting and operational delivery matter. For example, a sustainability team may need a summary dashboard for leadership, while regional teams need detailed tabular reports that can be filtered, printed, exported, or distributed on a schedule. FineReport supports this kind of mixed reporting environment well.
It is not a replacement for every ESG platform use case. If your main requirement is framework-specific ESG workflow management, a purpose-built ESG platform may still be the better system of record. But if your challenge is turning governed environmental data into enterprise-ready dashboards, board packs, operational reports, and scheduled reporting workflows, FineReport deserves consideration.

Get Ready-to-Use Dashboard and Report Templates in Fine Gallery
Final takeaway
The best environmental reporting software depends on the job you need the tool to do.
- Choose ESG platforms when governance, disclosure support, and structured environmental data workflows are the top priority.
- Choose BI reporting tools when enterprise dashboarding, flexible analytics, and cross-functional visibility are the main goal.
- Consider FineReport when your organization needs a strong reporting layer for environmental data, especially for pixel-perfect reports, paginated documents, scheduled distribution, parameterized queries, dashboards, and operational reporting workflows.
For many enterprise teams, the most effective architecture is not ESG platform or BI tool. It is a governed environmental data foundation combined with a reporting platform that makes that data useful to executives, operations, finance, and management teams.
FAQs
Environmental reporting software helps enterprises collect, manage, analyze, and report data such as emissions, energy, water, and waste. It is commonly used to improve compliance readiness, increase leadership visibility, and replace manual spreadsheet workflows.
ESG platforms are built for governed sustainability data, auditability, and framework-aligned disclosure workflows. BI reporting tools are stronger for dashboards, cross-functional analysis, and distributing operational reports across the business.
An ESG platform is usually the better fit when your priority is controlled data collection, approvals, audit trails, and external disclosure preparation. It is especially useful for sustainability and compliance teams managing structured reporting processes.
BI tools can support environmental reporting well when the main need is dashboarding, formatted reports, and broad analytics access. However, they may need integrations or customization if you also require detailed ESG data governance and disclosure workflow management.
Key features include reliable data collection, auditability, calculation controls, dashboarding, paginated reporting, workflow support, and scheduled distribution. Enterprise buyers should also check scalability, usability for different stakeholder groups, and how well the tool fits their reporting stack.


The Author
Yida Yin
FanRuan Industry Solutions Expert
Related Articles

Best Ad Hoc Reporting Tools in 2026: Pros, Cons, Pricing, and Best Use Cases
$1 tools are designed to help business users answer specific questions on demand instead of waiting for a scheduled report or a custom build from IT. If your team needs to quickly check why sales dipped, compare regional
Yida Yin
Jul 02, 2026

Best KPI Reporting Software for 2026: 10 Tools Compared for Dashboards, Reports, and KPI Tracking
If you are searching for kpi $1 , you are likely trying to solve one of three problems: you need a better way to track business performance, you want clearer dashboards and reports for stakeholders, or you need a platfor
Yida Yin
Jun 29, 2026
12 Best KPI Reporting Tools for 2026: Compare Dashboarding, Automation, and Reporting Depth
If you are searching for the best KPI $1 , you are likely trying to solve a practical problem: how to track the metrics that matter, present them clearly, automate recurring updates, and turn performance data into decisi
Yida Yin
Jun 29, 2026