An ad hoc report is a report created on demand to answer a specific business question right now. It is valuable because it helps decision-makers move from uncertainty to action without waiting for a new scheduled dashboard, a monthly report cycle, or a custom build from IT. If you are an operations director investigating a cost spike, a sales manager explaining a sudden drop in conversions, or a finance lead validating an unexpected variance, ad hoc reporting gives you fast, focused answers from live business data.
All reports in this article are built with FineReport.
An ad hoc report is a one-time or as-needed report built to answer a precise question. Instead of reviewing a fixed set of metrics every week or month, users create the report when something new happens and they need immediate visibility.
For example, a standard sales report may show total monthly revenue by region. An ad hoc report goes further and answers a specific question such as: Why did revenue decline in the Northeast during the last 10 days for one product category?
Ad hoc report definition in simple terms
In simple terms, an ad hoc report is:
Built on demand
Focused on a specific question
Designed for immediate decision-making
Flexible in filters, dimensions, and metrics
This makes ad hoc reporting especially useful when leaders need answers that no existing dashboard currently provides.
How ad hoc reports differ from standard reports
The main difference is purpose and timing.
Report Type
Purpose
Frequency
Flexibility
Ad hoc report
Answer a new, specific question
On demand
High
Scheduled report
Track regular performance
Daily, weekly, monthly
Low to medium
Static report
Present fixed historical results
One-time snapshot
Low
A scheduled report is consistent and repeatable. An ad hoc report is exploratory and situational. A static report is often exported and shared as-is, with little interaction. By contrast, ad hoc reporting lets users filter, drill down, compare segments, and test hypotheses quickly.
Why ad hoc reports matter in fast-changing environments
In volatile business conditions, yesterday’s dashboard may not answer today’s problem. Pricing changes, campaign shifts, supply issues, customer churn, and cost anomalies create questions that were not anticipated when standard reports were designed.
That is why ad hoc reports are common in:
Sales operations
Marketing performance management
Financial variance analysis
Supply chain and logistics monitoring
Executive review meetings
When the business changes faster than the reporting cycle, ad hoc reporting fills the gap.
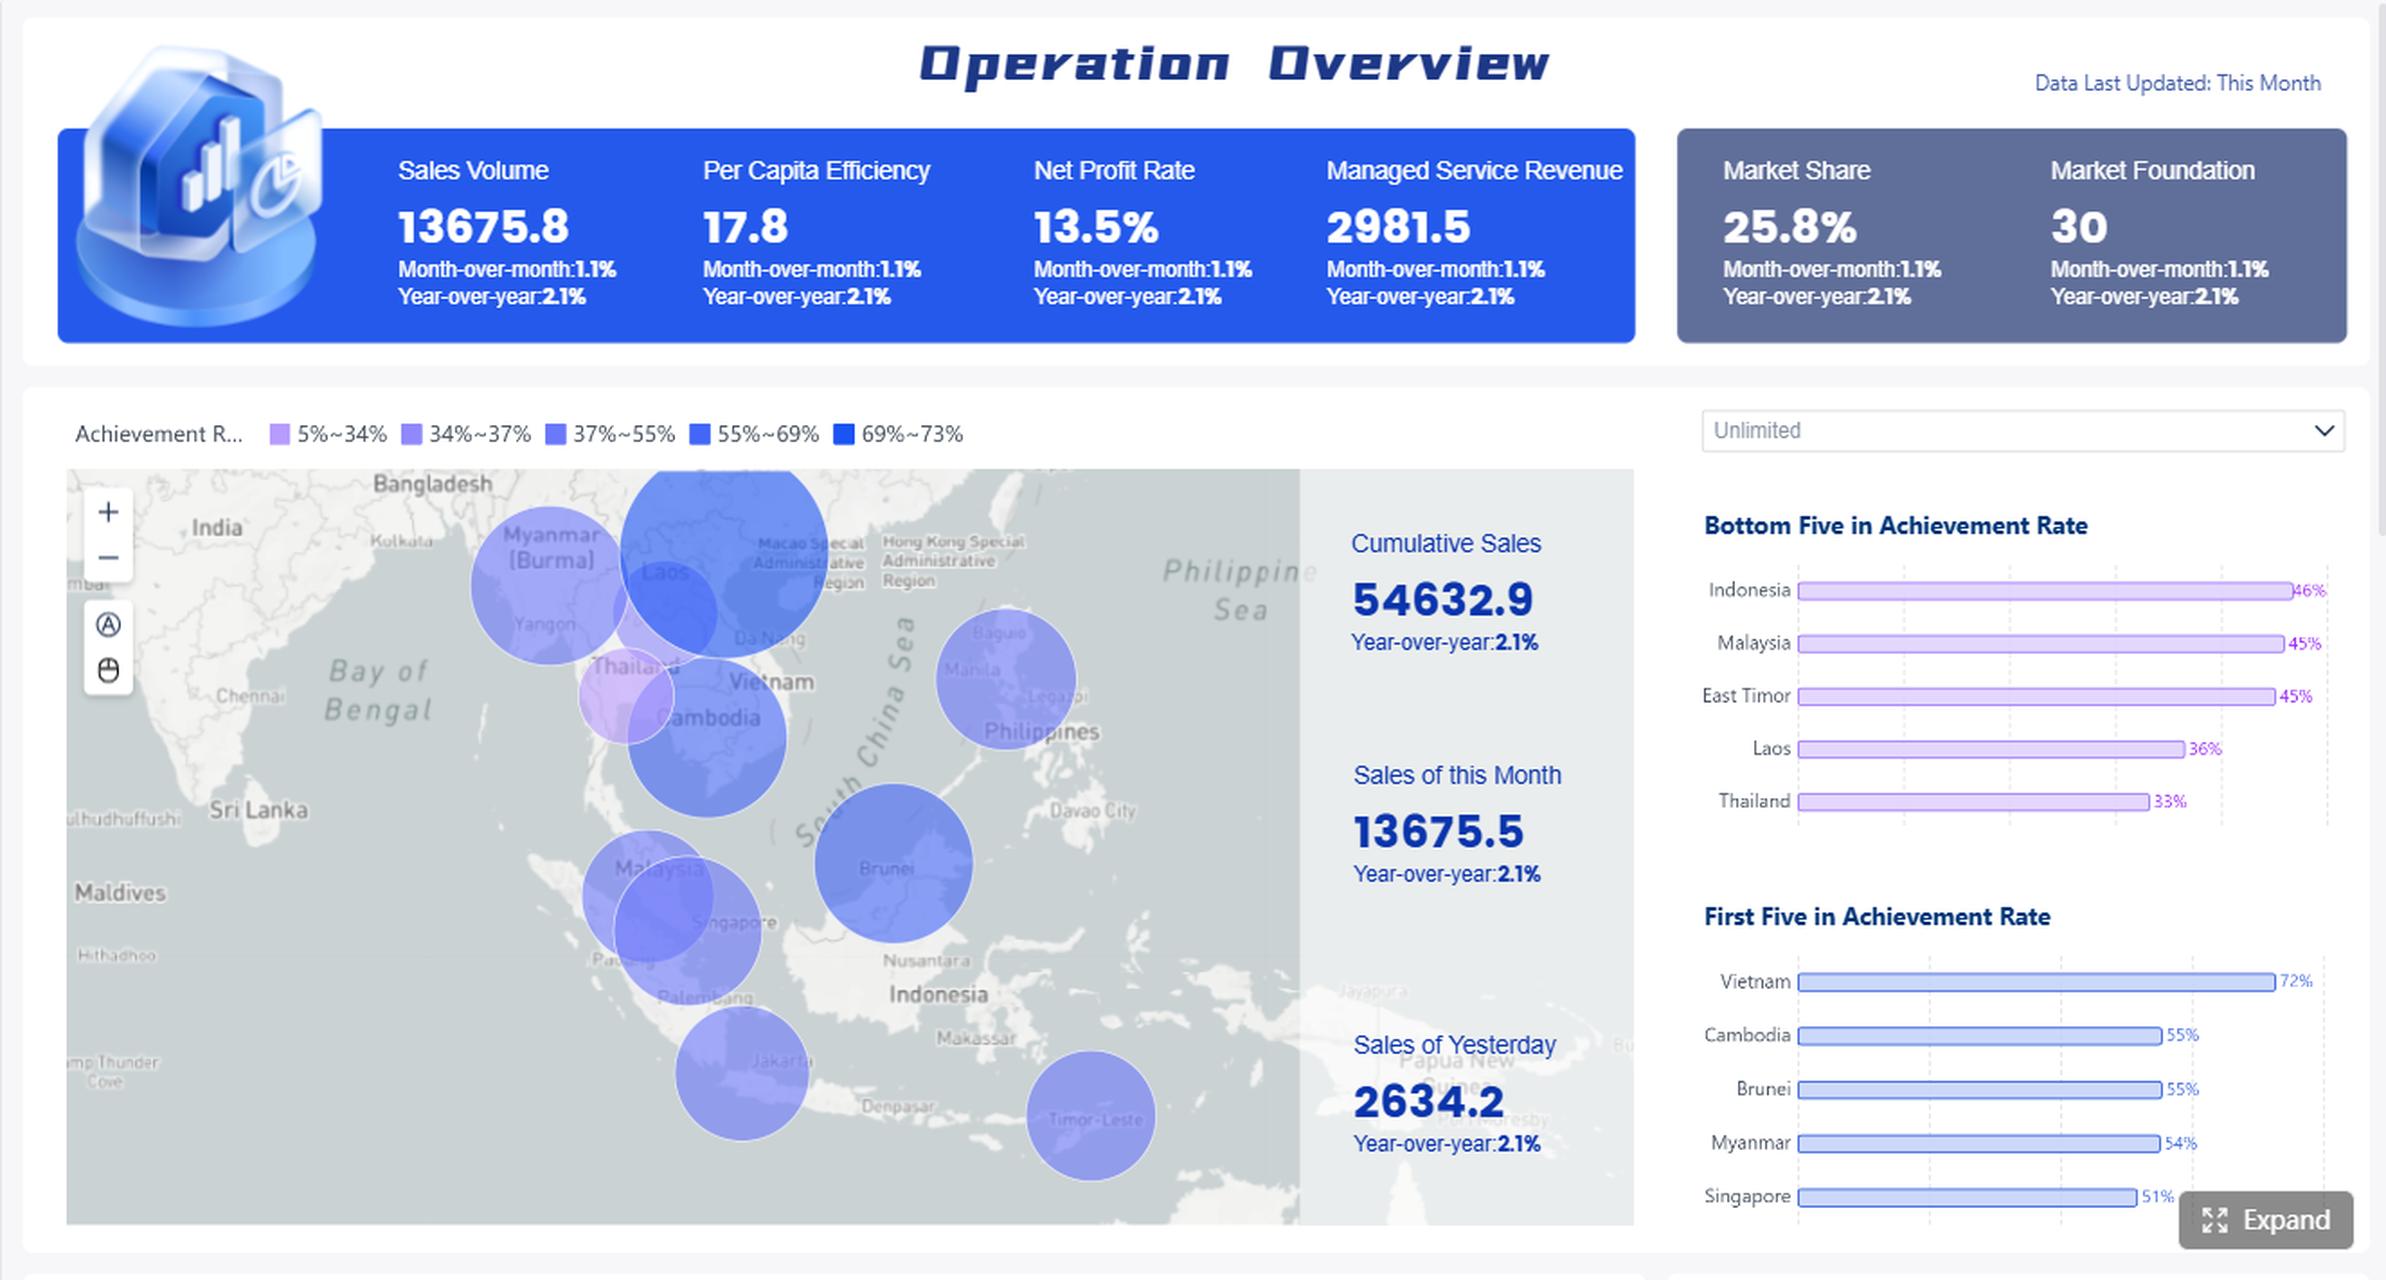
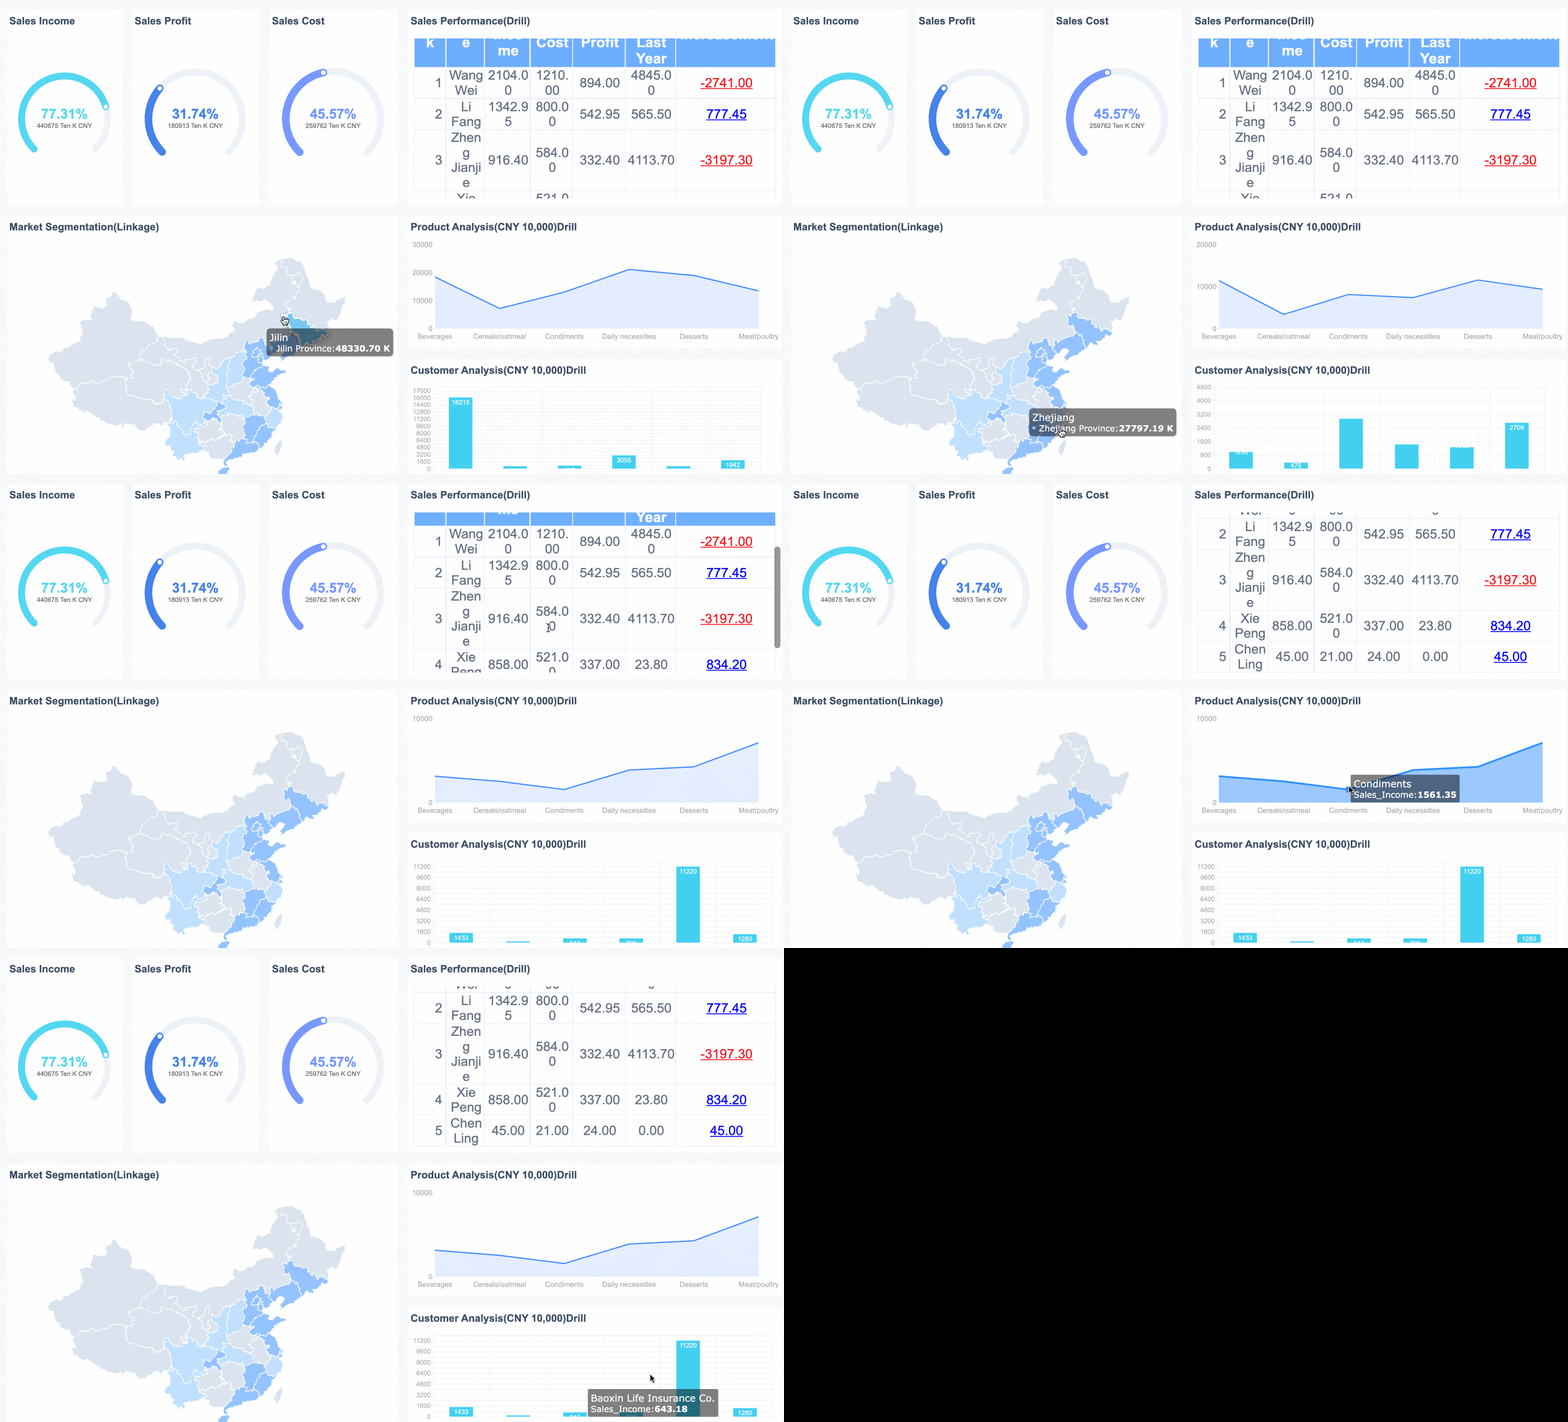
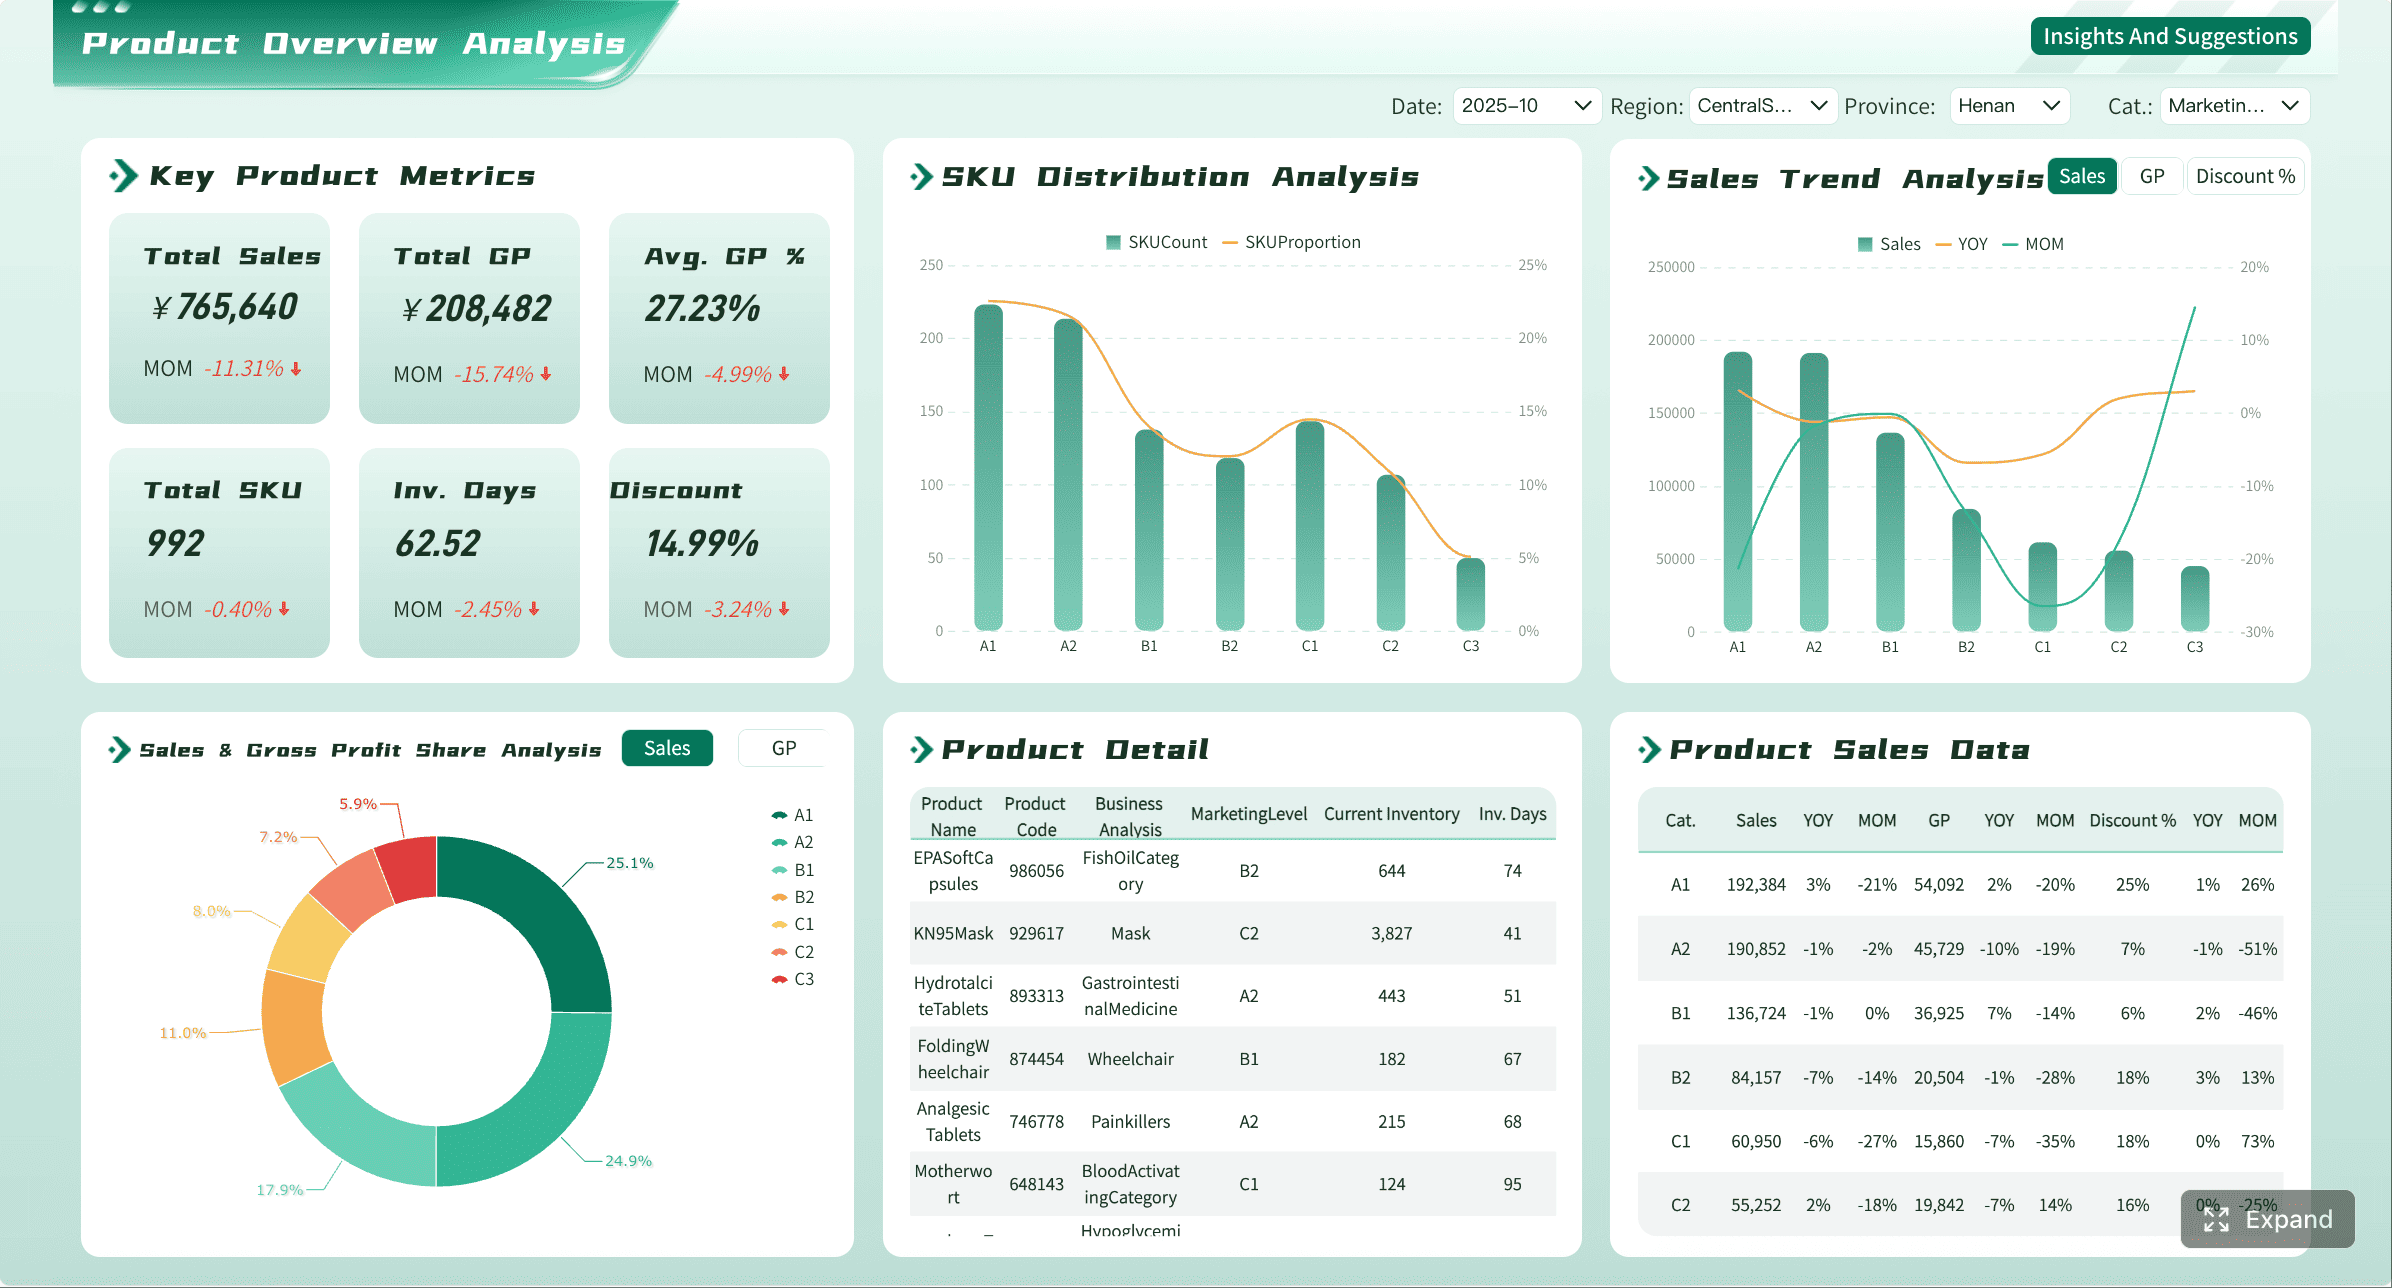
An Interactive Report
How an Ad Hoc Report Works
An ad hoc report usually begins with a business question, not with a template. The user starts with a problem, identifies relevant data, applies filters or comparisons, and shares the result with the people who need to act.
Start with a clear question
Example: Why did delivery delays increase last week?
Identify the right data sources
This may include ERP, CRM, marketing platforms, financial systems, or warehouse records.
Select the key metrics and dimensions
For example, delivery time, supplier, warehouse, route, customer segment, or date.
Filter and segment the data
Slice the data by time period, region, product, department, or campaign.
Compare patterns and outliers
Look for unusual changes, underperforming groups, or root causes.
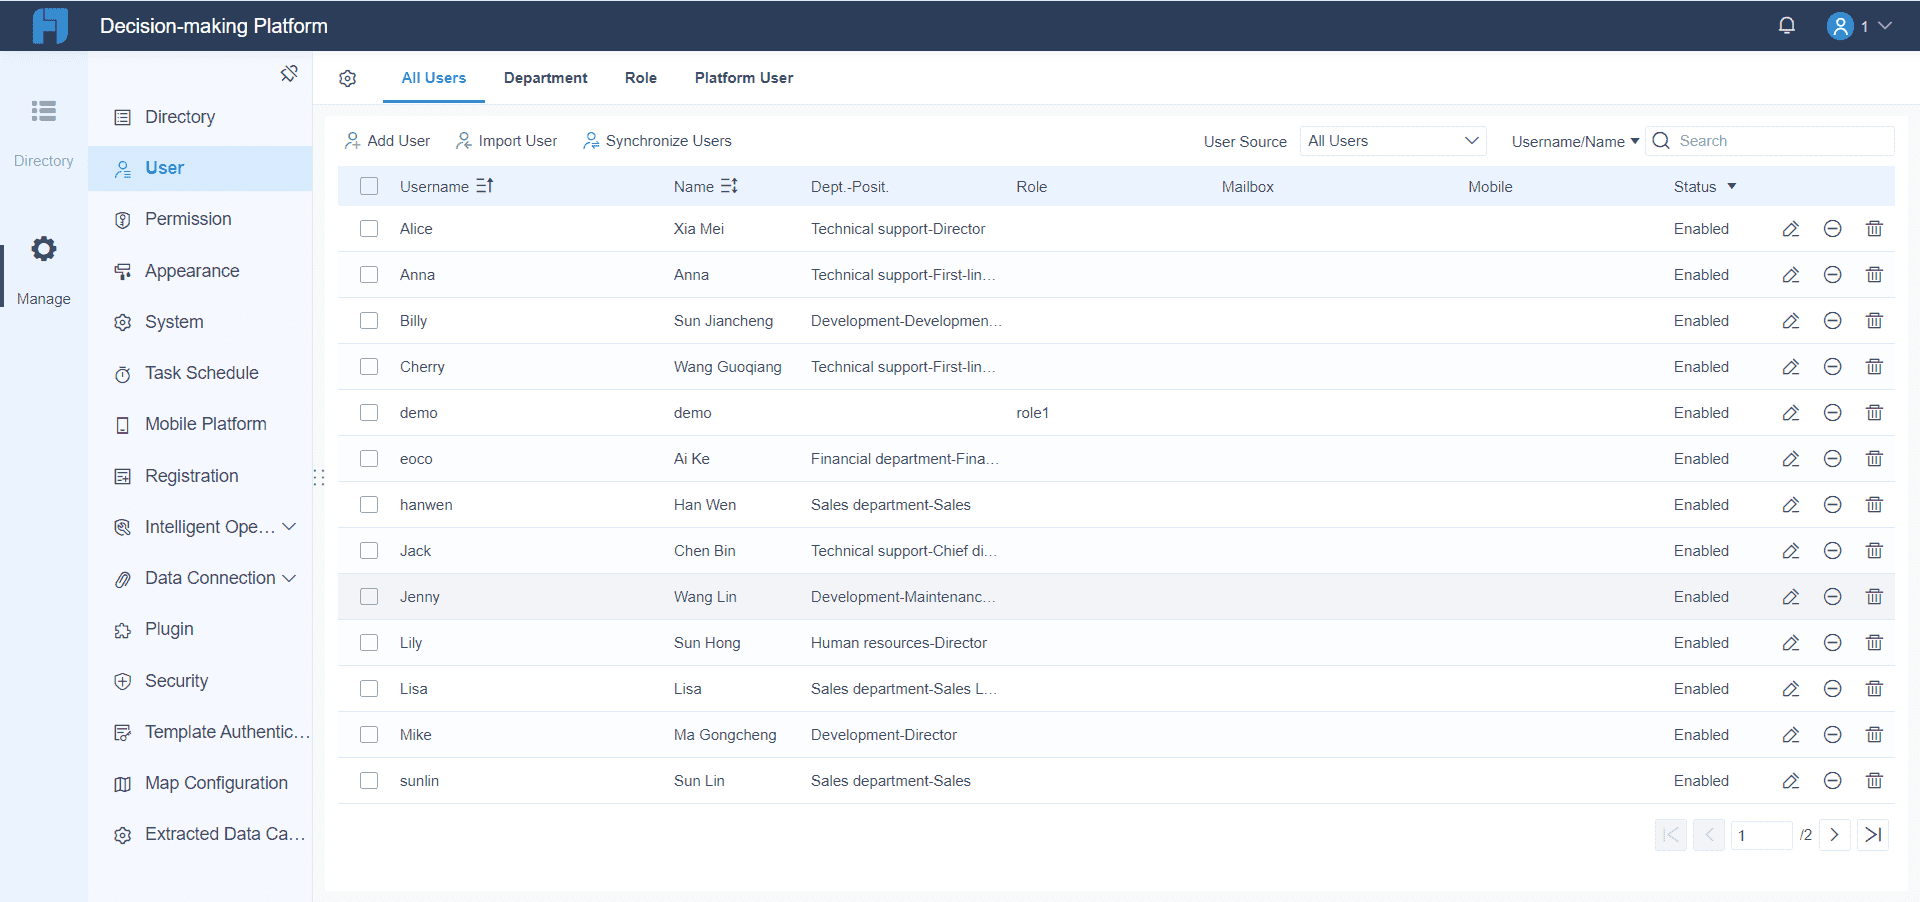
Share findings fast
Deliver the report to managers, analysts, or executives for immediate action.
Share findings fast
This process is why ad hoc reports are often paired with modern BI tools. The goal is speed without losing trust in the numbers.
Key Metrics (KPIs) commonly used in an ad hoc report
The exact KPI set depends on the use case, but most ad hoc reports rely on a focused group of metrics tied to the question at hand.
Revenue: Total income generated in a selected time period or segment.
Conversion Rate: Percentage of leads, visits, or opportunities that became customers.
Average Order Value (AOV): Average spend per transaction.
Customer Acquisition Cost (CAC): Cost to acquire a new customer from a campaign or channel.
Churn Rate: Percentage of customers lost during a specific period.
Gross Margin: Revenue minus direct costs, expressed as value or percentage.
On-Time Delivery Rate: Share of deliveries completed within the promised timeframe.
Cost Variance: Difference between expected and actual costs.
Lead Quality Score: Indicator of how likely a lead is to convert based on predefined criteria.
Inventory Turnover: How quickly inventory is sold and replaced over a period.
Core elements every strong ad hoc report should include
For enterprise teams, a useful ad hoc report is not just fast. It is structured and defensible.
Business question: The exact issue being investigated
Metric definition: Clear formula for each KPI
Trusted data source: Governed, current, and permission-controlled
Dimensions for analysis: Region, product, campaign, customer, supplier, time
Filters and drill-downs: So users can isolate causes quickly
Context notes: Assumptions, exclusions, and date ranges
Shareable format: Dashboard, export, or embedded report for stakeholders
Who uses ad hoc reporting and analysis
Ad hoc reporting is widely used across departments because business questions rarely wait for a reporting backlog.
Common users include:
Analysts who investigate anomalies and validate hypotheses
Sales managers who need to explain pipeline or territory performance
Marketing teams who compare campaign outcomes by audience or channel
Finance teams who review budget variances or cost spikes
Operations managers who monitor delays, fulfillment issues, or resource bottlenecks
Executives who ask follow-up questions during reviews and need instant answers
The connection between ad hoc reporting and ad hoc analysis
These two terms are related but not identical.
Ad hoc reporting focuses on producing a report to answer a question.
Ad hoc analysis is the deeper investigative process behind that report.
In practice, teams often perform ad hoc analysis first, then package the findings into an ad hoc report for broader sharing. Analysis finds the insight. The report communicates it.
Benefits of Ad Hoc Report
The biggest advantage of an ad hoc report is that it helps teams get answers without waiting for a predefined reporting process to catch up. That speed has direct business value.
1. Faster decisions
When something unexpected happens, leaders need immediate clarity. Ad hoc reporting shortens the gap between question and answer, which reduces hesitation and improves response time.
Examples include:
Explaining a revenue dip before the weekly sales review
Diagnosing campaign underperformance before budget is reallocated
Investigating cost spikes before they affect monthly close
2. Greater flexibility
Unlike a fixed report, an ad hoc report can be adjusted on the fly. Users can add filters, compare time windows, drill into segments, and test multiple views of the same issue.
This flexibility is critical when the first question leads to a second or third question.
With self-service BI and modern reporting tools, business users no longer need to depend entirely on IT or data teams for every one-off request. That reduces delays and frees technical teams to focus on higher-value data engineering and governance work.
4. Better problem-solving
Ad hoc reports are ideal for root-cause analysis. They help teams move beyond surface symptoms and find what actually changed.
For example:
Was the conversion drop driven by one region or all regions?
Did churn increase among new users or long-term accounts?
Were delivery delays tied to one supplier or one route?
5. Stronger opportunity spotting
Ad hoc reports are not only defensive tools. They also reveal upside.
Teams can use them to identify:
High-performing customer segments
Underpriced products with strong demand
Channels generating better lead quality than expected
Departments outperforming cost targets
Potential limitations to watch
Ad hoc reporting is powerful, but it is not risk-free. Common issues include:
Inconsistent metric definitions across departments
Poor data quality or outdated source systems
Overreliance on one-off queries without standardizing recurring insights
Lack of context when reports are shared without assumptions or filters explained
Permission gaps that expose sensitive data to the wrong users
This is why governed self-service reporting matters. Enterprise teams need flexibility, but they also need consistency, auditability, and control.
Examples of an Ad Hoc Report in Practice
The best way to understand an ad hoc report is to see where it solves real business problems.
Sales and revenue examples
Sales leaders use ad hoc reporting when the standard dashboard shows that something changed, but not why.
Investigate a sudden drop in conversions
Imagine conversion rates fall sharply in one week. A sales operations manager creates an ad hoc report to compare:
Region
Product line
Campaign source
Sales rep
Time period before and after the drop
The report reveals that one regional campaign drove low-intent traffic, which lowered overall conversion quality.
Compare weekly sales after a pricing change
A company increases prices on a key product line. Leadership wants to know whether the change impacted volume, average order value, and margin.
An ad hoc report compares:
Weekly units sold
Revenue before and after pricing
Margin by product category
Customer response by segment
This helps management decide whether to keep, adjust, or reverse the pricing strategy.
Marketing and customer examples
Marketing teams use ad hoc reports to validate channel performance, campaign quality, and customer behavior shifts.
Identify the highest-quality lead source
A marketing director wants to know which channel generated the highest-quality leads in the last 30 days. A simple top-of-funnel report is not enough. The team needs to compare lead volume with downstream conversion and revenue.
The ad hoc report includes:
Leads by channel
MQL to SQL conversion
Opportunity creation rate
Closed-won revenue
CAC by channel
The result may show that the cheapest channel delivered the weakest quality, while a smaller channel produced stronger pipeline efficiency.
Examine churn signals for a new segment
A new customer segment shows a higher cancellation rate after launch. The team creates an ad hoc report to examine:
Time to first value
Product usage patterns
Support tickets
Plan type
Onboarding completion
This allows customer success and product teams to isolate the churn drivers and improve retention.
Operations and finance examples
Operations and finance teams often rely on ad hoc reporting to manage exceptions, delays, and financial anomalies.
Review delivery delays by supplier, warehouse, or route
An operations manager sees on-time delivery rates decline. A standard logistics dashboard shows the drop, but not the operational cause.
An ad hoc report breaks down delays by:
Supplier
Warehouse
Route
Carrier
Order priority
Day of week
The findings may reveal that a single supplier and route combination is creating most of the problem.
Analyze unexpected cost spikes
A finance team notices an unusual increase in departmental expenses. To explain the variance, they build an ad hoc report segmented by:
Department
Project
Vendor
Contract type
Month-over-month change
Budget versus actuals
This quickly identifies whether the issue is a one-time invoice, scope expansion, or poor purchasing control.
Best Use Cases for Ad Hoc Report
Not every reporting need should be handled through ad hoc reporting. The key is knowing when it is the right tool.
Use ad hoc reports when a new question appears
An ad hoc report is the best fit when no current dashboard or recurring report can answer the question. This usually happens when:
A new business event occurs
Leadership asks a one-time follow-up question
A metric changes unexpectedly
A team needs fast root-cause visibility
Ideal scenarios for ad hoc reporting
Ad hoc reports are especially effective for:
Root-cause analysis: Explain why a KPI moved
Performance checks: Validate the impact of a change or initiative
Anomaly investigation: Explore sudden spikes, dips, or outliers
Executive follow-up questions: Provide quick evidence during reviews
Segment analysis: Compare products, regions, channels, or customer groups
Operational troubleshooting: Identify bottlenecks or failure points
When ad hoc reporting is better than a standard report
Choose an ad hoc report when:
The question is new or unexpected
The answer requires drill-down or multiple filters
The audience needs speed over formatted regularity
The report must be tailored to a specific decision
Historical trend monitoring matters more than one-off exploration
When an ad hoc report should become a recurring report
A smart reporting team watches for repetition. If the same ad hoc question appears again and again, it should probably become a dashboard, template, or scheduled report.
This is a simple maturity model:
One-time question → ad hoc report
Repeated team question → reusable template
Critical business KPI → standardized dashboard or scheduled report
Tools and Best Practices for a Better Ad Hoc Report
The quality of an ad hoc report depends on both the tool and the process behind it.
Common tools teams use
Different teams use different technologies depending on data maturity and reporting complexity.
BI platforms
Business intelligence platforms are the most scalable option for ad hoc reporting. They allow users to connect live data, apply filters, build visuals, and share reports with governance in place.
This is where platforms like FineReport are especially useful for enterprises that need both self-service flexibility and production-grade reporting. Teams can build ad hoc reports quickly, then convert valuable recurring analyses into formal dashboards and managed reporting assets.
Spreadsheets are still common for lightweight ad hoc analysis, especially for small teams. They are flexible but less reliable at scale because they are prone to version control issues, manual errors, and disconnected data.
SQL queries
For technical analysts, SQL remains a powerful method for pulling precise datasets quickly. However, SQL alone is not ideal for broad business self-service unless paired with a reporting interface.
Reporting tools and embedded analytics solutions
Many organizations use dedicated reporting tools that support operational reports, print-ready formats, dashboards, and self-service views in one environment. This is often the best choice when different business units need both exploration and formalized reporting.
What to look for in an ad hoc reporting tool
Enterprise buyers should evaluate tools based on these core criteria:
Usability: Can business users build reports without heavy technical support?
Data access: Can the tool connect to required systems and sources?
Visualization: Does it support charts, tables, drill-downs, and parameter controls?
Governance: Can you standardize metrics and control access by role?
Performance: Does it handle large datasets without slowing down decision-making?
Scalability: Can one-off reports evolve into enterprise dashboards and reusable templates?
Best practices to keep your ad hoc report accurate and useful
Here is the practical consultant view: most reporting problems are not caused by the chart type. They are caused by unclear questions, inconsistent metrics, and weak data discipline.
1. Start with one clear question
Before building the report, write the question in one sentence. If the question is vague, the report will be cluttered.
Good example: Why did customer churn increase among newly onboarded accounts in Q2?
Weak example: What is happening with customers lately?
2. Define the metric before you visualize it
Agree on what each KPI means. For example, if two teams define churn differently, your ad hoc report will create confusion instead of clarity.
Make sure the report states:
Metric definition
Time period
Included and excluded data
Comparison baseline
3. Use trusted data sources
Do not build an urgent report on unvalidated data. Fast decisions based on bad numbers are worse than slower decisions based on trusted numbers.
Prioritize:
Governed datasets
Certified metrics
Permission-controlled access
Consistent joins and business rules
4. Keep the report focused
An ad hoc report is not a data dump. It should answer the question directly and avoid unnecessary tabs, visuals, or vanity metrics.
A strong ad hoc report usually has:
3 to 7 relevant KPIs
One or two comparison views
A clear breakdown by dimension
A short summary of findings
5. Document assumptions and context
Always include context when sharing the report. If stakeholders do not know the date range, filters, or exclusions, they may interpret the numbers incorrectly.
6. Convert repeat questions into templates
If the same request comes up regularly, stop rebuilding it from scratch. Save it as a template or dashboard so the business gets faster and more consistent answers over time.
How to Implement your Ad Hoc Report Effectively
If you want ad hoc reporting to work across the business, treat it as a capability, not just a feature.
Step 1: Standardize core metrics first
Before enabling broad self-service, define the KPIs that matter most across departments. Revenue, churn, margin, pipeline, cost variance, and on-time delivery should all have shared definitions.
Step 2: Connect the right data sources
Unify data from CRM, ERP, finance, operations, and marketing systems. The faster users can access trusted data, the more effective ad hoc reporting becomes.
Step 3: Enable governed self-service
Give business users flexibility, but within guardrails. They should be able to filter, slice, and create views without changing source logic or exposing restricted information.
Step 4: Train users on thinking, not just clicking
The most valuable training is not only how to use the tool. It is how to ask better business questions, choose the right dimensions, and avoid false conclusions.
Step 5: Operationalize repeated insight
When one-off reports repeatedly drive decisions, formalize them. That is how analytics maturity grows: ad hoc exploration evolves into standardized intelligence.
After the best practices and implementation framework, many teams realize they need a platform that supports both fast self-service and enterprise reporting control.
For enterprise decision-makers, ad hoc reporting is only useful if it balances speed, governance, usability, and scalability. FineReport is well suited to that requirement because it supports both self-service exploration and formal enterprise reporting in one environment.
Turn repeat ad hoc reports into reusable dashboards or templates
Share findings across the organization with production-ready output
This matters because many organizations struggle with fragmented reporting stacks. One tool handles dashboards, another handles exports, and another handles fixed reports. That creates friction. A unified reporting platform reduces that complexity.
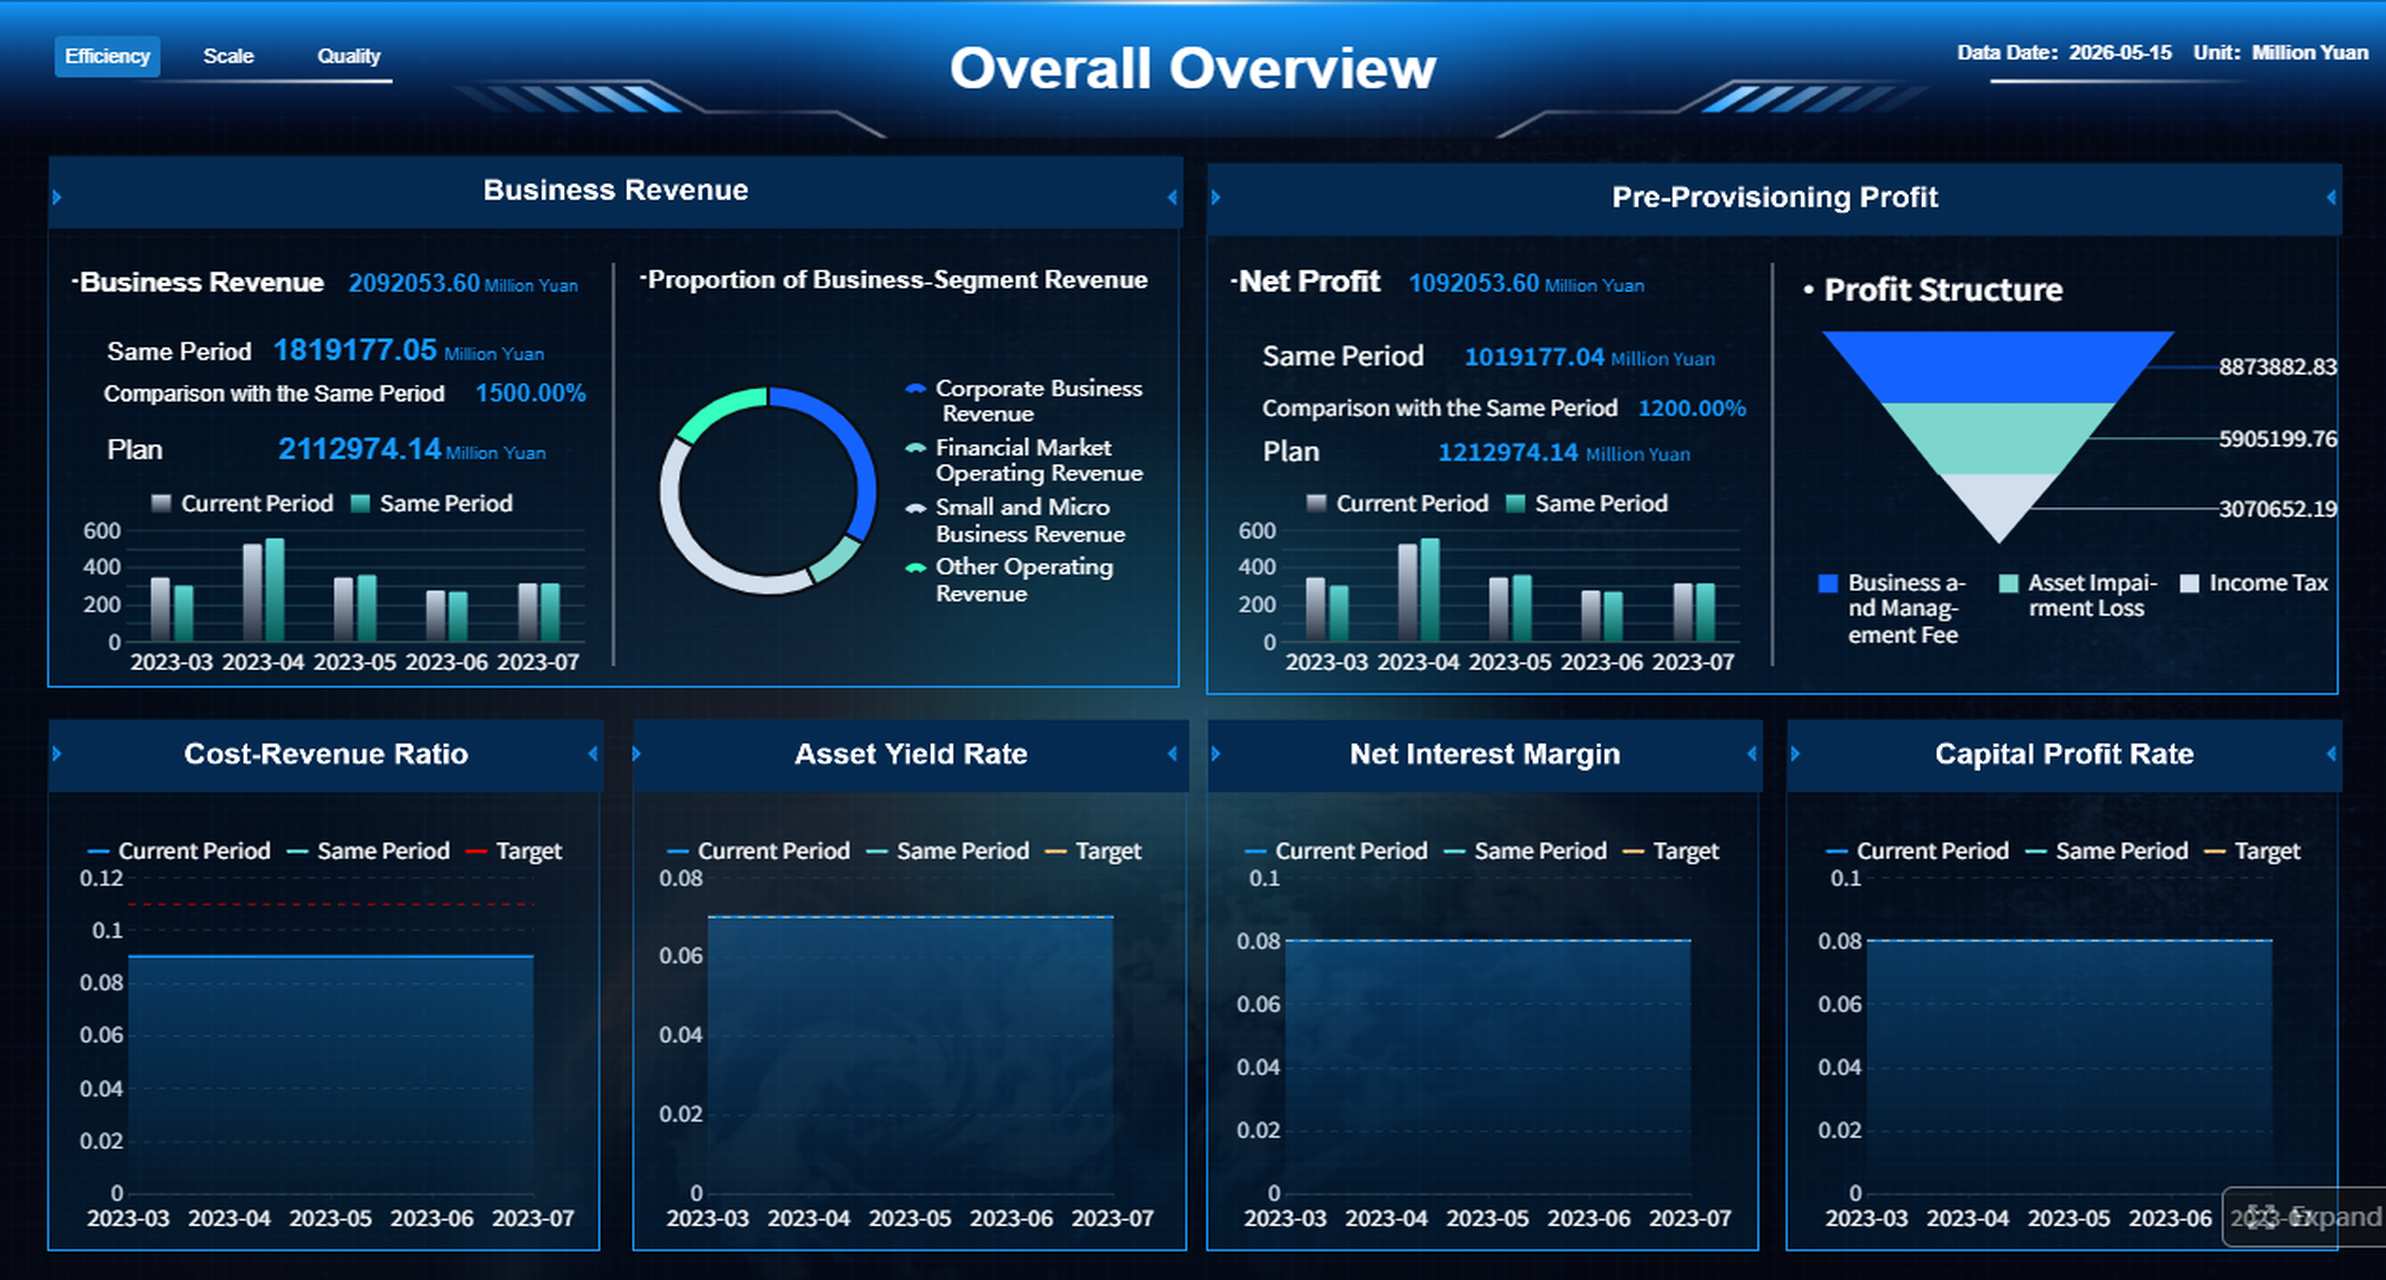
Get Ready-to-Use Dashboard Templates in Fine Gallery
Final Thoughts
An ad hoc report is one of the most practical tools in modern business intelligence. It answers a specific question on demand, helps teams investigate problems quickly, and supports faster, more confident decisions. It is especially valuable when the business changes faster than predefined reports can keep up.
The most effective organizations do not treat ad hoc reporting as random report building. They support it with trusted data, clear KPI definitions, self-service controls, and a process for turning repeated questions into standardized reporting assets.
If your team needs faster answers without sacrificing reporting quality, now is the right time to modernize how ad hoc reports are built and shared.
An ad hoc report is a report created on demand to answer a specific business question right away. Unlike recurring reports, it is built for a current issue, anomaly, or decision.
A standard report follows a fixed format and schedule, while an ad hoc report is flexible and created as needed. Ad hoc reporting is better for exploring unexpected changes, root causes, and one-off questions.
Businesses should use ad hoc reporting when existing dashboards do not explain a sudden change or urgent problem. It is especially useful for investigating revenue drops, cost spikes, churn, delivery delays, or campaign performance shifts.
Ad hoc reports help teams get faster answers, reduce dependence on IT, and make more timely decisions. They also make it easier to drill into live data and test different hypotheses quickly.
A strong ad hoc report starts with a clear business question and uses trusted, well-defined data. It should also include the right filters, dimensions, and metrics so users can quickly find the cause behind the issue.
Product Trial
FineReport
Pixel-perfect reports · Interactive dashboards · Easy data entry · Digital twins


 An Interactive Report
 Share findings fast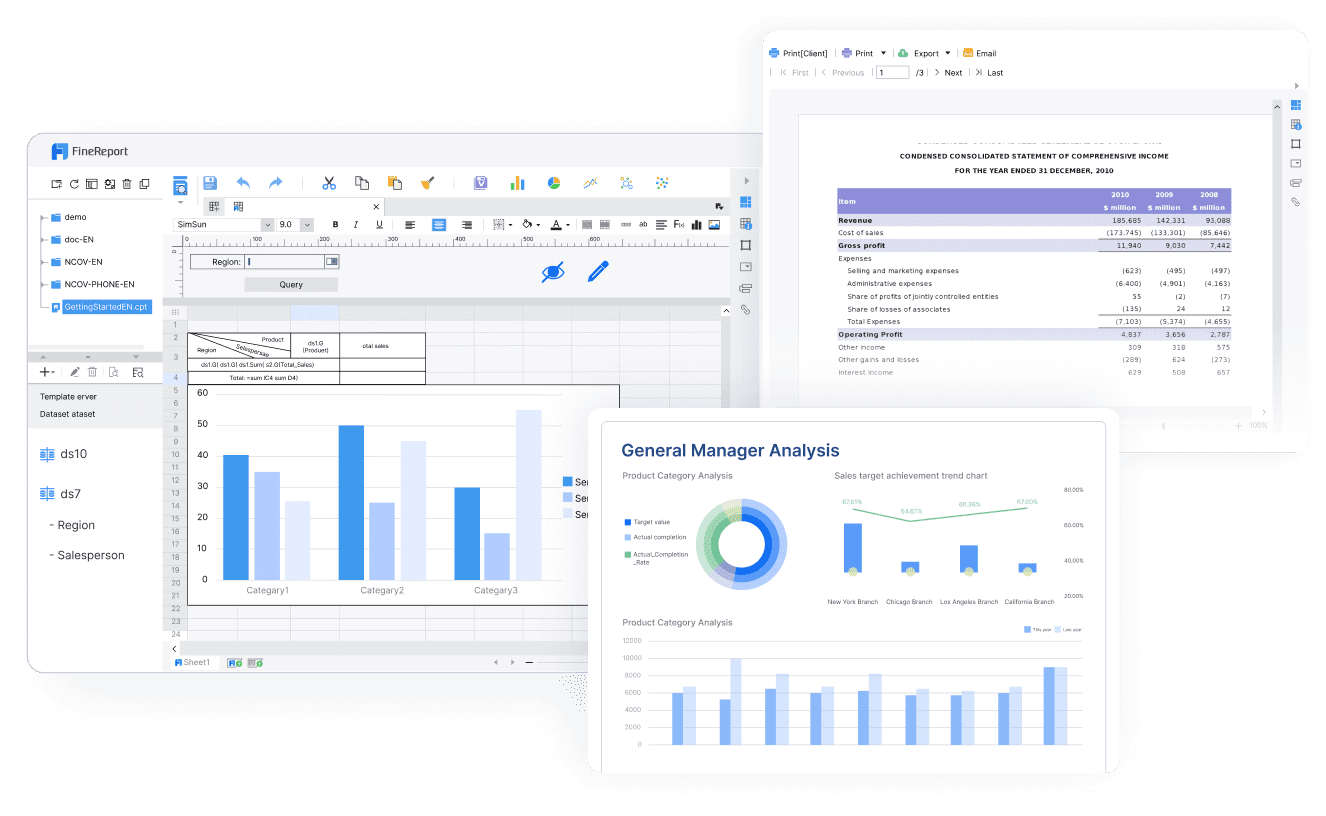
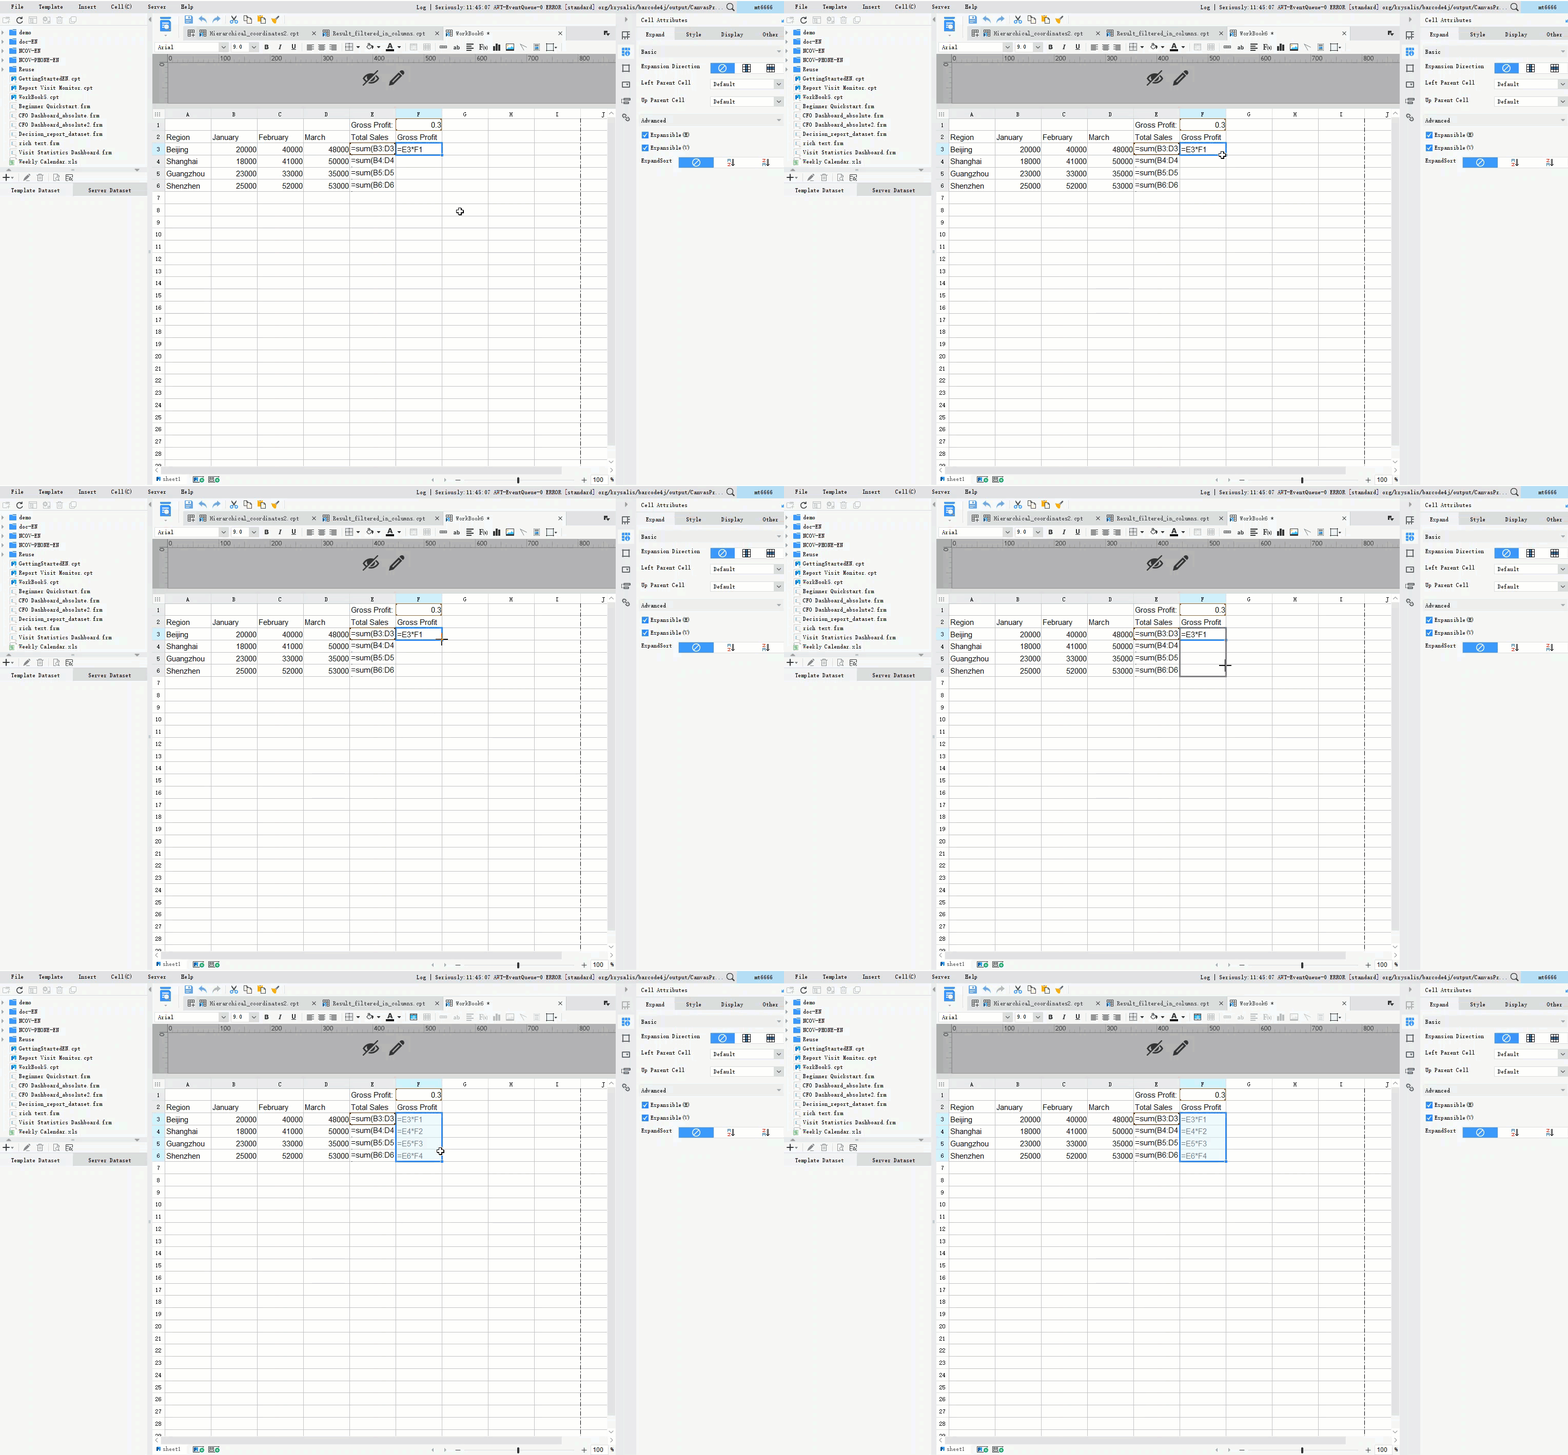 Drag-and-drop report building







