Data analysis tools news refers to the latest updates, trends, and innovations in the software and platforms that help you collect, process, and interpret data. These updates can include new features, integrations, or improvements that make your work more efficient. Industry reports highlight major changes among leading tools:
Tool
Key Features
Innovations Driving Use
Microsoft Power BI
Custom visualizations, mobile app
Azure integration, Excel user accessibility
Klipfolio
Real-time metrics, integrations
Dynamic reports, enhanced visualizations
SAP
Predictive analytics, drag-and-drop
Seamless integration with top data tools
Sisense
AI-assisted analytics, large data
No-code and pro-code options
ThoughtSpot
Natural language, real-time
Intuitive interface, diverse data sources
You see rapid adoption of AI, automation, and self-service BI. Over 90% of businesses now use AI solutions to stay competitive. The market for data pipeline tools alone is projected to grow from $12.09B in 2023 to $48.33B by 2030.
Staying current with data analysis tools news gives you a clear advantage as technology evolves.
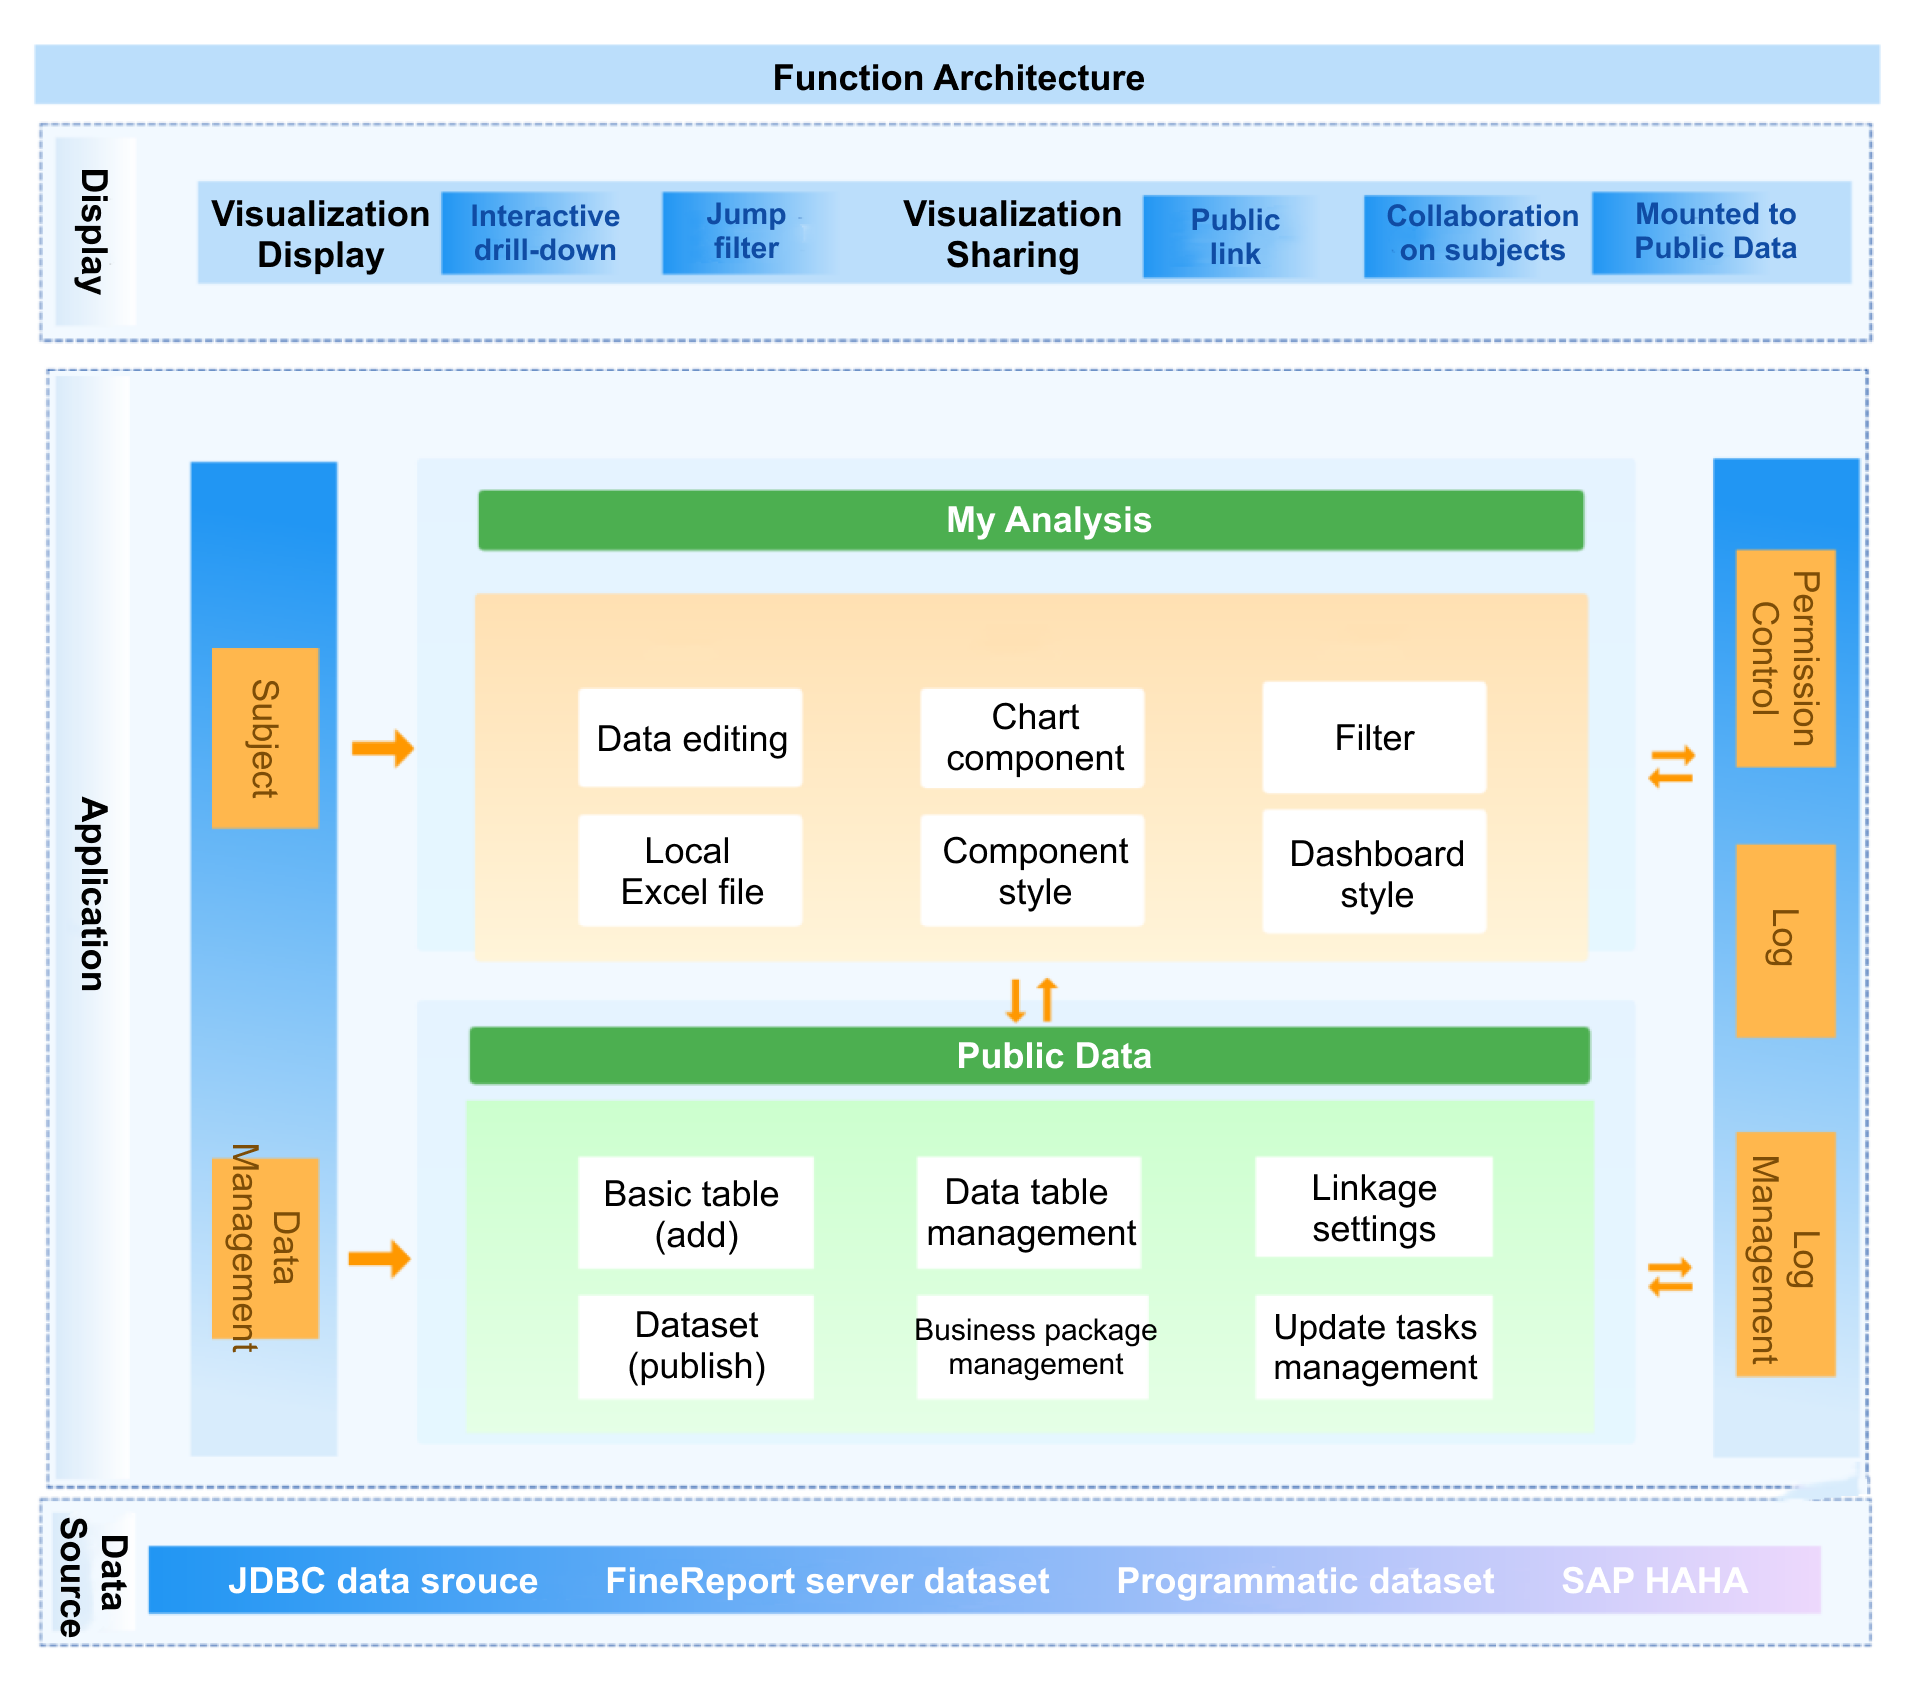
FineBIemerges as a standout in data analysis tools news, especially for organizations seeking self-service analytics and AI-driven insights. FineBI’s workflow covers four key stages: data integration, data processing, visual exploration, and publishing with governance. You can connect to over 60 data sources, including traditional databases, cloud data warehouses, and big data platforms. FineBI’s flexible integration options, such as JDBC/ODBC support and SDK integration, ensure compatibility with diverse systems.
FineBI’s latest updates include smoother scrolling, optimized component interactions, and enhanced data validation features. You can insert icons into KPI cards, display conversion rates in funnel charts, and adjust component layouts for better dashboard design. The field tracing function helps you quickly locate data sources, while user data management improves data handling efficiency.
FineBI empowers you to create self-service data sets, join tables, add calculated fields, and apply filters without coding. The drag-and-drop dashboard builder lets you visualize data interactively, with real-time filtering and responsive design across devices. FineBI’s AI-driven features, such as conversational analytics with FineChatBI, allow you to ask questions in plain language and receive instant insights.
The real-world impact of FineBI is evident in the BOE customer story. BOE Technology Group used FineBI to address data fragmentation and inconsistent metric definitions. By building a unified data warehouse and standardizing metrics, BOE reduced inventory costs by 5% and increased operational efficiency by 50%. FineBI enabled BOE to create KPI dashboards and cross-factory benchmarking, supporting data-driven decision-making and accelerating digital transformation.
FineBI’s combination of self-service analytics, AI-powered insights, and enterprise-grade governance makes it a leading choice among data analysis tools for organizations aiming to maximize the value of big data analytics.
You will find that Tableau leads the way indata analysis tools news with its advanced real-time collaboration features. Tableau now offers system event notifications, which alert you to important sharing and collaboration events. This keeps your team engaged and ensures everyone stays updated. You can manage access to analytics assets more easily, controlling who can view or edit your dashboards. Tableau’s integration with Slack allows you to share live analytics directly in team channels, making collaboration seamless.
Tableau also introduces several productivity enhancements. Tableau Accelerators provide ready-to-use dashboards that you can customize for faster insights. Data Stories summarize key findings, saving you time. Explain Data helps you uncover relationships in your data, while Tableau Pulse delivers real-time updates and a new mobile homepage for quick access to metrics. Actionable Insights let you configure actions on visualizations, speeding up your decision-making process. These updates make Tableau a top choice among data analysis tools for teams that value collaboration and efficiency.
Power BI stands out in data analysis tools news with itscloud automation enhancements. You can now describe your needs, and AI agents will generate components, reducing development time. Built-in agents automate repetitive tasks such as data entry and summarization, freeing you to focus on strategic work. The collaboration between humans and AI ensures that solutions are supervised and refined in real time, improving accuracy and efficiency.
Power BI’s Plan Designer supports scalable automation, allowing you to integrate solutions with existing systems. Business users can design solutions without coding, using natural language and visual guidance. Power BI automates data collection and reporting, saving time and reducing errors. Real-time data refresh gives you immediate access to insights, which speeds up your decision-making. Easy dashboard sharing fosters teamwork, and tracking KPIs helps you identify process inefficiencies. Power BI empowers frontline employees by providing real-time data access, boosting productivity and engagement. These features keep Power BI at the forefront of data analysis tools for cloud-driven organizations.
Qlik Sense continues to make headlines in data analysis tools news with its focus on augmented analytics. You benefit from decision intelligence features, including real-time KPI alerts and automated insights. Embedded analytics and decision support at the point of action help you make informed choices quickly. Qlik Sense’s AI-powered analytics include AutoML, predictive analytics, and natural language processing. Updates like Agentic AI and GenAI Connectors enhance your ability to analyze complex data.
Qlik Sense also improves data integration and governance. Real-time data streaming and ETL automation streamline your workflows. The introduction of Qlik Open Lakehouse provides AI-ready data, supporting your big data analytics needs. These features make Qlik Sense a strong option for organizations seeking advanced analytics and robust data governance.
Looker’s latest updates in data analysis tools news focus on embedded data modeling. The API-first design enables seamless integration with other applications and services. AI-powered analytics enhance your data interaction through natural language and automated insights. Semantic modeling with LookML lets you define business logic consistently across dashboards, ensuring everyone in your organization works with the same definitions.
Looker’s enhanced security features include row-level data access and integration with Google Cloud IAM, improving data security. Organizations use Looker to embed analytics, dashboards, and reports directly into their applications, supporting real-time insights and promoting a data-driven culture. The centralized semantic modeling layer democratizes data access, making it easier for both technical and non-technical users to explore data and extract actionable insights. Looker’s intuitive UI and API integration make it a versatile tool for big data analytics.
SAS Viya makes a significant impact in data analysis tools news with its advancements in cloud machine learning. The platform introduces AI agents with customizable interaction, allowing you to combine deterministic analytics with large language models. This hybrid approach ensures precise outcomes while maintaining necessary business guardrails.
You can balance human and AI involvement based on task complexity. AI can operate autonomously for routine tasks, while humans provide oversight for strategic decisions. Built-in governance ensures that AI agents deliver accurate outcomes, adhere to ethical standards, and comply with regulations. SAS Viya enables you to build or purchase AI solutions, accelerating productivity and decision-making. Studies show that SAS Viya allows users to complete the AI life cycle 4.6 times faster than competitors, driving innovation and revenue growth. These features make SAS Viya a leader in big data analytics for organizations seeking advanced machine learning capabilities.
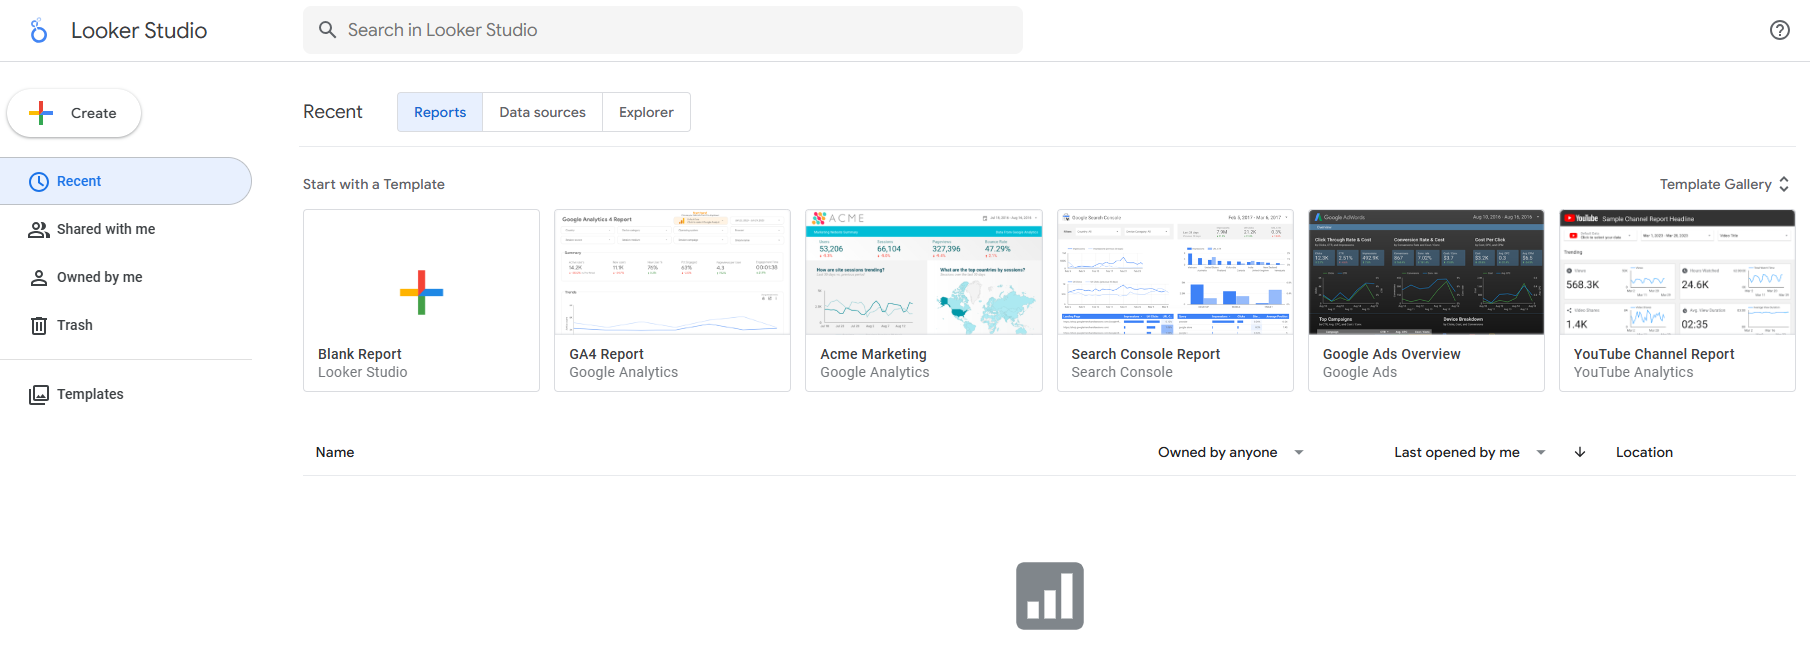
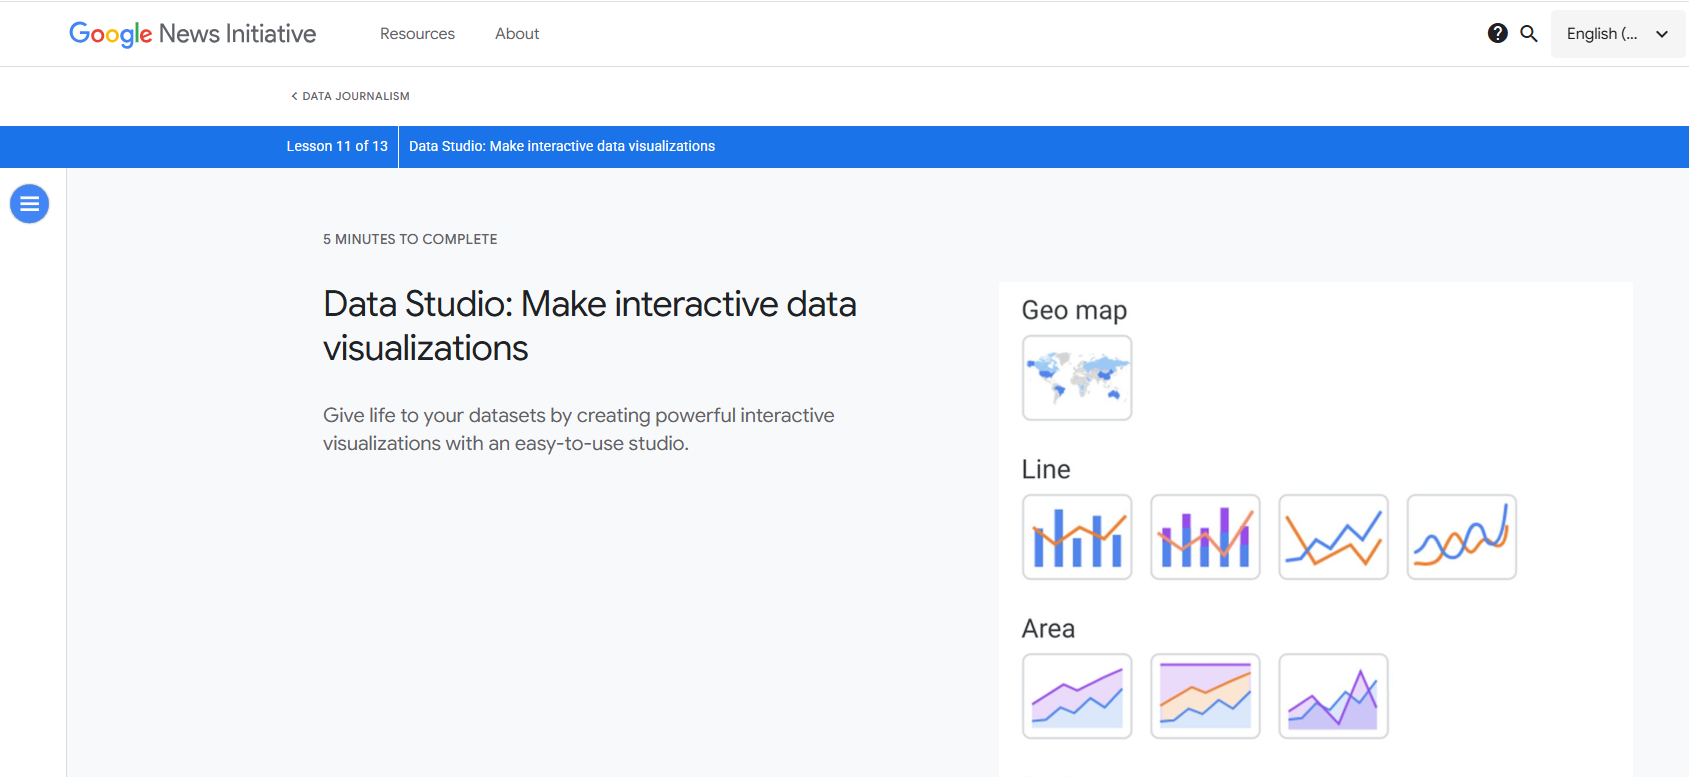
Google Data Studio, now known as Looker Studio, features prominently in data analysis tools news with its enhanced data blending capabilities. You can combine data from multiple sources, such as Google Analytics and Google Ads, to create comprehensive reports. This unified view helps you make better decisions by analyzing sales figures alongside customer demographics.
Looker Studio supports five join operators, including inner, outer, left, right, and cross joins. You need at least one common dimension or join key between data sources to blend data effectively. The choice of join operator affects the results displayed in your blended tables. Advanced filtering options let you search through filter options, making it easier to select specific data segments. Single-select filters reduce confusion, and combo charts allow for more flexible data visualization. Clickable links in tables add interactivity, giving you access to external content directly from your reports. These features support your big data analytics efforts by making multi-source analysis more accessible.
Domo continues to innovate in data analysis tools news with its unified data app capabilities. Enhanced cloud integration with BigQuery focuses on democratizing data access and improving user experience. You can share cloud integrations with better control over permissions, ensuring that only authorized users can access sensitive data.
The new UI for BigQuery integration configurations simplifies the setup process, guiding you step by step. You gain clear visibility of connected tables, making data management more straightforward. Cloud data location configuration offers flexibility in choosing the project and dataset for output data. These updates help you streamline your big data analytics workflows and make Domo a valuable tool for organizations managing complex data environments.
Alteryx stands out in data analysis tools news for its automated workflow features. You can prepare and validate data more efficiently, improving input data quality before processing. Automation of workflows saves significant manual effort, with some organizations reporting 7,500 hours saved annually. Integration capabilities allow you to streamline operations across departments, supporting over 90 automated use cases.
One operations lead shared that before using Alteryx, their team struggled with overwhelming data and lacked insights. After implementing Alteryx Designer and Designer Cloud, workflows now run automatically, and dashboards update in real time. These improvements make Alteryx a strong choice for big data analytics, especially for teams seeking to automate repetitive tasks and focus on higher-value analysis.
RapidMiner features prominently in data analysis tools news with its no-code AI functionality. You can build machine learning models without any coding knowledge, making advanced analytics accessible to non-technical users. This ease of use increases efficiency by automating processes and reducing the time needed for model creation.
RapidMiner offers significant cost savings compared to traditional software development. Optimization algorithms enable faster model training and experimentation. The platform also simplifies model deployment, making it easy to move models from development to production with user-friendly interfaces. These benefits support your big data analytics initiatives by empowering more users to participate in AI-driven projects.
IBM Cognos makes waves in data analysis tools news with its smarter reporting features. AI-powered agents assist you in creating enhanced reports. Interactive reporting and responsive dashboards improve your ability to explore data dynamically. Interactive brushing allows for more engaging report interactions, while smarter default parameter values use OLAP properties to streamline your workflow.
Automatic PGSDK chart conversion brings modern visualizations to your reports. The PDF table of contents makes navigation easier in exported documents. Report auto-refresh ensures you always view the latest data. These updates help you stay ahead in big data analytics by delivering timely and actionable insights.
Zoho Analytics rounds out the latest data analysis tools news with new third-party integrations. The Qntrl Connector integrates workflow and process data, enabling you to analyze task progress and operational efficiency. The Asana Connector syncs tasks and projects, allowing you to create visual dashboards to track productivity and team performance.
The Zoho Community Spaces Connector imports engagement data, helping you analyze community growth and member participation. The Zoho Finance Connector adds new modules for deeper financial insights and granular reporting across the finance suite. These integrations expand your data connectivity options, supporting comprehensive big data analytics across your organization.
Trends in Data Analysis Tools News
AI And Automation In Data Analysis Tools
You see ai data analysis transforming the landscape of data analytics. AI toolslike Jupyter AI and ChatGPT analytics capabilities now let you ask questions in plain English and receive instant, automated visualizations. AI agents handle data cleaning, so you can focus on strategic exploratory data analysis.
AI enables real-time analysis of large datasets, helping you make faster decisions.
AI tools generate insights automatically, reducing manual analysis time.
Semantic-aware AI agents improve consistency across different data analytics software. These trends make ai data analysis central to every modern data analytics platform. You benefit from ai-powered insights and predictive analysis, which help you spot patterns and act quickly.
Self-Service And Democratization
Self-service analytics and democratization remain top data analytics trends. The global augmented analytics sector reached $11.66 billion in 2024 and continues to grow. Organizations that empower business users with data analytics software see major gains. For example, a global financial institution saved over $50 million by scaling self-service capabilities.
Shared data analytics platforms break down silos, letting teams explore insights together.
Data democratization lets you analyze customer trends and respond to campaign data in real-time.
Teams with access to data analytics tools often find patterns that centralized teams miss, leading to breakthrough insights.
Modern SaaS data analytics solutions provide real-time insights for quick decision-making.
Collaboration Features
Collaboration-friendly data analytics platforms help teams share insights and dashboards in real-time, improving transparency and speeding up decisions.
You now expect real-time data analysis and collaborative dashboards as standard features in any advanced analytics tool.
Integration And Governance
You need a data analytics platform that supports seamless integration and strong governance. Best practices include:
Identify governance priorities for your organization.
Evaluate if your data analytics solution supports both batch and real-time governance.
Test integration with your existing systems.
Choose user-friendly data analytics software to support change management.
Calculate total cost of ownership before investing.
Run a proof of concept to check for integration gaps.
FineBI and other leading platforms address these trends by offering robust integration, real-time capabilities, and enterprise-grade governance. You gain confidence knowing your insights are secure, accurate, and actionable.
You need to start by understanding your organization’s unique requirements before selecting a data analysis tool. The right choice supports your team’s data-driven decision-making and ensures everyone benefits from analytics. Use the table below to guide your assessment:
Criteria
Description
User Interface
Enables non-technical users to participate in analysis.
Advanced Analytics Capabilities
Helps you identify trends and predict outcomes.
Integration
Combines data from existing systems and third-party sources.
Customization
Adapts to your specific business needs.
Flexibility and Scalability
Grows with your organization’s demands.
Security Features
Protects sensitive information.
Data Volume
Handles the amount of data you analyze.
Data Complexity
Manages complex data structures.
Type of Analysis
Supports the analysis your business requires.
Team Expertise
Matches the skill level of your users.
You should match these criteria to your organization’s goals. FineBI stands out for business-led teams because it offers a user-friendly interface and supports both technical and non-technical users. This approach helps you build a culture of data-driven decision-making.
You must consider how well a data analysis tool integrates with your current systems and how it scales as your needs grow. Leading platforms offer flexible architectures and support multi-cloud environments. They maintain data quality and compliance, even as your data grows. Look for these features:
Flexible architecture that adapts to new data sources.
Robust data quality processes for consistent results.
Support for multi-cloud and hybrid environments.
Ability to handle large data volumes without slowing down.
FineBI provides strong integration options, including over 60 connectors and support for hybrid environments. This flexibility ensures your data-driven decision-making process remains smooth as your organization expands.
AI And Security Considerations
You should evaluate AI capabilities and security features when choosing a data analysis tool. The right platform will enhance your decision-making with predictive analytics and protect your data. Consider the following factors:
Consideration
Description
Existing Infrastructure
Works with your current cloud and IT setup.
Team Skillset
Matches the complexity to your team’s abilities.
Specific Use Case
Excels in your primary business objective.
Scalability and Governance
Supports growth and enforces data governance.
You also need to check for AI model transparency, automation, and compliance support. FineBI’s AI-driven features, such as conversational analytics and enterprise-grade governance, help you make faster, more accurate decisions while keeping your data secure. This combination supports effective data-driven decision-making at every level of your organization.
You need to stay updated with data analysis tools news to keep your skills sharp and your organization competitive. The latest trends offer many benefits:
Data democratization lets everyone on your team use analytics.
Real-time dashboards give you instant feedback.
Edge computing speeds up data processing.
Review your current tools and explore new solutions like FineBI. Keep learning and adapting to get the most from your data. Stay informed and lead the way in analytics.
Access a wealth of case studies, industry insights, and solution guides to accelerate digital transformation.
FAQ
What is data analysis tools news?
Data analysis tools news covers the latest updates, features, and trends in analytics software. You stay informed about new releases, AI advancements, and integration options. This knowledge helps you choose the best tools for your business needs.
How often should you check data analysis tools news?
You should check data analysis tools news at least once a quarter. Frequent updates help you spot new features, security patches, and industry trends. Staying current ensures you use the most effective analytics solutions.
Why does data analysis tools news matter for your business?
You gain a competitive edge by following data analysis tools news. New features and AI capabilities can improve your workflow, boost productivity, and help you make better decisions. Early adoption often leads to better results.
How do you choose the right tool after reading data analysis tools news?
You should match tool features to your business needs. Look for integration, scalability, and AI support. Test new tools with a proof of concept before making a decision. This approach ensures you select the best fit.
Where can you find reliable data analysis tools news?
You can find reliable data analysis tools news on official vendor blogs, industry websites, and trusted tech publications. Subscribing to newsletters or following updates from leading analytics providers keeps you informed.