A category management dashboard is a digital tool that lets you track, analyze, and manage procurement activities across different categories. You use it to centralize data, monitor supplier performance, and optimize spending decisions within your organization.
With a dashboard, you gain real-time insights into your category management processes. For example, IoT sensors provide instant updates on supplier performance and supply chain visibility. AI tools can anticipate supplier behavior, helping you make smarter, faster decisions.
Category Management Dashboard Overview
What is a Category Management Dashboard
A category management dashboard gives you a centralized view of all procurement activities across your organization. You use this dashboard to track, analyze, and manage spending for each category. Leading procurement organizations define a category management dashboard as a data-driven management information process. This process supports category management by providing real-time sourcing information, such as supplier counts, spending periods, types of spend, and purchasing patterns. You can monitor spend, assess performance, and make sourcing adjustments to meet your business goals.
The main purpose of a category management dashboard is to help you make better decisions. You get access to real-time data, which means you can respond quickly to changes in supplier performance or market trends. The dashboard brings together information from different sources, so you do not need to search through multiple systems. You can see all your category spend analysis, supplier details, and procurement activities in one place.
A category management dashboard supports both strategic and tactical sourcing. You can use it to set policies, track compliance, and identify opportunities for cost savings. The dashboard also helps you spot risks early and take corrective actions before they affect your business. With a spend analytics dashboard, you can break down spending by supplier, region, or product type. This level of analysis helps you understand where your money goes and how you can optimize your procurement strategy.
Here is a table that shows the primary objectives of implementing a category management dashboard in procurement:
| Objective | Description |
|---|---|
| Real-time information | Provides up-to-date data for informed decision-making. |
| Support for sourcing decisions | Aids in both strategic and tactical sourcing efforts. |
| Insights for policy and strategy | Delivers analytical insights that help shape procurement policies and strategies. |
| Monitoring spend and performance | Tracks expenditure and evaluates performance against business commitments. |
| Corrective actions | Facilitates timely interventions to address any discrepancies or issues in procurement. |
You can use the dashboard for spend analysis, supplier performance tracking, and policy enforcement. The dashboard makes it easier to align your procurement activities with your business objectives. You can also use it to communicate results and progress to stakeholders.
Key Roles in Category Management
Category management involves several key roles. Each role plays a part in making sure your procurement process runs smoothly and delivers value. In large enterprises, you often see a category manager who oversees the entire category. This person designates categories and subcategories based on strategic procurement goals. The category manager negotiates payment terms and proposals, using their knowledge of the category to get the best deals.
You may also find specialists for each category. These specialists focus on specific areas, such as raw materials, IT equipment, or services. They bring deep expertise and help the category manager with analysis and supplier selection. Their work ensures that your procurement process meets both quality and cost targets.
Category management often relies on cross-functional teams. These teams include members from procurement, finance, operations, and sometimes legal or compliance. Cross-functional teams help you set a clear vision and objectives for each category. They make sure everyone understands the priorities and works toward the same goals. Frequent communication within these teams builds trust and improves results.
Here are the main roles involved in category management:
- The category manager sets the strategy and manages supplier relationships.
- Category specialists provide detailed analysis and support sourcing decisions.
- Cross-functional teams align objectives and share knowledge across departments.
You need these roles to make your category management dashboard effective. Each person brings unique skills and insights. Together, they help you use the dashboard for better monitoring, analysis, and decision-making. When you empower your teams and encourage open communication, you get the most value from your category dashboard.
A strong category management process leads to better spend control, improved supplier performance, and more strategic procurement outcomes. You can use the dashboard to track progress, identify issues, and drive continuous improvement in your procurement activities.
How a Category Management Dashboard Works
Core Components and Data Sources
You need to understand the essential components of category management dashboards before you can use them effectively. These dashboards bring together multiple data sources to give you a complete view of your procurement activities. You can track spending, supplier performance, and category spend analysis in one place. This centralized approach supports a strategic approach to procurement and helps you make informed decisions.
The main data sources integrated into a category management dashboard include:
- ERP systems
- Supplier databases
- Contract management platforms
- Market intelligence feeds
- Internal surveys
You use these sources to collect data on spend, supplier relationship management, contract terms, and market trends. The dashboard aggregates this information, making it easier for you to perform spend analysis and monitor category performance. You can see how much you spend in each category, identify savings opportunities, and track compliance with procurement policies.
Ensuring data quality is critical when you aggregate information from different sources. You need to measure completeness, uniqueness, freshness, accuracy, and timeliness. The table below shows how you can evaluate data quality in your dashboard:
| Metric | Description |
|---|---|
| Completeness | Measures if all required data is present. |
| Uniqueness | Ensures that data entries are not duplicated. |
| Freshness | Assesses how up-to-date the data is. |
| Accuracy | Evaluates if the data correctly represents the real-world scenario. |
| Timeliness | Checks if the data is available when needed for decision-making. |
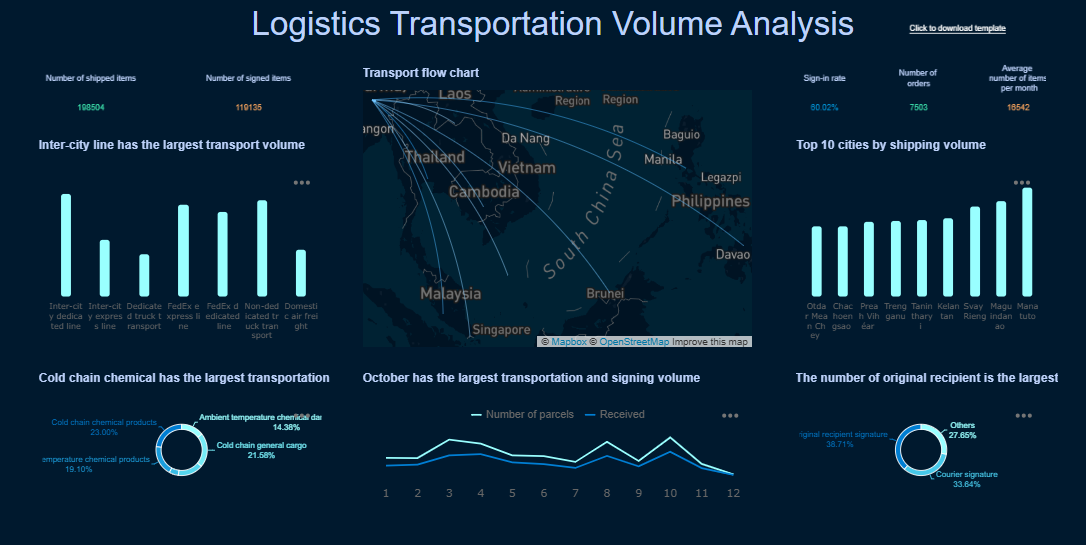
For example, a logistics company uses a dashboard to monitor shipping data accuracy from various courier partners. This helps you maintain reliable tracking information and ensures service quality for your customers.
Real-time Insights and Visualization
You rely on real-time insights to make fast and effective decisions in category management. A category management dashboard provides continuous updates on spend, supplier performance, and market trends. You can access spend analytics dashboard features that deliver instant market intelligence, proactive alerts, and benchmarking capabilities.
The table below highlights the most valuable real-time insights for procurement teams:
| Feature | Description |
|---|---|
| Real-time market intelligence | Provides continuous updates on cost drivers, supply-demand trends, and market shifts, essential for timely decision-making. |
| Integration of AI and human intelligence | Combines AI analytics with human expertise to ensure insights are accurate and contextually relevant. |
| Proactive alerts and advisories | Offers real-time notifications and contextual recommendations to help procurement teams act swiftly on emerging risks or opportunities. |
| Benchmarking capabilities | Enables continuous performance evaluation against peers and industry standards, fostering ongoing improvement. |
| End-to-end category insights | Delivers contextual intelligence that connects cost trends, supplier behavior, and market drivers, enhancing strategic decision-making. |
| Accessibility and digital-first design | Ensures insights are easily accessible and usable from any device, supporting remote collaboration. |
| Actionable insights | Transforms data into clear next steps, guiding procurement teams on what actions to take based on market conditions. |
You use these insights to improve spend visibility and drive intelligent category management. The dashboard transforms raw data into actionable recommendations, helping you optimize spending and supplier relationships. You can benchmark your performance against industry standards and identify areas for improvement.
Visualization tools in category management dashboards play a key role in data interpretation. You can simplify complex information, access real-time data, and explore interactive views. The table below explains how visualization tools enhance your analysis:
| Benefit | Description |
|---|---|
| Simplification of Information | Visualization tools convert complex data into clear visuals, aiding in quicker decision-making. |
| Real-time Data Access | Timely access to data enables organizations to respond swiftly to market changes and challenges. |
| Interactive Data Exploration | Engaging with data allows users to uncover deeper insights that static views may overlook. |
You can use charts, graphs, and dashboards to monitor category spend analysis, supplier performance measurement, and procurement trends. These visuals help you communicate results to stakeholders and support strategic decisions.

FineReport Integration for Dashboards
You can elevate your category management dashboard by integrating FineReport. FineReport offers a drag-and-drop dashboard creation tool that makes it easy for you to design custom dashboards without coding. You can connect to multiple data sources, including ERP systems, supplier databases, and market intelligence platforms. This integration supports essential components of category management and ensures you have a unified view of your procurement activities.
FineReport enables you to access dashboards on any device, including mobile phones and tablets. You can monitor spending, supplier performance, and category trends in real time, whether you are in the office or on the go. The software supports ai-powered dashboards, allowing you to combine AI analytics with human expertise for deeper insights.
In manufacturing and supply chain management, FineReport helps you track procurement, inventory, and logistics data. For example, you can use the dashboard to analyze spend across different categories, monitor supplier relationship management, and identify cost-saving opportunities. You can also automate reporting and schedule regular updates, ensuring you always have the latest information for strategic decision-making.
FineReport’s category management software supports interactive analysis, advanced visualization, and real-time monitoring. You can customize your dashboard to focus on the metrics that matter most to your organization. This flexibility empowers you to take a strategic approach to procurement and drive continuous improvement in your category management process.
Tip: Use FineReport’s mobile accessibility to stay connected to your dashboard and make informed decisions anytime, anywhere.
You gain a competitive edge by leveraging FineReport for intelligent category management. You can optimize spend, improve supplier relationships, and enhance performance measurement across all categories.

Essential Features of Category Management Dashboard
Spend Analysis and Savings Tracking
You need robust spend analysis solutions to manage procurement effectively. A category management dashboard gives you clear spend visibility, helping you identify trends and patterns in your spending. You can track spend by category, monitor cost savings, and analyze procurement ROI. The dashboard breaks down spending into categories, showing you where you can optimize spending and realize savings. Common metrics include spend under management, cost avoidance, price variance, and savings realization rate. You use these insights to make strategic decisions and improve your procurement outcomes.
Supplier Performance Metrics
Monitoring supplier performance is essential for long-term success in category management. The dashboard lets you track key metrics such as procurement cycle time, supplier lead time, quality rating, and contract compliance. You can customize KPIs for each category and supplier type. The dashboard integrates data from multiple sources, giving you a centralized platform for real-time KPI monitoring. Automated alerts notify you of performance drops or risk flags, so you can respond quickly. Continuous analysis supports supplier relationship management and drives ongoing improvement.
| Feature | Description |
|---|---|
| Integrate multiple data sources | Combines data from ERP, QA, logistics, and finance into a single view. |
| Customize KPIs | Tailors KPIs by category, supplier type, or business unit. |
| Automate alerts | Sends notifications for performance drops or risk flags automatically. |
| Enable collaboration | Facilitates real-time feedback and responses between teams and suppliers. |
| Continuous improvement | Provides insights to act before minor issues escalate into major problems. |
Customization and Automation with FineReport
FineReport category management software empowers you to tailor dashboards for your specific procurement needs. You can connect disparate data sources, break data silos, and deliver consolidated supply chain dashboards. Rich visualizations help you track supply chain processes and trends in real time. Automated reporting ensures you always have up-to-date views of operations. Mobile-friendly reporting lets you review outputs on the move. FineReport’s permission management enhances data security, allowing administrators to assign viewing permissions and template authentication for data alerts.
Category Management Savings Dashboard
A category management savings dashboard centralizes tracking of savings performance, linking savings to sourcing events and milestones. You gain real-time visibility on procurement savings, making it easy to share data with stakeholders and facilitate quick reviews. The dashboard aligns metrics with company objectives, consolidates data sources, and uses visualization tools to transform complex data into actionable insights. You use the cost savings dashboard to demonstrate achieved savings, support meetings, and drive strategic decisions. This data-driven approach helps you optimize spending and achieve intelligent category management.
Tip: Use the category management savings dashboard to support procurement, inventory, and supplier management. Advanced visualization, scheduled reporting, and permission management in FineReport ensure you have the essential components of category management for effective performance measurement and analysis.
Benefits of Category Management Dashboard
Cost Savings and Efficiency
You can achieve measurable procurement cost savings and greater efficiency by using a category management dashboard. The dashboard helps you identify opportunities to consolidate contracts and leverage volume pricing. You reduce duplication of efforts by seeing where shared solutions already exist. You track progress toward performance targets and compare spending patterns across categories. When you use category management as an ongoing initiative, you transform data into actionable insights. This approach embeds cost reduction strategies and supports sustainable competitive advantage. You also support strategic planning with evidence-based insights, making your procurement process more effective.
- Identify common requirements that can be sourced together.
- Share innovative acquisition methods and lessons learned.
- Support the development of organization-wide solutions.
Risk Mitigation and Compliance
A category management dashboard helps you manage risks and maintain compliance. You monitor key metrics and track contract adherence. You ensure suppliers meet regulatory standards, reducing the risk of legal issues. The dashboard provides a reliable audit trail of procurement operations, which promotes stakeholder confidence. You assess supplier risk and monitor certifications status. Real-time insights help you stay ahead of regulatory requirements and take immediate action when needed.
Tip: Use compliance dashboards to centralize compliance activities and transform complex data into actionable intelligence.
Improved Supplier Relationships
You strengthen supplier relationships by using category management dashboards. Centralizing supplier data gives you a holistic view of supplier performance. Strategic segmentation of suppliers fosters closer collaboration with key partners. You listen to stakeholders and refine sourcing requirements based on feedback. Long-term relationships with fewer suppliers reduce administrative burdens and improve communication. Consistent performance measurement using KPIs ensures suppliers meet expectations and supports relationship management.
- Dashboards provide critical insights into contract compliance.
- Both procurement teams and suppliers access a single source of truth, reducing miscommunication.
- Real-time updates allow for timely adjustments and improved collaboration.
Strategic Decision-making with FineReport
FineReport category management software empowers you to make strategic decisions with advanced analytics. The dashboard acts as a management cockpit, providing real-time monitoring and analysis tools for decision makers. You access key indicators on mobile devices, allowing you to monitor category spend analysis anytime, anywhere. Real-time updates of key indicators enhance visibility and responsiveness. Developing a robust category management plan becomes easier with these features, helping you optimize spending and procurement outcomes.
| Feature | Description |
|---|---|
| Management cockpit | Real-time monitoring and analysis for decision makers. |
| Multi-terminal display | Access key indicators on mobile devices for flexible monitoring. |
| Monitor refreshing | Real-time updates of key indicators in various settings. |
A category management dashboard gives you the tools to optimize procurement and supply chain management. You gain real-time insights, track supplier performance, and drive cost savings. FineReport lets you build and customize dashboards that fit your business needs. You can start by exploring FineReport’s solutions and see how they support smarter decision-making. Take action now to improve your procurement strategy and unlock new value.
Tip: Visit FineReport’s website to learn more about implementing a category management dashboard for your organization.

Continue Reading About Category Management Dashboard
Best Dashboard Apps for Business Insights
What is a Call Center Dashboard and Why Does It Matter
What is a Reporting Dashboard and How Does it Work
What is An Interactive Dashboard and How Does It Work
What is a Call Center Metrics Dashboard and How Does It Work


FAQ

The Author
Lewis
Senior Data Analyst at FanRuan
Related Articles

How to Build an Investment Portfolio Reporting Dashboard for Executives: KPIs, Benchmarks, and Drill-Down Views
Investment portfolio reporting for executives is not about showing every holding, transaction, and chart your investment team can produce. It is about giving CEOs, CFOs, CIOs, boards, and investment committees a fast, re
Yida YIn
Jun 25, 2026

12 KPI Reporting Examples for Executive Dashboards: What to Show in Weekly, Monthly, and Quarterly Reviews
Executive leaders do not need more data. They need decision ready $1 examples that match how often they review the business and what actions they are expected to take. A weekly $1 should surface fast moving risks and per
Yida YIn
Jun 25, 2026

How to Build a Digital Marketing Reports Dashboard: Executive Examples, KPIs, and Templates
A $1 is the control layer that helps executives and marketing leaders turn scattered channel data into fast, confident decisions. If you are a CEO, CMO, operations director, or marketing analytics lead, the real problem
Yida Yin
May 07, 2026