What is an EHS dashboard? An EHS dashboard is a digital tool that lets you track, visualize, and manage key Environmental, Health, and Safety metrics in one place. You use the EHS dashboard to monitor incidents, compliance, audits, and corrective actions in real time, giving you clear oversight of your organization’s safety performance.
EHS management has become a top priority for organizations, especially in manufacturing where risks are higher. You need efficient EHS processes to protect workers, meet regulations, and ensure smooth operations. The move from traditional to digital EHS systems has transformed how you handle EHS tasks. Now, you gain better risk management, lower injury rates, and improved worker conditions. Digitization lets data flow directly from the field into automated workflows, so you can spot trends and act faster—sometimes within days instead of waiting for audits.
With EHS, you rely on real-time data to make decisions and allocate resources wisely. The EHS dashboard gives you the tools to improve safety, streamline compliance, and create a safer workplace.
You use an ehs dashboard to view and manage essential safety and compliance data in real time. Industry experts define an ehs dashboard as a digital platform that gives you instant access to key performance indicators. You can track accidents, incidents, near misses, and lost time injury rates. The ehs dashboard helps you see trends and patterns, so you can respond quickly to risks.
The main goal of an ehs dashboard is to support ehs management by making safety data easy to understand and act on. You use the dashboard to measure performance, interpret data, and monitor KPIs. The dashboard helps you visualize information through charts and graphs, so you can make better decisions.
| Objective | Description |
|---|---|
| Performance Measurement | You see how your organization performs against its safety goals. |
| Data Interpretation | You learn what data matters and how to use it for positive change. |
| KPI Assessment and Monitoring | You control and track key safety indicators and plan actions. |
| Data Visualization | You view information in clear charts, graphs, and summaries. |
The ehs dashboard supports ehs management by giving you the tools to improve safety, meet regulations, and drive continuous improvement.
You rely on the ehs dashboard to track many types of data in ehs management. The dashboard covers injury rates, training status, audit results, inspection schedules, and action management. You can see which areas need attention and which controls work best.
| Dashboard Type | Key Metrics Tracked |
|---|---|
| Injury Insights Dashboard | DART Rate, Total Case Incident Rate, Lost Time Incident Rate, Injury Frequency by Location or Department |
| Training Status Dashboard | Training hours completed, Pending training sessions, Trainer performance, Incident correlation |
| Safety Audit Dashboard | Audit schedules, Completion rates, Audit findings, CAPA progress tracking |
| Safety Inspection Dashboard | Completed vs. scheduled inspections, Overdue inspections, Monthly and quarterly trends |
| Action Management Dashboard | Open vs. closed actions, Overdue actions, Effectiveness of controls |
You use the ehs dashboard to monitor these metrics and support ehs management across your organization. The dashboard helps you keep track of compliance, safety, and health data, making your ehs processes more effective.
You need real-time monitoring in your EHS dashboard to keep your organization safe and compliant. Most leading EHS software solutions offer real-time dashboards and analytics. These tools help you track incidents, hazards, and safety metrics as they happen. When you see data instantly, you respond faster to risks and prevent accidents before they escalate. Real-time monitoring improves incident response times and supports proactive EHS management.
| EHS Software Provider | Real-Time Monitoring Features |
|---|---|
| Top EHS Incident Management | Real-time dashboards and analytics for safety insights |
| EcoOnline | Real-time dashboards for safety and compliance |
| IFS Ultimo | Analytics and dashboards for monitoring safety performance |
| Enablon | Real-time analytics for safety and risk data |
| Cority | Dashboards for EHS and ESG performance |
| HSI Donesafe | Real-time dashboards and automated reporting tools |
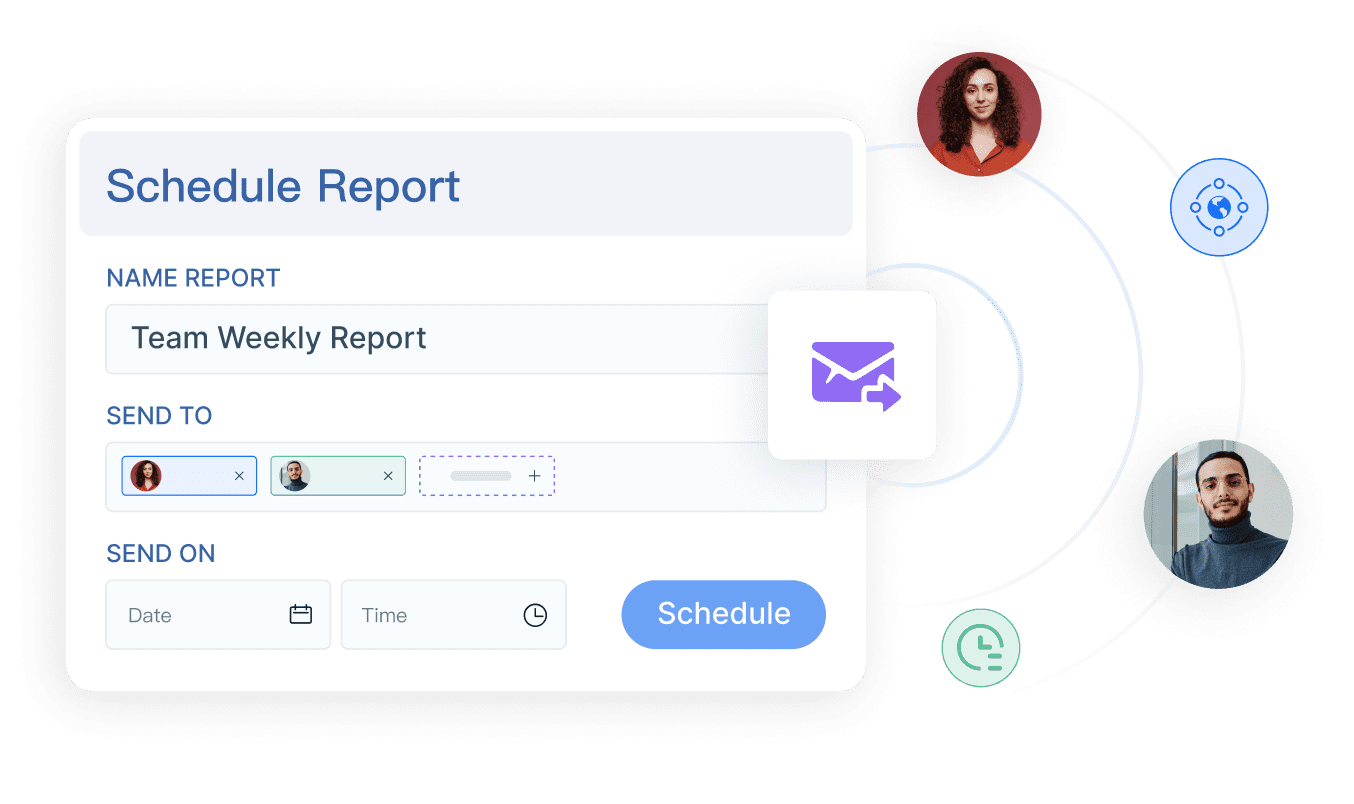
Customizable reporting in your EHS dashboard lets you tailor reports to fit your organization’s needs. You create reports that focus on specific safety metrics, compliance requirements, and hazards. This flexibility helps you meet regulatory standards and make informed decisions. You can generate reports for internal analysis or share them with external agencies. Customizable reporting options streamline your workflow and ensure you always have the right data at your fingertips.
Your EHS dashboard should connect seamlessly with other business systems. Integration capabilities allow you to link your EHS management software with on-premises systems, identity providers, APIs, and ERP platforms like SAP. These connections help you consolidate safety data, track hazards, and manage resources efficiently. You gain a unified view of EHS management across your organization.
| Integration Capability | Description |
|---|---|
| On-Premises Systems Integration | Connects cloud EHS software with on-site systems for better processes |
| Identity Provider Integration | Enables single sign-on for user access |
| Public and Private API Integration | Shares data with regulatory bodies and third-party APIs |
| Portal Integrations | Combines data from multiple sources for analysis |
| ERP System Integration | Links vendors and internal resources for tracking work and payments |

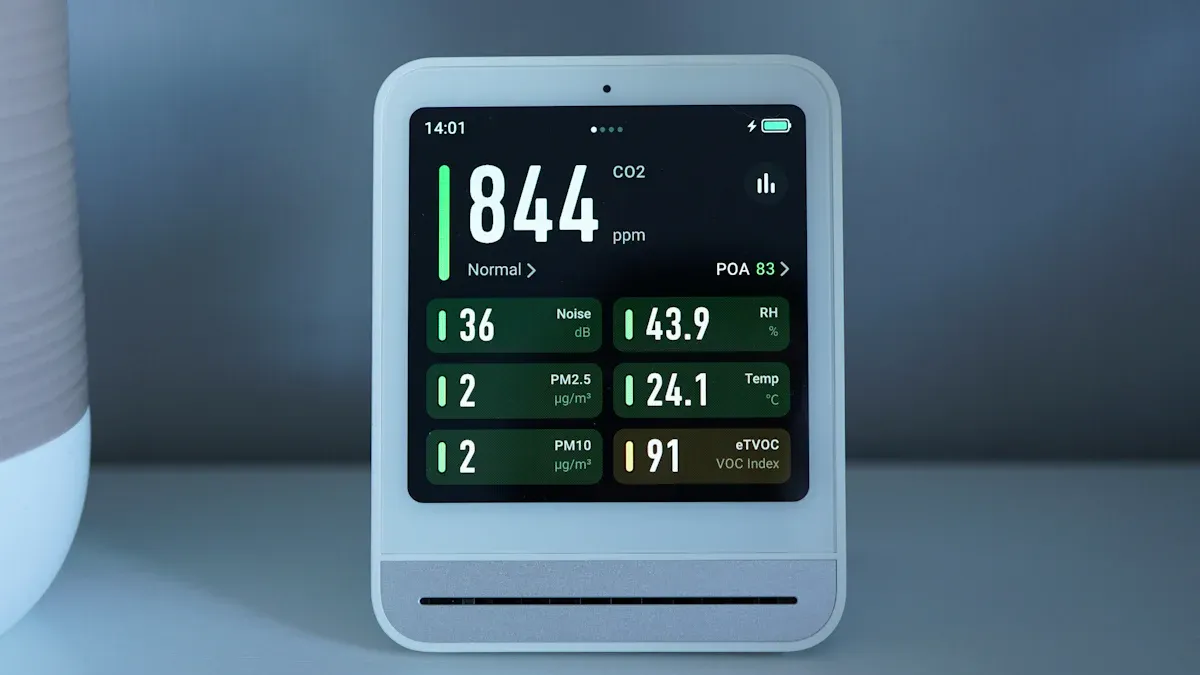
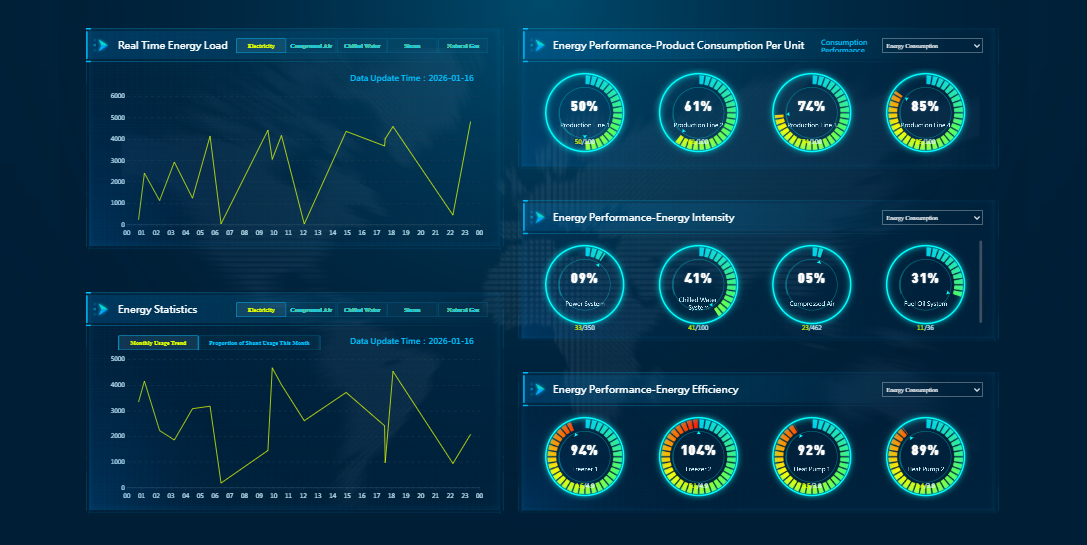
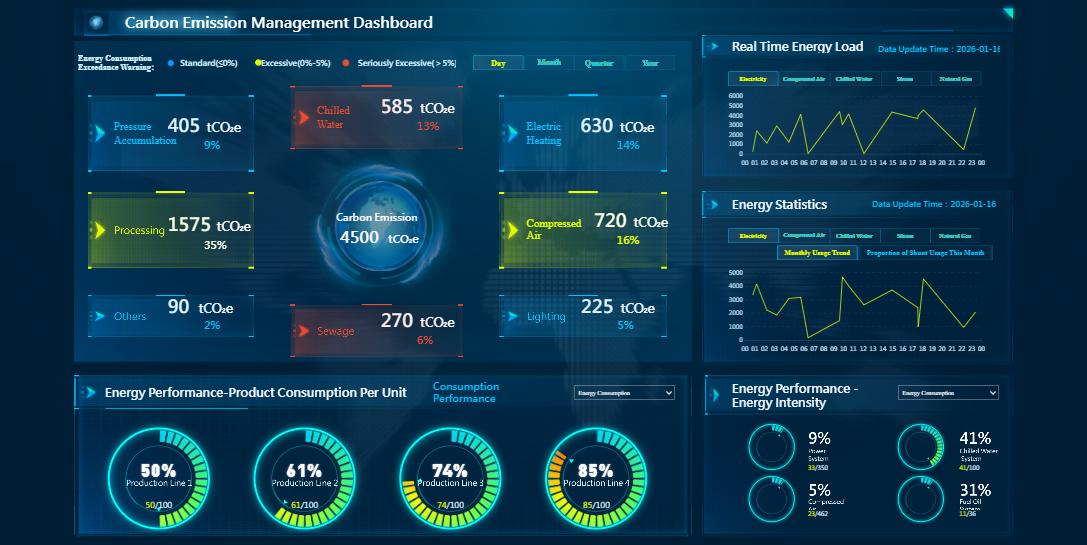
Mobile and 3D dashboards in your EHS dashboard give you flexibility and deeper insights. You access safety data on smartphones or tablets, making field operations more responsive. Mobile capabilities let you manage EHS tasks anywhere, improving visibility and accessibility for field workers. 3D dashboards help you visualize ergonomic risks and flag high-risk tasks. AI-powered analysis in these dashboards surfaces hidden hazards, supporting proactive EHS management.
| Feature Description | Contribution to EHS Management Outcomes |
|---|---|
| Mobile capabilities for EHS management on-the-go | Enhances flexibility and responsiveness in field operations |
| 3D motion capture for ergonomic risk assessment | Improves ergonomic assessments and reduces fatigue |
| AI-powered analysis for risk detection | Facilitates proactive risk mitigation |
| Customizable dashboards on mobile devices | Improves data visibility for field workers |
FineReport’s drag-and-drop design, mobile dashboard, and 3D visualization features support EHS management in manufacturing and other industries. You use these tools to monitor safety, track hazards, and improve workplace safety outcomes.


You need an EHS dashboard to meet the growing demands of modern EHS management. In manufacturing, you face strict regulations, complex hazards, and the need for real-time oversight. The shift to digital EHS management systems has transformed how you handle compliance, safety, and operational efficiency. An EHS dashboard brings all your critical data together, helping you make informed decisions and drive continuous improvement.
You must comply with a range of occupational health and safety and environmental regulations. An EHS dashboard helps you track and report on these requirements with accuracy and speed. In manufacturing, you deal with standards like OSHA, EPA, ISO 45001, and ISO 14001. These regulations set strict rules for workplace safety, environmental impact, and employee well-being.
| Regulation/Standard | Description |
|---|---|
| OSHA | U.S.-based regulatory body setting workplace safety standards, such as machinery safeguarding, hazardous material handling, and employee training requirements. |
| EPA | Regulates air and water emissions, waste disposal, and chemical safety, helping manufacturers limit their environmental impact. |
| ISO 45001 | International standard for occupational health and safety management systems, focused on reducing work-related risks and enhancing employee well-being. |
| ISO 14001 | Provides a framework for environmental management systems, supporting energy conservation, waste reduction, and sustainable resource use. |
An EHS dashboard streamlines compliance by automating workflows, centralizing obligation tracking, and providing real-time reporting. You can use features like compliance calendars and automated alerts to ensure you never miss a deadline or requirement.
| Feature | Description |
|---|---|
| Automated Compliance Workflows | Reduces manual effort with alerts and tasks to keep actions on track. |
| Centralized Obligation Tracking | Stores all requirements in one place for easy tracking of progress and documents. |
| Real-Time Reporting & Dashboards | Provides instant insights with live reports to keep teams informed. |
| Compliance Calendar | Helps schedule and assign recurring actions, ensuring accountability and organization. |
With an EHS dashboard, you simplify EHS compliance and reduce the risk of penalties. You also gain confidence that your EHS management system meets all regulatory requirements.
You need to protect your workforce from hazards and reduce risks in your operations. An EHS dashboard gives you the tools to identify, assess, and control hazards before they lead to incidents. In manufacturing, you face challenges like machine safety, chemical exposure, and ergonomic risks. An EHS management system helps you track leading indicators, such as near misses and unsafe conditions, so you can act before problems escalate.
You can use real-time dashboards to filter data, assign corrective actions, and monitor compliance. Automated scheduling of corrective and preventive actions (CAPAs) ensures you resolve issues quickly. By tracking metrics like Total Recordable Incident Rate (TRIR), Lost Time Injury Frequency Rate (LTIFR), and near miss reporting rate, you measure the effectiveness of your EHS management system.
| Evidence | Explanation |
|---|---|
| Real-time dashboards with filterable data | Make it easier to identify hazards and monitor compliance, which is essential for proactive risk management. |
| Automated assignment and scheduling of CAPAs | Ensures that corrective actions are taken promptly, preventing issues from escalating. |
| Tracking leading indicators | Monitoring unsafe conditions and near misses serves as an early warning system, allowing teams to act before incidents occur. |
You build a culture of safety by encouraging everyone to report hazards and participate in EHS management. This proactive approach reduces workplace incidents and supports continuous improvement.
You rely on accurate data to make smart decisions in EHS management. An EHS dashboard collects and visualizes data from multiple sources, giving you a complete view of your organization’s performance. You can spot trends, identify patterns, and respond to emerging risks faster.
| Benefit | Description |
|---|---|
| Improved Operational Efficiency | Streamlining processes to enhance productivity. |
| Enhanced Workplace Safety | Reducing incidents and promoting a safer work environment. |
| Better Regulatory Compliance | Ensuring adherence to regulations and standards. |
You use trend analysis features to track key metrics over time, such as injury rates and audit results. This helps you move from reactive to proactive EHS management. When you see a spike in incidents or a drop in training completion, you can act immediately. Visualizing trends in your EHS dashboard supports better planning and resource allocation.
You make better decisions when you have access to real-time, accurate data from your EHS management system.
You want your EHS management system to improve efficiency across your organization. An EHS dashboard automates routine tasks, reduces manual data entry, and speeds up reporting. In manufacturing, this means you spend less time on paperwork and more time on safety improvement.
| Improvement Type | Percentage Improvement |
|---|---|
| Safety Compliance | 30% |
| Accountability and Transparency | 100% |
| Speed of Safety Audits | 50% faster |
| Incident Resolution Time | 40% reduction |
Companies using EHS dashboards report a 20% reduction in time spent on compliance activities. You also see faster safety audits and quicker incident resolution. Real-time equipment monitoring and optimized preventive maintenance help you avoid costly failures and production delays.
| Evidence Description | Contribution to Cost Savings and Resource Optimization |
|---|---|
| Real-Time Equipment Monitoring | Enables immediate action on performance deviations, preventing costly equipment failures. |
| Optimized Preventive Maintenance | Allows for scheduling maintenance just before failures occur, reducing unnecessary resource expenditure. |
| Improved Decision-Making | Facilitates faster and more informed decisions regarding resource allocation and task assignments. |
| Enhanced Team Collaboration | Reduces delays and improves efficiency in maintenance management, minimizing production disruptions. |
You use your EHS management system to allocate resources wisely, reduce waste, and support sustainable growth. FineReport supports these goals by providing a flexible, integrated EHS dashboard that connects data from across your organization. You gain the tools to manage compliance, safety, and efficiency in one place, helping you meet the demands of modern manufacturing and beyond.
You need a reliable solution to manage your ehs data efficiently. FineReport stands out as a powerful tool for ehs management. You can use FineReport to connect data from HR, finance, and ESG systems, creating a unified view of your organization’s ehs performance. This multi-source integration prevents data silos and ensures that your sustainability information remains consistent across departments. You can automate reporting, centralize compliance records, and access real-time insights. FineReport supports both web and mobile access, so you can monitor ehs activities from anywhere. The drag-and-drop interface makes it easy to design custom dashboards and reports, even if you do not have advanced technical skills.
FineReport offers several advantages for ehs management. You can streamline compliance by automating data collection and reporting. The platform helps you track incidents, audits, and corrective actions in real time. You gain the ability to visualize trends and identify risks quickly. FineReport’s automated reporting reduces manual work and improves accuracy. You can set up scheduled tasks to deliver reports to stakeholders on time. The mobile dashboard feature lets you access key metrics during site inspections or fieldwork. By centralizing your ehs data, you make informed decisions and respond to issues faster. FineReport also supports permission management, so you control who can view or edit sensitive ehs information.
Many organizations use FineReport to enhance their ehs management. In manufacturing, you face strict regulations and complex hazards. FineReport helps you monitor employee health, track safety training, and manage environmental data. You can visualize production line risks and ensure compliance with industry standards. The Abu Dhabi Projects and Infrastructure Centre (ADPIC) adopted FineReport to improve project oversight and safety. By using FineReport, ADPIC gained real-time insights into safety, quality, and sustainability. The platform enabled better decision-making and streamlined compliance reporting. You can apply these solutions to your own ehs management needs, whether you operate in manufacturing, infrastructure, or other sectors.

You gain essential value from an EHS dashboard by improving operational efficiency, reducing accidents, and strengthening your organization’s reputation. Digital transformation in EHS management drives better compliance and safety outcomes. FineReport helps you streamline data collection, automate reporting, and enhance decision-making. To get started, engage senior leaders, track key safety indicators, and review hazards monthly. Focus on meaningful metrics and continuous training to foster a culture of safety and compliance.
| Benefit | Description |
|---|---|
| Improved Operational Efficiency and Morale | Clear EHS protocols enhance operations and boost employee morale. |
| Reduced Workplace Accidents and Legal Risks | Monitoring and training lower accident chances and minimize legal exposure. |
| Stronger Reputation and ESG Performance | Proactive EHS implementation improves credibility and ESG scores. |
| Enhanced Regulatory Readiness | Regular updates to EHS practices prepare organizations for inspections and compliance requirements. |

Best Dashboard Apps for Business Insights
What is a Call Center Dashboard and Why Does It Matter
What is a Reporting Dashboard and How Does it Work
What is An Interactive Dashboard and How Does It Work
What is a Call Center Metrics Dashboard and How Does It Work

The Author
Lewis
Senior Data Analyst at FanRuan
Related Articles

Payment Analytics Dashboard: 12 KPIs Every Operations Leader Should Track to Cut Revenue Leakage
Losing revenue to declines? Discover 12 essential KPIs to track in your payment analytics dashboard to stop leakage and manage disputes.
Lewis Chou
May 05, 2026

SOC Dashboard Explained: 12 Essential KPIs, Views, and Workflows Security Teams Use
Learn about SOC dashboards, the 12 essential KPIs for security teams, and how they centralize alerts and workflows for faster threat detection and response.
Lewis Chou
May 05, 2026

EMR Dashboard Guide: 12 Metrics to Track for Faster Clinical and Operational Decisions
Learn the 12 essential EMR dashboard metrics to track for faster clinical and operational decisions, improving patient flow and revenue cycle management.
Lewis Chou
May 05, 2026


