What is 'manager dashboard'? A manager dashboard is a centralized digital tool that lets you view, track, and analyze your team’s performance and business metrics in real time. You use a manager dashboard to spot trends, monitor goals, and get actionable insights fast. Manager dashboards help you make better decisions by putting important data in one place. With effective dashboards, you can boost productivity, improve communication, and react quickly to changes. You stay focused on results when you rely on a manager dashboard that brings clarity to your daily work.
Manager Dashboard Overview
What Is a Manager Dashboard
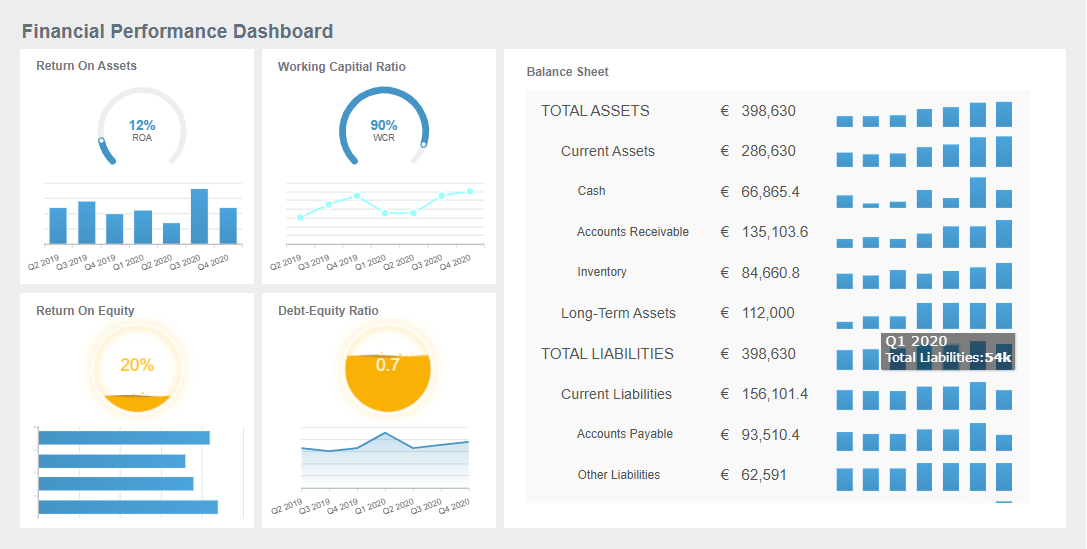
Amanager dashboard is a digital workspace that brings all your important information together. You use it as a single portal to see everything you need for managing your team or business. This tool collects data from different sources and displays it in one place. You do not need to switch between multiple apps or spreadsheets. You get a clear view of your team’s progress, goals, and challenges.
The main purpose of a manager dashboard is to help you stay organized and informed. You can track performance, monitor key metrics, and spot trends as they happen. The dashboard acts as your command center. You see real-time data that helps you make decisions quickly. You do not waste time searching for reports or waiting for updates. Everything you need appears on your screen, ready for action.
A manager dashboard functions as a centralized portal for team and business management. You access a unified view of your operations, which means you do not have to log in to different systems. The dashboard brings together data from sales, HR, finance, and other departments. You can analyze this information without confusion or delay. This setup transforms how you manage your team and business. You respond faster to changes and keep everyone aligned with company goals.
You rely on a manager dashboard for several key functions. These features help you lead your team and drive results.
Function
Description
Performance Monitoring
You gauge performance and efficiency, seeing which areas need attention.
Data-Driven Decision-Making
You make informed choices based on real-time data and clear insights.
Real-Time Issue Identification
You spot problems as they happen, allowing you to act quickly and guide your team.
You use the dashboard to monitor progress toward goals. You can see if your team meets targets or if you need to adjust your strategy. The dashboard highlights important trends and patterns. You do not miss early warning signs or opportunities for improvement.
Another key function is supporting data-driven decisions. You base your actions on facts, not guesses. The dashboard provides real-time data, so you always work with the latest information. This approach reduces mistakes and helps you achieve better outcomes.
You also use the dashboard to identify issues as soon as they arise. You do not wait for monthly reports to find out something went wrong. The dashboard alerts you to problems in real time. You can step in, offer support, and keep your team on track.
Manager dashboards sometimes face obstacles. You might see design problems, such as confusing layouts or too much information. You could run into data quality issues, like slow updates or conflicting numbers. Lack of user training can also make adoption difficult. You overcome these challenges by focusing on user-friendly design, ensuring high-quality data, and providing training for your team.
A manager dashboard gives you the tools to lead with confidence. You stay informed, act quickly, and keep your team moving forward.
Importance of Manager Dashboard for Managers
Why Dashboards Matter
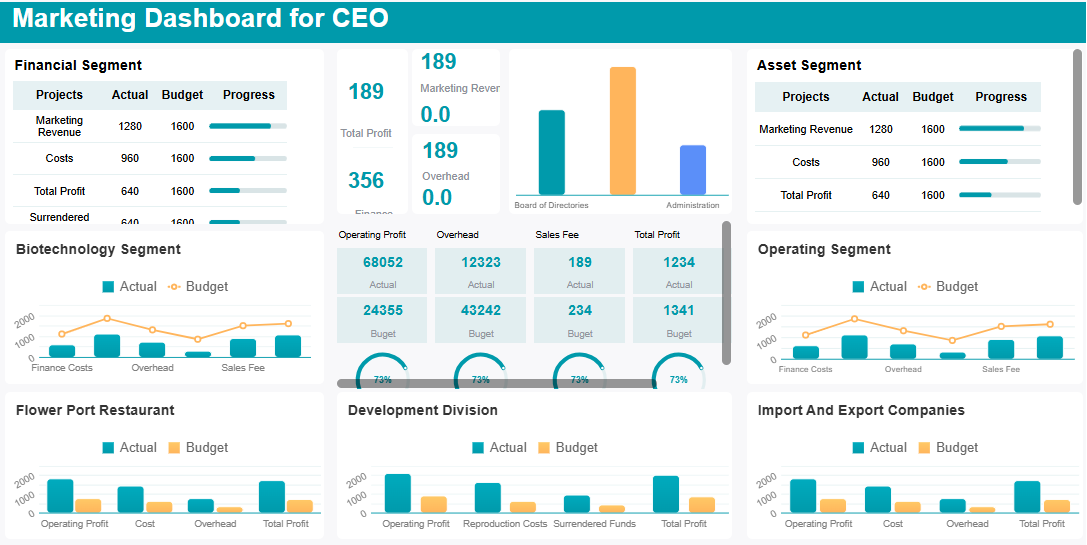
You need to understand theimportance of dashboards if you want to lead your team effectively. Dashboards improve efficiency and transparency in your daily work. When you use a manager dashboard, you give your team access to the same information, which helps everyone stay aligned and focused on shared goals. You can see how your team performs and where you need to make changes.
A manager dashboard makes data accessible to all stakeholders. This accessibility supports informed business decisions.
Features like data lineage build trust and accountability. You can trace where your data comes from and ensure accuracy.
You get a comprehensive view of performance, which helps you spot trends and reduce risks.
Companies that use dashboards report higher operational efficiency. For example, one company saved many hours each month by reducing manual work. Another company avoided financial losses by using real-time data to make better inventory decisions. These examples show the importance of dashboards in keeping your business on track.
Decision-Making Benefits
You rely on dashboards to track key performance indicators and monitor your team’s progress. Performance management dashboards help you see what matters most. The table below shows how dashboards support your work:
Feature
Benefit
Real-time tracking
Monitor KPIs as they happen, allowing for quick responses to changes.
Data visualization
Turn complex data into clear graphics, making trends easy to spot.
Centralized metrics
View all important metrics in one place for a complete performance view.
Dashboards help you make timely decisions. You do not need to wait for monthly reports. You can act fast when you see a problem or opportunity. Dashboards encourage you to use data instead of intuition, which leads to better business decisions. You can identify patterns and trends that support strategic planning.
Compliance dashboards are invaluable for compliance officers, auditors, and decision-makers who need real-time insights into their organization's adherence to regulations and standards.
FineReportgives you the tools to build powerful manager dashboards. You can connect to multiple data sources and automate reporting. FineReport provides real-time data, so you always have the latest information. You can access dashboards on your computer or mobile device, which means you stay informed wherever you are. FineReport’s features help you track key performance indicators, monitor team performance, and respond quickly to changes. With FineReport, you simplify reporting, improve visibility, and make better business decisions every day.
Essential Features of a Manager Dashboard for Office Managers
Customization and Flexibility
You need adashboard for office managers that adapts to your unique needs. A customizable dashboard lets you choose what information to display and how to arrange it. You can use pre-designed layouts for faster setup or build your own templates. This flexibility helps you focus on the key performance indicators that matter most to your team. You can also match the dashboard’s look to your company’s branding, which creates a consistent experience for everyone.
Customizable dashboards and templates
Real-time KPI monitoring
Integration with multiple data sources
These options make it easy to set up your workspace and keep your team focused on the right goals.
Real-Time Data and Analytics
You need real time information to make smart decisions. Real-time dashboards give you instant visibility into your operations. You can see employee performance, project status, and business trends as they happen. This feature helps you respond quickly to changes and spot opportunities for improvement. Interactive data visualizations let you dig deeper into the numbers, which leads to better analysis and insights.
Immediate visibility into operations and performance
Visual metrics highlight trends and opportunities
With real-time analytics, you do not have to wait for reports. You act on the latest data and keep your team moving forward.
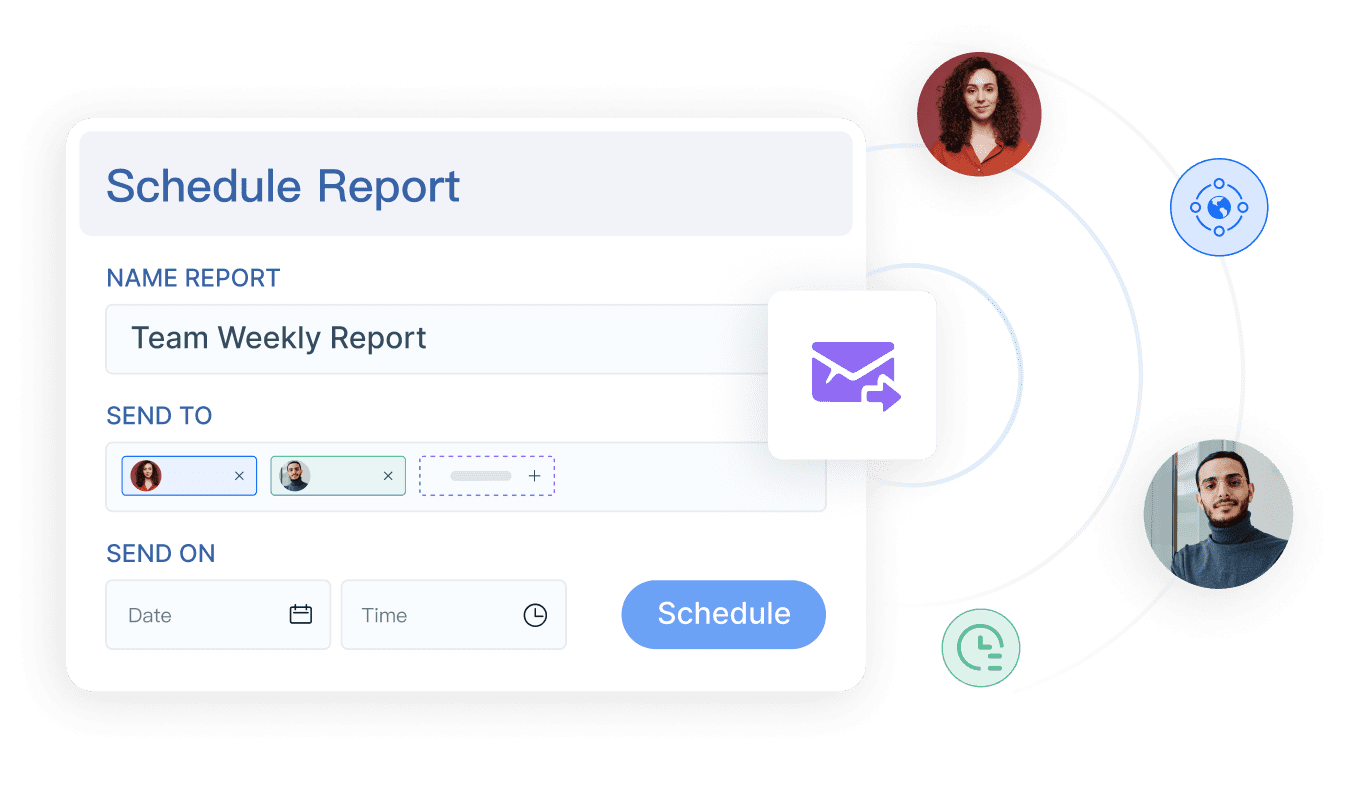
Mobile and Multi-Device Access
You often work outside the office. A dashboard for office managers must work on any device, including phones and tablets. Mobile access lets you check progress, approve requests, and monitor your team from anywhere. This feature supports remote and hybrid work by helping you track productivity and engagement. You can address issues like slow response times or disengagement before they become bigger problems.
Integration with Business Systems
You need your dashboard to connect with other business systems. Integration brings data from HR, sales, finance, and more into one place. This universal view ensures everyone works with the same information. Integrations optimize workflows and save time by automating data sharing and analysis. You do not waste hours switching between tools or searching for updates. Instead, you get a clear, user-friendly view of your business.
Feature
Benefit
Data Visualization
Easier analysis and interpretation
Collaboration
Real-time sharing of insights
Real-time Analytics
Timely decisions with current information
FineReportsupports all these features. You can customize dashboards, accessreal-time analytics, use mobile dashboards, and integrate with your existing systems. These strengths help you solve common management challenges and improve efficiency.
Practical Value and Use Cases of Manager Dashboard
Improving Team Performance
You can use a manager dashboard to boost your team’s performance. The dashboard gives you instant access to progress updates, campaign results, and recognition data. You see which projects move quickly and where your team needs support. When you track goals and celebrate achievements, you motivate your team to work harder. The table below shows measurable improvements that teams experience when they use a manager dashboard:
Improvement Type
Measurable Result
Campaign Cycle Speed
25% faster
Goal Attainment
2x faster
Peer-to-Peer Recognition
40% more
Burnout and Disengagement Drop
Noticeable decrease
You notice fewer delays and more recognition among team members. The manager dashboard also improves communication. Built-in collaboration features keep all project discussions in one place. Everyone stays aligned on decisions and tasks.
A manager dashboard transforms how you manage sales. You track sales performance in real time and see which metrics drive growth. You make decisions based on accurate data, not assumptions. The dashboard gives your sales team full transparency and accountability. The table below highlights the value of sales dashboards:
Value of sales dashboards
Why it matters
Real-time visibility into reps’ sales performance
Instantly assess progress toward goals and keep everyone focused
Clear understanding of important sales metrics
Identify high-impact KPIs and track them over time
Improved decision-making with accurate sales data
Make confident, quick decisions grounded in facts
Full transparency across the entire sales team
Build alignment and strengthen collaboration
More granular tracking of specific sales activities
Pinpoint productive behaviors and replicate success
Streamlined management of sales pipeline dashboard
Spot stalled deals, risks, and opportunities at a glance
Deeper understanding of active sales opportunities
Prioritize follow-up and focus on high-value deals
Ability to visualize your sales analytics instantly
See patterns, forecast trends, and enable smarter strategies
You simplify pipeline reviews and identify opportunities faster. The manager dashboard helps you visualize sales analytics and forecast trends with ease.
FineReport’s manager dashboard played a key role in BOE’s digital transformation. BOE used dashboards to unify data from multiple sources and standardize performance metrics. The company reduced inventory costs by 5% and increased operational efficiency by 50%. Managers gained a single source of truth for all business data. They monitored KPIs and benchmarked performance across factories. The manager dashboard improved communication, reduced manual reporting, and helped BOE make faster, data-driven decisions. You can achieve similar results by adopting a manager dashboard that centralizes your business insights.
You need a manager dashboard to lead with clarity and confidence. This tool empowers you to makedata-driven decisions, automate routine tasks, and focus on strategic goals. You gain continuous feedback, recognize top performers, and improve team performance.
Access a wealth of case studies, industry insights, and solution guides to accelerate digital transformation.
FAQ
What is the main purpose of a manager dashboard?
You use a manager dashboard to see all your important data in one place. This tool helps you track performance, spot trends, and make quick decisions. You stay organized and focused on your goals.
How does a manager dashboard improve team performance?
A manager dashboard gives you real-time updates on your team’s progress. You can see who meets targets and who needs support. This visibility helps you guide your team and celebrate achievements.
Can you customize a manager dashboard for your business needs?
Yes, you can customize a manager dashboard. You choose which metrics to display and how to arrange them. This flexibility lets you focus on what matters most for your team or business.
Is a manager dashboard accessible on mobile devices?
You can access a manager dashboard on your phone or tablet. This feature lets you check updates and make decisions wherever you are. Mobile access supports remote work and fast responses.
How does FineReport support manager dashboards?
FineReport helps you build and manage powerful manager dashboards. You connect to many data sources, automate reports, and view real-time analytics. FineReport makes it easy to track key metrics and improve decision-making.