If you search for Power BI vs Tableau: Which BI Dashboard Software is Best?, you will see Power BI stands as the market leader by user satisfaction and Gartner’s latest ranking. The 2025 Gartner Magic Quadrant lists both Power BI and Tableau as Leaders, while FineBI continues to gain traction among business users.
You want a business intelligence tool that balances strong data visualization, ease of use, and integration. Tableau impresses with advanced visual capabilities, and FineBI offers self-service analytics with robust governance. When choosing a business intelligence solution, you should consider cost, dashboard flexibility, performance, scalability, and how well the software fits your business.
You want to know which BI dashboard software leads. Power BI holds the top spot in market share, with 20% of the market, followed by Tableau at 16.4%. FineBI continues to grow, especially among business users who need self-service analytics and strong governance. According to the latest Gartner Magic Quadrant and user ratings, Power BI remains the most widely adopted business intelligence tool. Tableau stays close behind, while FineBI gains recognition for its enterprise-ready features and ease of use.
| BI Tool | Market Share (%) |
|---|---|
| Power BI | 20 |
| Tableau | 16.4 |
| FineBI | N/A |
You see Power BI dominate because it integrates well with Microsoft tools and offers a familiar experience for Excel users. Tableau Desktop stands out for its creative visualizations and flexible data exploration. FineBI appeals to organizations that want to empower business users with self-service dashboards and maintain centralized control.
When you compare Power BI vs Tableau, you notice each tool brings unique advantages. Power BI offers an intuitive interface, especially for those who use Excel. It provides seamless integration with Microsoft 365 and Azure, making it a natural fit for many companies. Tableau Desktop delivers unmatched visual creativity and customization. You can build interactive dashboards with deep drill-downs and advanced chart types. FineBI focuses on self-service analytics, allowing you to connect to multiple data sources, prepare data visually, and create dashboards without coding.
Here is a quick comparison of their most cited strengths:
| Feature | Power BI Strengths | Tableau Desktop Strengths | FineBI Strengths |
|---|---|---|---|
| Ease of Use | Intuitive for Excel users, shallow learning curve | Visually intuitive, creative exploration | Zero-code, guided workflows for all users |
| Data Connectivity | Integrates with Microsoft tools | Connects to many data sources | 60+ connectors, big data, APIs, files |
| Visualization and Dashboarding | Basic charts, easy configuration | Superior visuals, deep customization | 60+ chart types, interactive dashboards |
| Performance with Large Datasets | Handles large datasets, can degrade | Optimized, fast and scalable | High-performance engine, 10,000+ users supported |
| Advanced Analytics | Azure ML, AI visuals | R, Python, statistical visuals | AI-driven insights, predictive analytics |
| Collaboration and Sharing | Microsoft ecosystem | Tableau Server/Online | Role-based sharing, audit trails |
| Cost and Licensing | Cost-effective for small businesses | Higher investment, more for large-scale needs | Lower TCO, scalable for all sizes |
| Community and Support | Large Microsoft community | Creative, visual-focused community | Enterprise support, growing user base |
You see Tableau Desktop excel in visual storytelling and creative dashboards. Power BI stands out for cost efficiency and integration with Microsoft environments. FineBI gives you a balance of self-service, governance, and high performance.
You may wonder where each BI dashboard software shines. Power BI vs Tableau: Which BI Dashboard Software is the Best? The answer depends on your business needs and scenarios.
Here is a summary of where each tool outperforms:
| Feature | Power BI Advantages | Tableau Desktop Advantages | FineBI Advantages |
|---|---|---|---|
| Data Modeling | Robust, handles complex relationships | Flexible, visual-first | Visual modeling, easy for non-IT users |
| ETL Capabilities | Integrated, strong for business logic | Intuitive grouping | Visual ETL, flexible data preparation |
| Time Intelligence Functions | Superior, ideal for financial analysis | Engaging exploratory experiences | Real-time analysis, alerts |
| Ideal Use Cases | Financial analytics, Microsoft-centric companies | Data visualization, creative exploration | Self-service, hybrid data, enterprise governance |
You should choose Power BI if your organization relies on Microsoft tools and needs advanced modeling. Tableau Desktop is your best choice for creative analytics and visual exploration. FineBI is ideal if you want to democratize analytics, support hybrid data environments, and ensure strong governance.
This quick verdict sets the stage for a deeper comparison. In the next sections, you will see how each business intelligence tool performs in core features, ease of use, data visualization, integration, cost, and more. You will find actionable recommendations to help you decide which BI dashboard software fits your business best.

When you compare Power BI vs Tableau: Which BI Dashboard Software is the Best?, you see each platform brings unique strengths to data analysis. Power BI integrates seamlessly with Microsoft 365 and Azure, making it a natural choice for organizations already using Microsoft products. Tableau connects to a wide range of sources and supports advanced dashboard storytelling, which helps you create engaging visual narratives. FineBI stands out with over 60 connectors, big data integration, and FineDataLink for real-time data analysis. You can use FineBI to build dashboards with 40+ chart types and custom visuals, supporting both narrative reports and interactive analysis.
Here is a quick table to help you compare the core features:
| Feature | Power BI | Tableau | FineBI |
|---|---|---|---|
| Integration | Microsoft 365, Azure, many connectors | Diverse sources, strong API support | 60+ connectors, big data, FineDataLink |
| Visualization | Hundreds of native charts, custom visuals | Advanced charts, dashboard storytelling | 40+ chart types, narrative reports, custom |
| Pricing | ~$10/user/month (Pro) | ~$70/user/month (Creator) | Flexible, cost-effective for large deployments |
| Scalability | Easy for Microsoft-centric enterprises | Handles large data sets | High-performance, 10,000+ users, real time |
| AI Capabilities | Natural language Q&A, automated insights | Improving AI, strong exploration | AI-powered dashboards, predictive modeling |
| Security | Enterprise-grade, Active Directory | High-level, manual configuration | Role-based, row-level, audit logs |
You need to choose bi dashboard software that matches your team’s skills and business goals. Power BI works best for business analysts and organizations that rely on Microsoft tools. You get strong data analysis and modeling features, which help you manage financial analytics and reporting. Tableau suits users who want creative control over data visualization and dashboard storytelling. You can use Tableau for deep analysis and interactive exploration, which appeals to data analysts and designers.
FineBI fits business users who want self-service analytics and real-time data analysis. You do not need coding skills to prepare data or build dashboards. FineBI supports large enterprises that require centralized governance, role-based access, and collaborative analysis. You can use FineBI in industries like manufacturing, banking, and retail, where teams need to analyze data from multiple sources and share insights quickly.
Tip: If your organization values agility, self-service, and enterprise-level control, FineBI offers a balanced solution for both business users and IT teams.
You should consider your team’s experience, the complexity of your data analysis needs, and your budget when selecting the right bi dashboard software. Each tool supports different workflows, so matching features to your business fit ensures you get the most value from your analytics investment.

When you compare Power BI vs Tableau: Which BI Dashboard Software is the Best?, you notice that user experience plays a major role in adoption. Power BI offers a familiar interface for those who use Excel. You can find menus and options that look similar to other Microsoft products. Tableau provides a visually engaging workspace. You can drag and drop data fields to create charts quickly. FineBI focuses on usability for all users. You do not need coding skills to start building dashboards. The interface guides you step by step, making it easy to explore data and create reports.
You want a BI tool that helps your team get started fast. Power BI provides many online tutorials and a large community. You can find answers to most questions with a quick search. Tableau offers guided learning paths and hands-on exercises. You can practice with sample datasets and follow video lessons. FineBI supports new users with clear documentation and interactive guides. You can follow built-in workflows that show you how to connect data, prepare it, and build dashboards. This approach reduces the time needed for onboarding and helps you become productive quickly.
Tip: Choose a BI tool with strong onboarding resources if your team has limited experience with analytics.
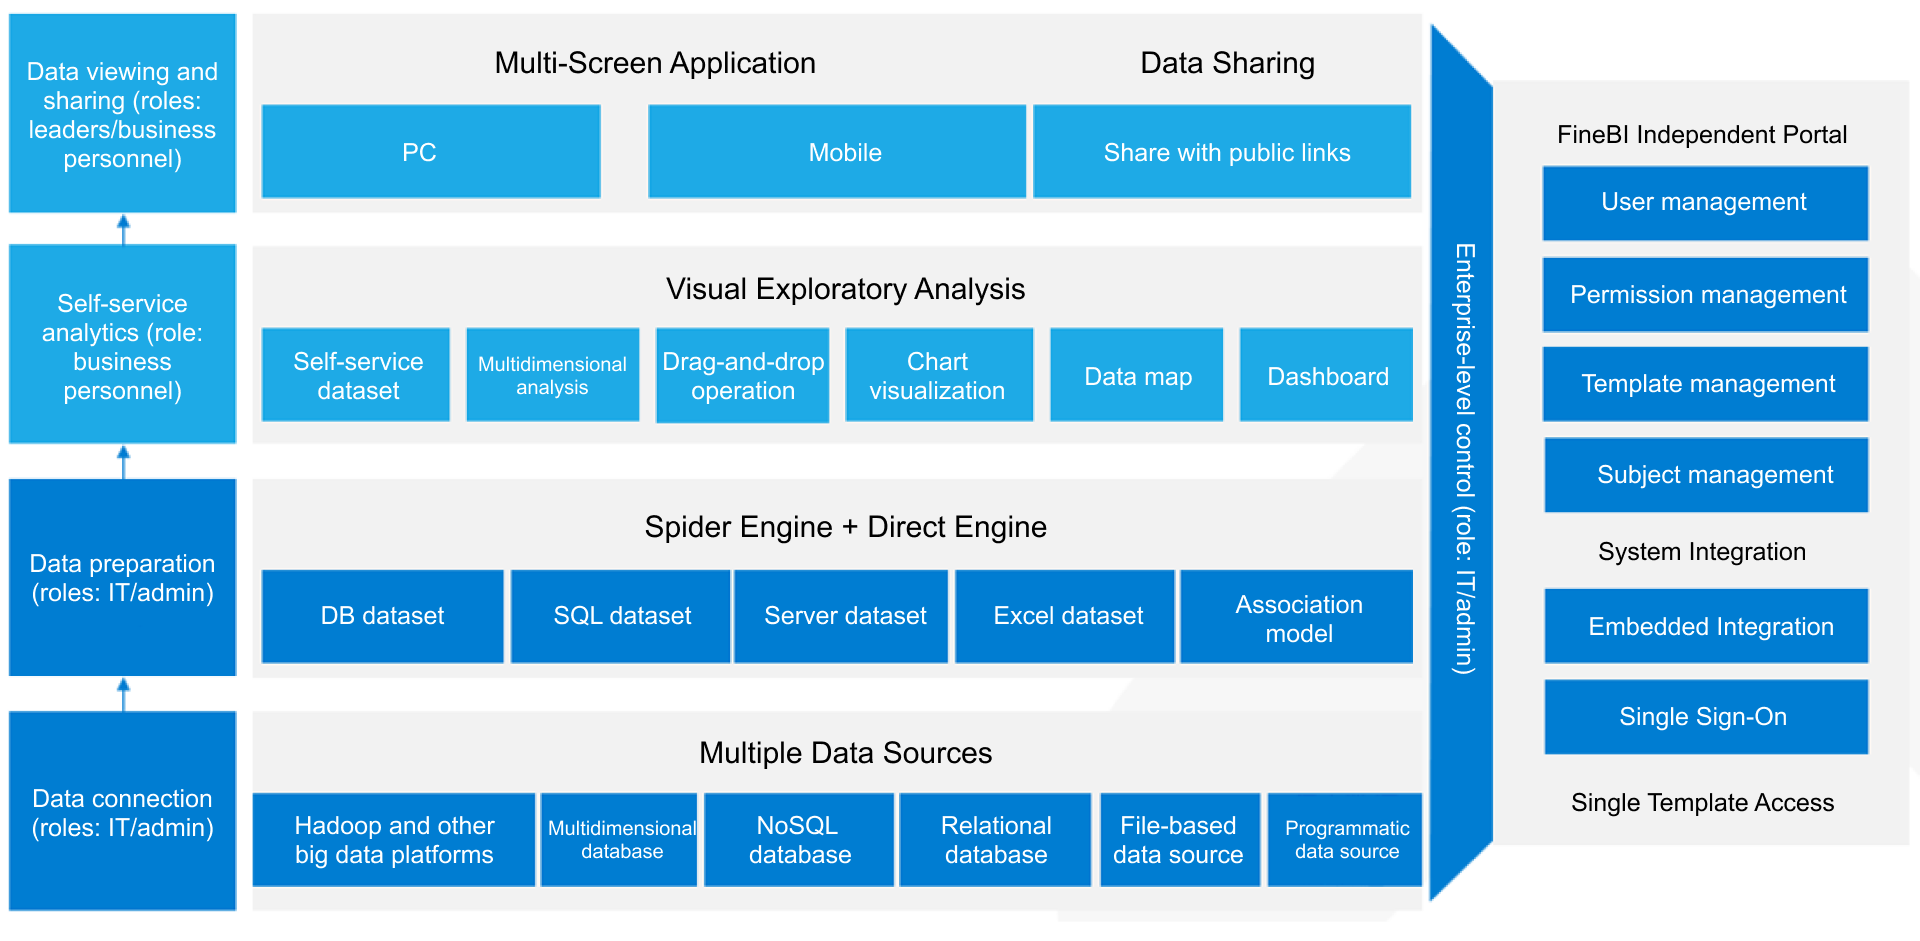
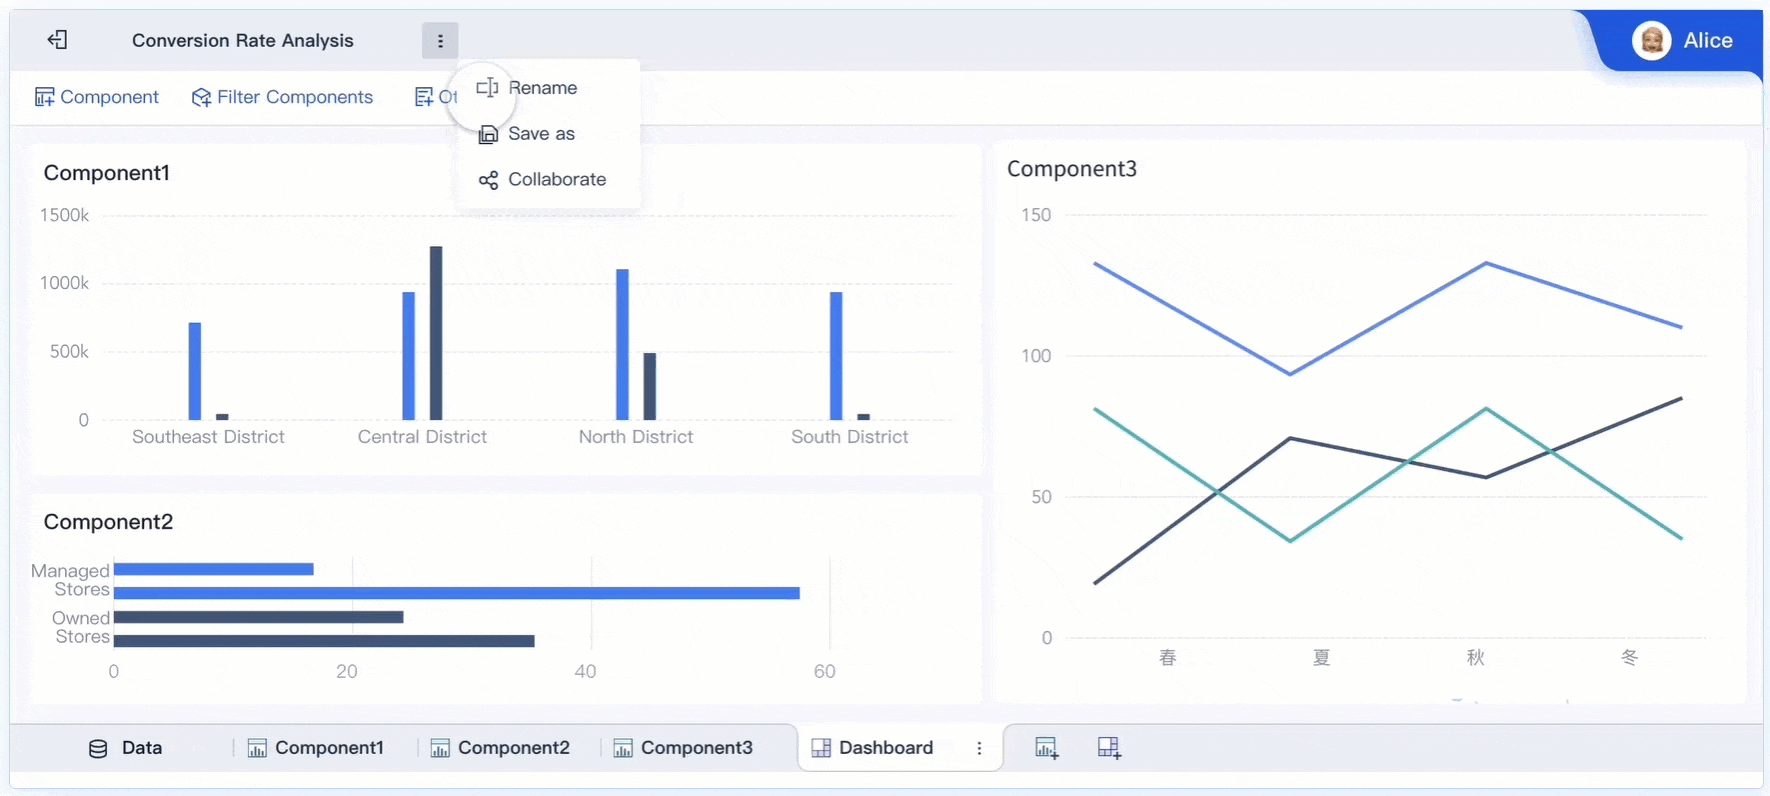
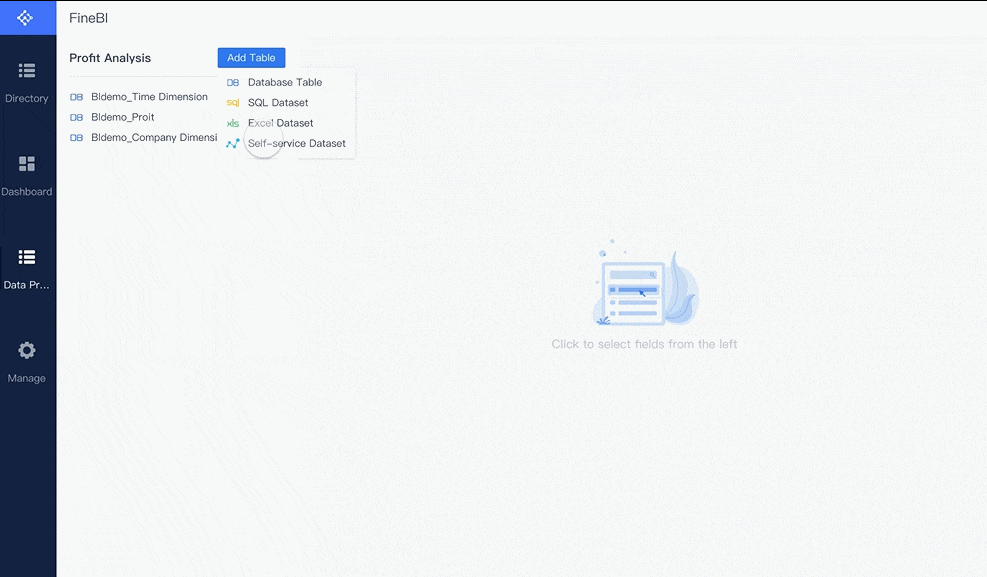
FineBI stands out for its self-service design. You can connect to over 60 data sources, including databases, cloud platforms, and files. The drag-and-drop dashboard builder lets you create visualizations without writing code. You can clean and prepare data using visual tools. FineBI also supports collaboration. You can share dashboards with your team and set role-based permissions. This makes it easy for everyone to access the right information and make data-driven decisions. FineBI’s approach empowers business users and improves usability across your organization.

When you compare Power BI vs Tableau: Which BI Dashboard Software is the Best?, you see that each platform offers strong data visualization features. Power BI gives you a wide range of built-in charts and visual dashboards. You can use bar charts, line graphs, and maps to present your data. Tableau stands out for advanced data visualization and creative dashboard layouts. You can build visual dashboards with deep customization and interactive elements. FineBI provides over 60 chart types and 70 styles, including advanced data visualization options like Gantt charts, Sankey diagrams, and waterfall charts. You can drag and drop to create data visualizations that fit your business needs. FineBI also supports responsive design, so your dashboards look great on any device.
Note: If you want to empower your team with easy-to-use data visualization tools, all three platforms offer strong options. FineBI’s zero-code interface makes it simple for anyone to build advanced data visualizations.
You need data analytics software that supports advanced analysis. Power BI, Tableau, and FineBI each bring unique features for analytics. Power BI supports Data Analysis Expressions (DAX) and M language. You can connect to R for enterprise-level analytics. Tableau integrates with R and supports Python for machine learning and forecasting. FineBI offers AI-driven insights and predictive analytics, helping you uncover trends and make better decisions. You can use these data analytics tools to perform real-time analysis and automate alerts for important metrics.
Here is a quick comparison of advanced analytics features:
| Feature | Power BI | Tableau | FineBI |
|---|---|---|---|
| Programming Support | DAX, M language, R (enterprise) | R, SDK (C, C++, Java, Python) | Python, Java SDK, DEF function |
| Machine Learning | Azure ML, SQL Server Analysis Services, real-time | Python, forecasting, machine learning operations | Predictive analytics, AI |
You can see that each platform supports advanced data visualization and analytics, but the approach and integration options differ.
FineBI gives you the power to create interactive dashboards that drive real-time decision-making. You can connect to over 60 data sources, including big data platforms and cloud services. The drag-and-drop builder lets you design visual dashboards with advanced data visualization features. You can apply real-time filters, set up alerts, and use AI-powered tools to interpret your data visualizations. FineBI’s dashboards support collaboration, so your team can share insights and work together. You can access dashboards on any device, making it easy to stay informed wherever you are.
Tip: FineBI’s interactive dashboards help you move from static reports to dynamic, real-time data visualizations. This approach supports faster, more informed decisions across your organization.

You need strong integration when you choose a BI dashboard software. Power BI, Tableau, and FineBI each offer broad options for connecting to data. Power BI lets you connect to Microsoft SQL Server, Excel, and many cloud services. Tableau supports a wide range of databases, files, and web data connectors. FineBI gives you over 60 out-of-the-box connectors. You can link to relational databases, cloud data warehouses, big data platforms, and APIs. This level of integration means you can bring together data from many sources for unified analytics. FineBI also supports file uploads, API connections, and custom connectors using SDKs. You can schedule data updates and keep your dashboards current. This flexibility in integration helps you manage data from different business systems without extra work.
You want your BI tool to fit into your existing technology stack. Power BI, Tableau, and FineBI all provide integration with major cloud ecosystems. You can store files on AWS, Azure, Google Cloud, or on-premises devices. Centralized key management is available on AWS and Azure, which helps you control encryption keys. Each tool offers a content migration tool. You can move dashboards and reports between projects or sites without coding. This compatibility ensures your integration process stays smooth as your business grows. The table below shows how these tools support cloud integration features:
| Feature | Description |
|---|---|
| External file storage | Supports AWS, Azure, GCP, and on-premises NAS devices for file storage. |
| Centralized Key Management | Available on AWS and Azure for managing encryption keys. |
| Content Migration Tool | Facilitates migration of content between projects and sites without coding. |
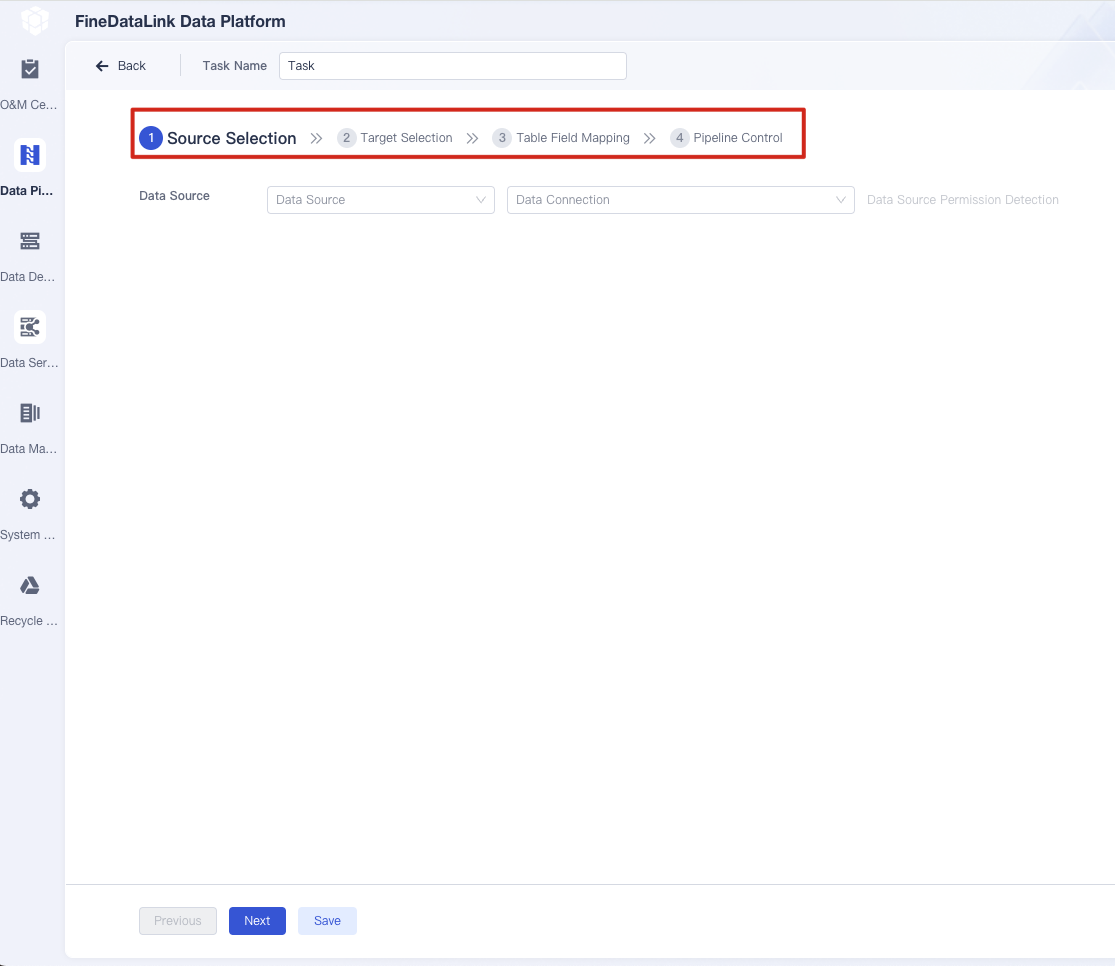
FineBI stands out for its integration strengths. You can connect to big data platforms like Hadoop and Spark, as well as traditional databases such as MySQL and Oracle. FineBI’s integration with FineDataLink lets you streamline data pipelines and perform advanced ETL operations. You can use JDBC or ODBC drivers for custom integration with legacy systems. FineBI also supports real-time data fetching from APIs and scheduled updates. This approach ensures your dashboards always reflect the latest information. With role-based access and audit trails, you maintain control over your data during integration. FineBI’s integration capabilities help you unify data, improve analytics, and support business decisions with reliable connectivity.
When you compare Power BI vs Tableau: Which BI Dashboard Software is the Best?, you see that each platform uses a different pricing model. Power BI offers a subscription-based plan, which starts at around $10 per user per month for the Pro version. This model works well for small teams and organizations that want predictable costs. Tableau uses a tiered pricing structure. The Creator license costs about $70 per user per month, while Explorer and Viewer licenses cost less but offer fewer features. FineBI provides flexible licensing options that scale with your deployment size. You can choose plans that fit your team, whether you need a few users or thousands.
Tip: Review your team size and feature needs before selecting a pricing model. This helps you avoid paying for features you do not use.
You should consider the total cost of ownership (TCO) when you evaluate BI dashboard software. TCO includes licensing, support, training, and infrastructure costs over time. For a mid-sized business, Power BI’s average annual TCO ranges from $15,000 to $30,000. Tableau’s TCO is higher, usually between $30,000 and $60,000 or more per year. FineBI offers a cost-effective solution, especially for organizations that want to scale analytics across many users.
| Tool | Average Annual TCO |
|---|---|
| Microsoft Power BI | $15,000 - $30,000 |
| Tableau | $30,000 - $60,000+ |
You can see that Power BI is more budget-friendly for most companies, while Tableau’s advanced features come at a higher price. FineBI’s flexible plans help you manage costs as your organization grows.
The value you get from Power BI vs Tableau: Which BI Dashboard Software is the Best? depends on your company’s size and needs. Small businesses often choose Power BI for its user-friendly interface and integration with Microsoft tools. Mid-sized companies prefer Tableau for its scalable features and AI-driven analytics. Large enterprises select Tableau for advanced analytics and strong security. FineBI delivers value to organizations of all sizes by offering self-service analytics, high performance, and enterprise-grade governance.
| Business Size | Recommended Software | Key Features |
|---|---|---|
| Small Businesses | Power BI | User-friendly, integrates well with Microsoft tools |
| Mid-sized Companies | Tableau | Scalable features, AI-driven analytics |
| Large Enterprises | Tableau | Advanced analytics, strong security features |
You should match your choice to your business goals, team skills, and growth plans. This approach ensures you get the best return on your investment in analytics.
When you work with business intelligence tools, you often need to analyze large datasets. Power BI, Tableau, and FineBI each offer solutions for handling data volumes that exceed 1TB. Power BI requires Premium or Fabric Capacity to manage these large datasets. This gives you increased storage and processing power. You can use incremental refresh to load only new or updated data, which saves time and resources. Power BI also recommends storing raw data in Azure Data Lake or Azure Synapse to optimize performance. DirectQuery mode can help reduce memory usage, but you need to optimize your queries for the best results. Dataflows allow you to preprocess data, but you must use Premium or Fabric Capacity for larger sizes. For complex transformations, external ETL tools are often the best choice.
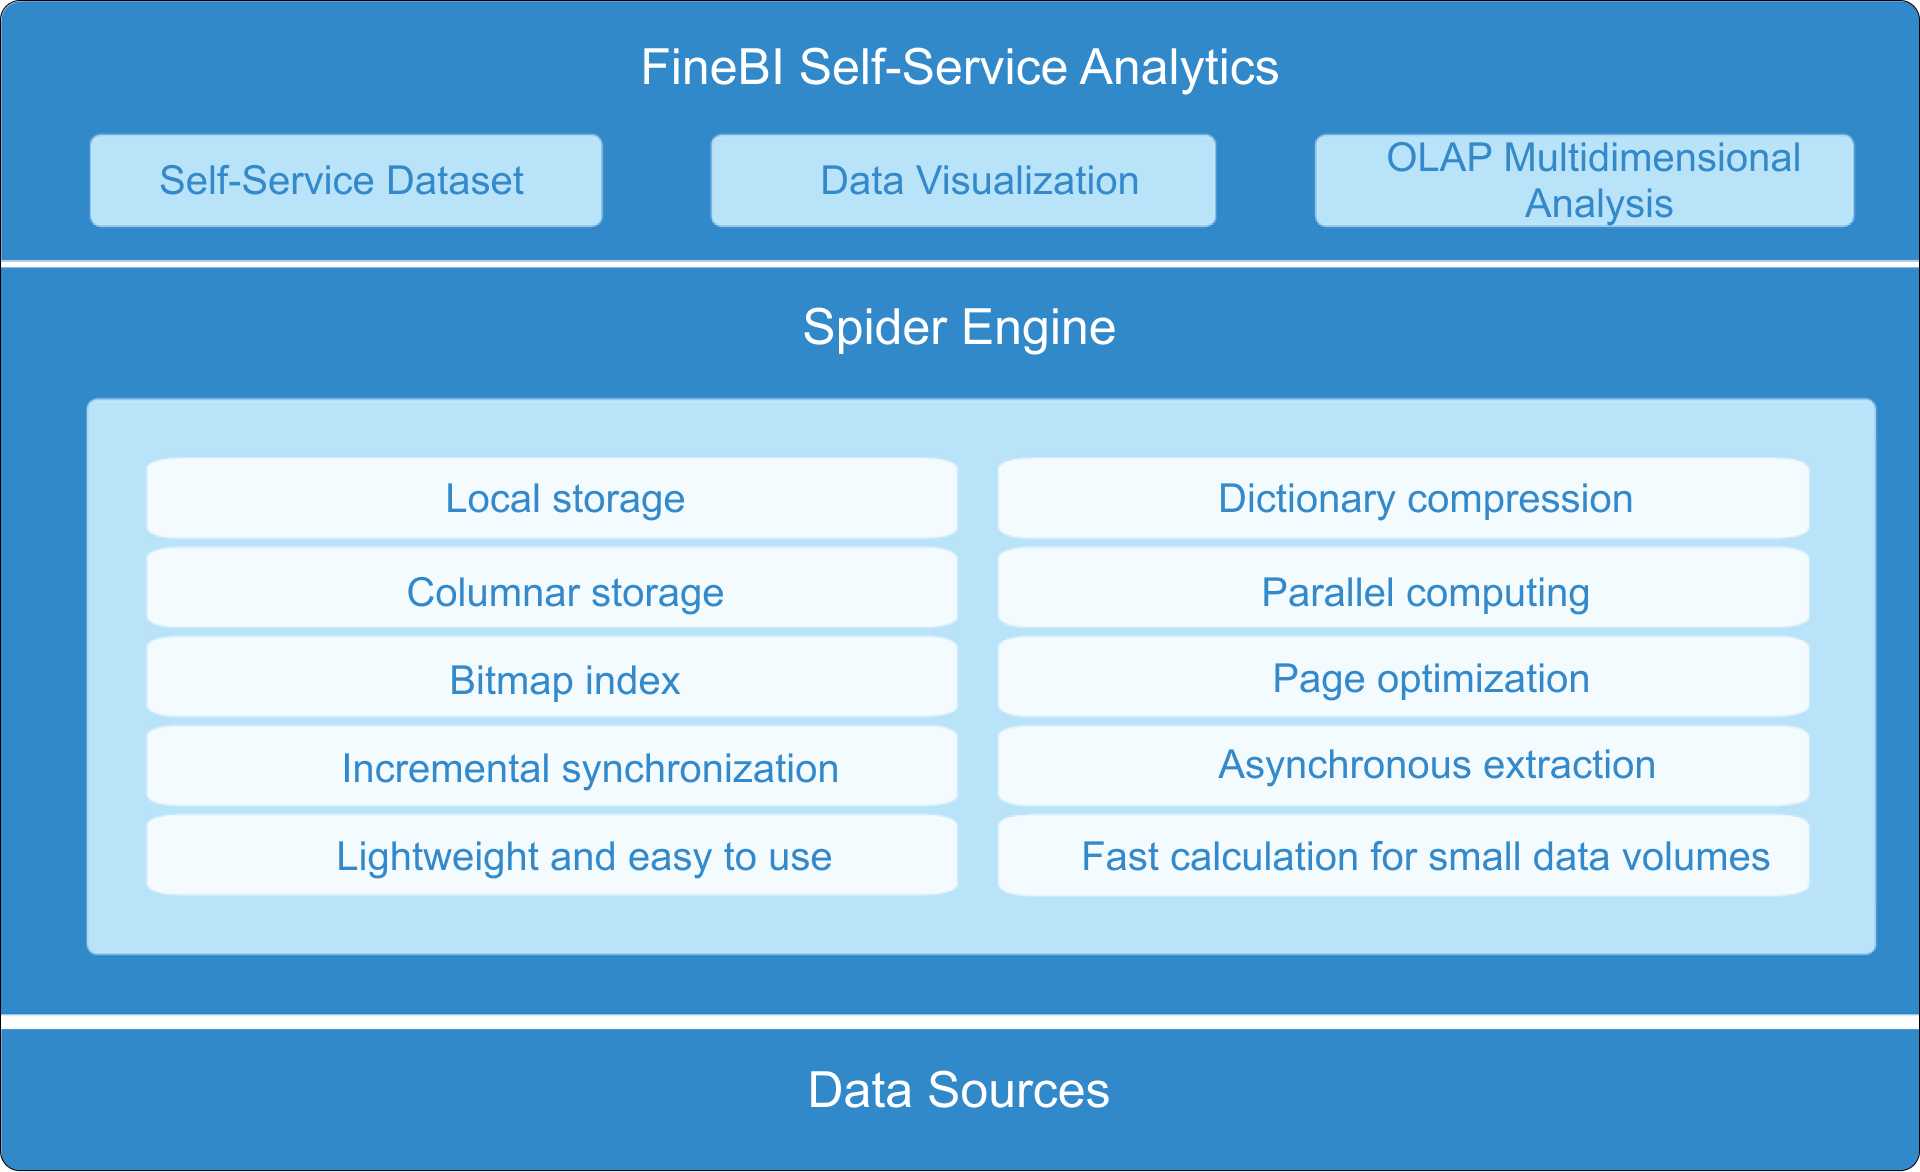
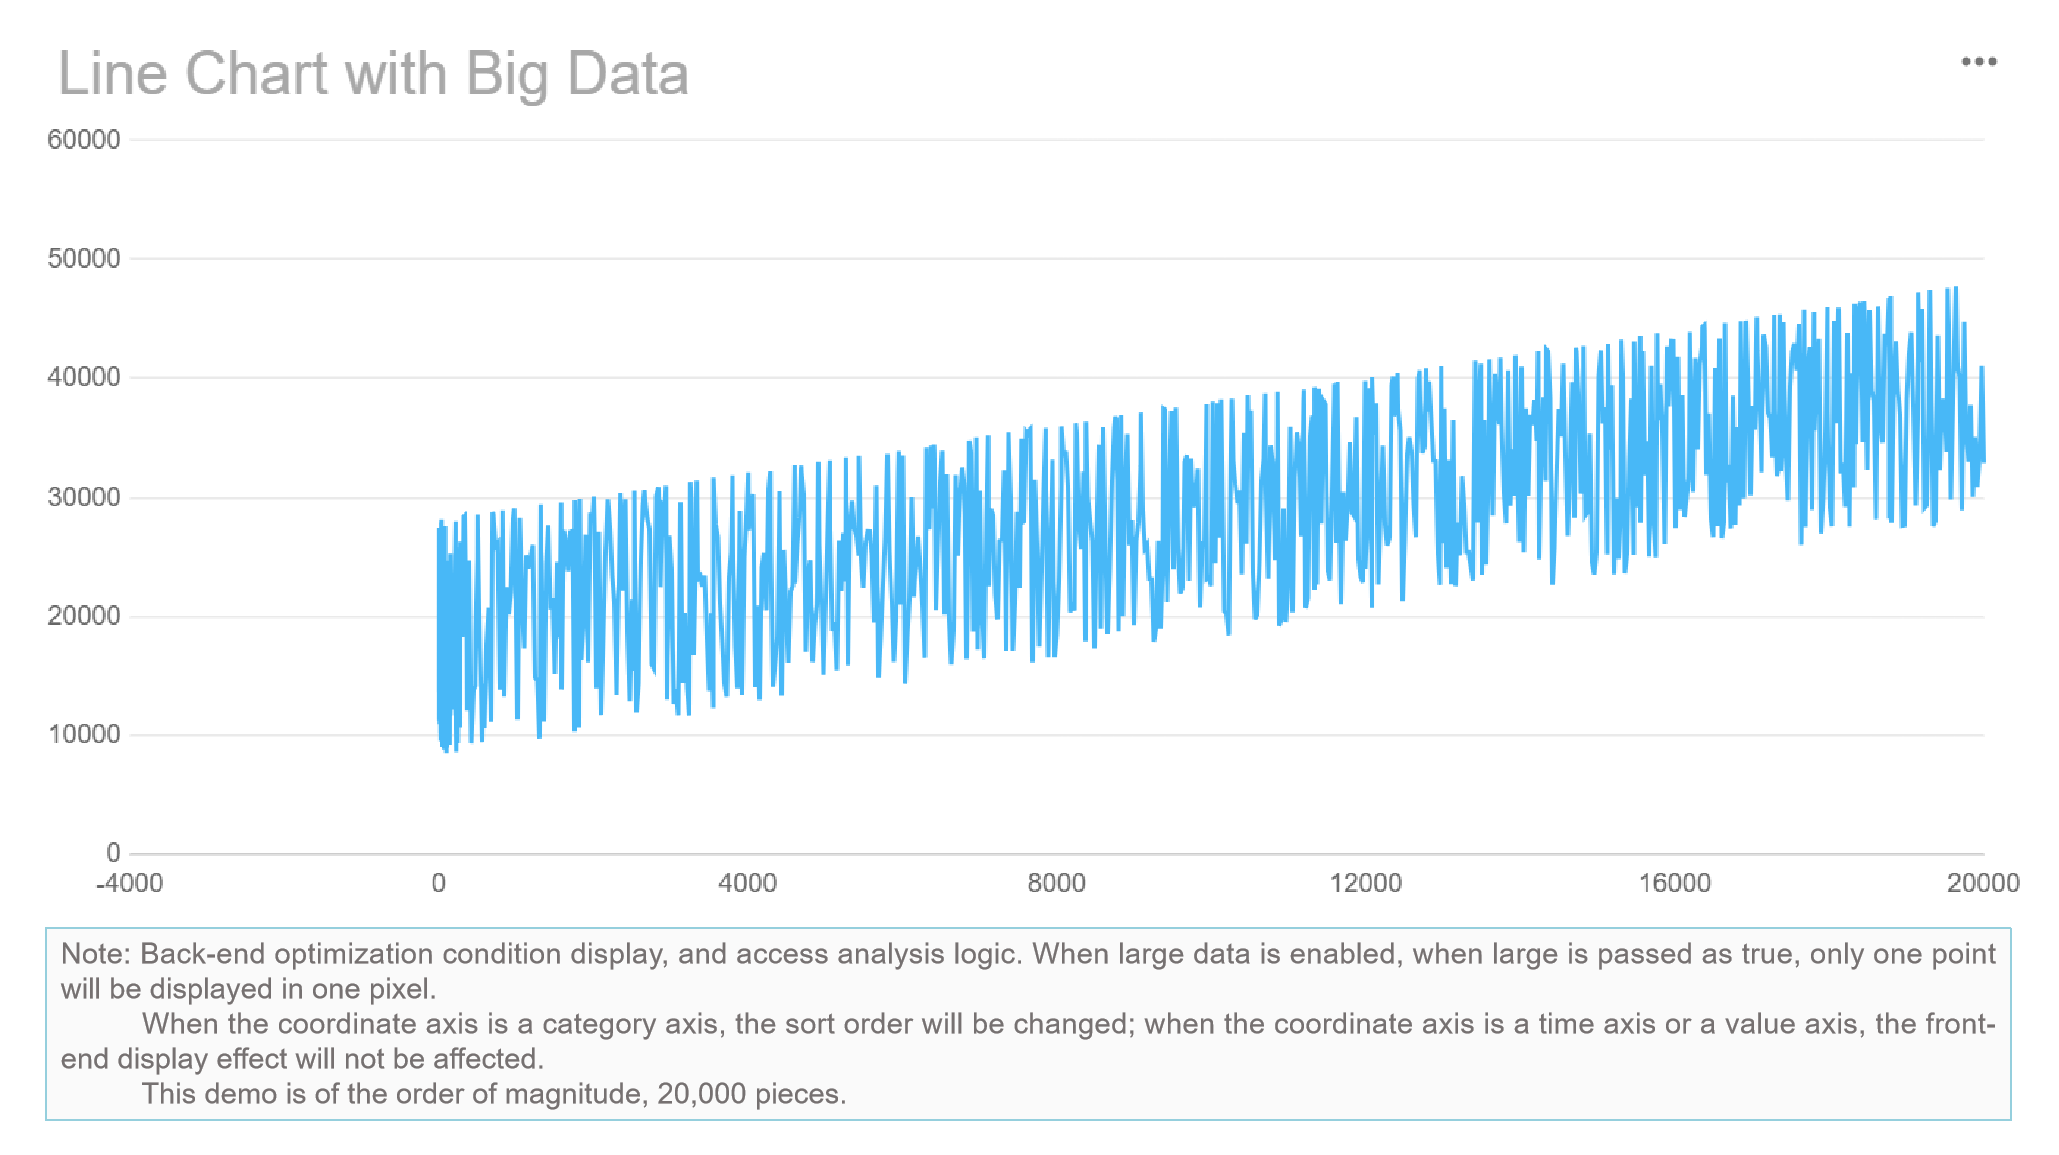
Tableau supports large datasets with optimized in-memory engines and live connections. You can connect directly to databases or use extracts for faster performance. FineBI uses a high-performance computing engine that supports more than 10,000 users viewing data online at the same time. You can process massive datasets and perform real-time analysis, which is essential for enterprise-level analytics.
| Feature | Description |
|---|---|
| Premium or Fabric Capacity | Necessary for managing large datasets, providing increased storage and processing capabilities. |
| Incremental Refresh | Allows loading only new or updated data, critical for large datasets. |
| Storage Strategy | Suggests using Azure Data Lake or Azure Synapse for raw data storage to optimize performance. |
| DirectQuery vs Import Mode | DirectQuery can reduce memory requirements but may impact performance if not optimized. |
| Dataflows | Useful for preprocessing data, but size limits necessitate Premium or Fabric Capacity. |
| External ETL Tools | Recommended for complex transformations or aggregating data from multiple sources. |
You need flexibility in how you deploy your BI dashboard software. Power BI, Tableau, and FineBI offer different deployment options. Power BI supports cloud (SaaS), on-premises, and hybrid deployments. You can use Power BI Report Server on Azure VMs if you have the right licenses. Hybrid deployments let you mix cloud and on-premises solutions for maximum control. Tableau also supports both cloud and on-premises deployments. FineBI provides deployment options that fit enterprise needs, allowing you to choose the best environment for your data and security requirements.
| Tool | Deployment Options |
|---|---|
| Power BI | Cloud (SaaS), On-Premises, Hybrid |
| Tableau | Cloud, On-Premises |
| FineBI | Flexible enterprise deployment |
Note: You should match your deployment choice to your data governance and compliance needs.
FineBI stands out with its high-performance engine. You can process massive datasets and support thousands of users at once. FineBI’s engine uses advanced memory management and parallel processing. This ensures fast dashboard loading and real-time analytics, even with complex data models. You can connect to big data platforms, cloud warehouses, and traditional databases. FineBI’s architecture supports both ETL and ELT workflows, so you can prepare and analyze data efficiently. With FineBI, you gain the scalability and speed needed for modern business intelligence.
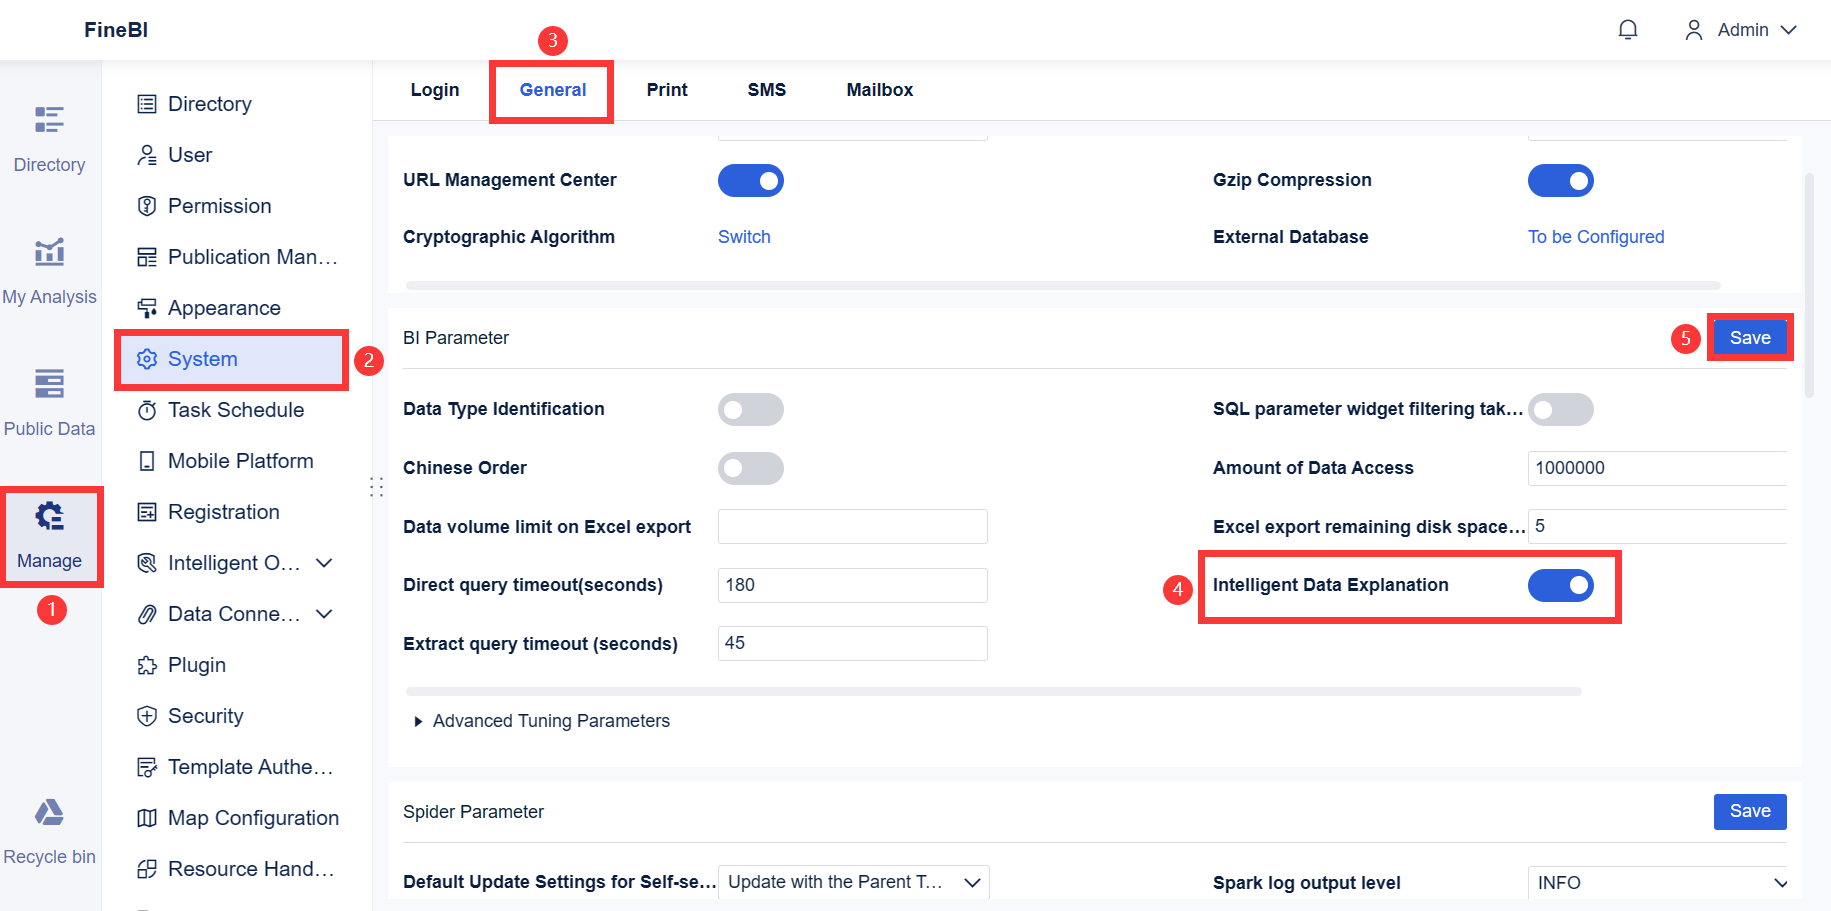
You need strong data security when you choose a BI dashboard software. Power BI, Tableau, and FineBI each offer enterprise-grade security features. Power BI uses Microsoft’s security framework, including encryption at rest and in transit, multi-factor authentication, and integration with Azure Active Directory. Tableau provides granular permissions, data encryption, and secure sharing options. FineBI supports role-based access control, row-level security, and audit logs. You can mask sensitive data for specific departments and monitor user activity. These features help you protect business data and maintain privacy across your organization.
| Tool | Security Highlights |
|---|---|
| Power BI | Encryption, MFA, Azure AD integration |
| Tableau | Granular permissions, encryption, secure sharing |
| FineBI | Role-based access, row-level security, audit logs |
Note: You should review your organization’s security policies before selecting a BI dashboard software.
Compliance is essential for organizations in regulated industries. Power BI vs Tableau: Which BI Dashboard Software is the Best? Both tools support compliance standards such as GDPR, HIPAA, and SOC. Power BI integrates with Microsoft’s compliance center, making it easier to manage data governance. Tableau offers customizable access controls and audit trails. FineBI provides flexible permission management based on department, role, and responsibility. You can assign access rights, mask sensitive information, and ensure only authorized users view critical data. FineBI’s audit logs help you track changes and maintain compliance with industry standards.
Tip: Set up regular audits and permission reviews to strengthen your data governance.
FineBI stands out for its enterprise governance capabilities. You can centralize data access, enforce row-level security, and monitor user actions. FineBI’s governance tools allow you to balance self-service analytics with strict control. You can assign permissions at the report, dataset, or even data row level. FineBI supports audit trails, so you can track who accessed or modified data. This approach helps you maintain compliance and protect sensitive information. FineBI’s enterprise governance ensures your organization meets regulatory requirements while empowering users to explore data independently.
FineBI’s governance features make it a strong choice for organizations that need both agility and control in their analytics environment.
Choosing the right bi dashboard software depends on your business size, goals, and how your teams use data visualization and dashboards. You need a solution that fits your workflow, supports collaboration and sharing, and delivers actionable data insights. Let’s break down the best choices for different scenarios.
You run a small business and want a dashboard that is easy to set up, cost-effective, and supports quick reporting. Many small businesses prefer tools with simple data visualization, affordable pricing, and straightforward sharing features. Recent expert reviews highlight several options:
| Software | Key Features | Pricing Structure |
|---|---|---|
| Klipfolio | All-in-one dashboard, real-time data access, easy report sharing | Free plan, Plus: $139/month, Pro: $299/month |
| DashThis | Custom KPI dashboards, supports 34+ technologies, automatic report sharing | 15-day trial, Individual: $39/month, Professional: $129/month |
| Plecto | Real-time KPI visualization, gamification features | 14-day trial, Medium: $250/month, Large: $390/month |
| Zoho Analytics | Integrates with multiple data sources, AI insights | 15-day trial, Basic: $30/month, Premium: $145/month |
| Scoro | Custom KPI tracking, project management integration | 14-day trial, Essential: $28/user/month, Pro: $71/user/month |
Power BI stands out for small businesses that already use Microsoft 365. You get seamless integration, familiar interfaces, and affordable licensing. You can create dashboards and share reports with your team easily. Tableau offers a free trial and flexible pricing, but its advanced visualization features may be more than you need if you want simple reporting. FineBI provides a cost-effective solution for small businesses that want self-service analytics and easy data visualization. You can connect to multiple data sources, build dashboards without coding, and share insights across your team.
Tip: If you want a balance of price, usability, and strong data visualization, Power BI and FineBI are top choices for small businesses. FineBI’s zero-code interface helps you get started quickly.
You manage a large organization and need bi dashboard software that scales, supports complex data environments, and enforces strict governance. Enterprises require advanced data visualization, robust reporting, and secure sharing. Power BI offers enterprise-grade security, integration with Azure, and strong data modeling. You can deploy dashboards across departments and control access with Active Directory. Tableau provides advanced visualization, predictive analytics, and flexible deployment options. You can build interactive dashboards and support collaboration and sharing at scale.
FineBI delivers enterprise-ready features for organizations that need centralized governance and high performance. You can connect to big data platforms, cloud warehouses, and traditional databases. FineBI’s high-performance engine supports over 10,000 users viewing dashboards online. You can assign role-based permissions, mask sensitive data, and track user activity with audit logs. FineBI’s enterprise governance tools help you balance self-service analytics with strict control.
Note: Enterprises benefit from FineBI’s ability to unify data from multiple sources, enforce security, and support large-scale collaboration and sharing.
You lead a data-driven team that values collaboration, fast data insights, and advanced analytics. You need bi dashboard software that supports interactive dashboards, real-time data visualization, and seamless sharing. Power BI, Tableau, and FineBI each offer features for collaborative analytics.
| Tool | Key Features | Pros | Cons | Pricing |
|---|---|---|---|---|
| Tableau | Customizable dashboards, data integration, predictive analytics | Intuitive visualization tools for non-technical users, seamless integration, supports advanced reporting | May require additional training for advanced features, performance can be impacted with very large datasets | 14-day free trial, Enterprise Creator - $115 user/month, Explorer - $70 user/month, Viewer - $35 user/month |
| ThoughtSpot | AI-powered search, real-time insights, embedded analytics | Natural language search, reduced IT dependency, integration with cloud platforms | Advanced features may require training, regular updates require teams to stay current | 14-day free trial, Essentials: $1,250/month (20 users), Pro: Custom, Enterprise: Custom |
Power BI supports collaboration and sharing through Microsoft Teams and SharePoint. You can co-author dashboards, comment on reports, and share data insights with your team. Tableau enables collaboration with customizable dashboards and advanced data visualization. You can integrate data from multiple sources and share interactive dashboards. FineBI empowers data-driven teams with self-service analytics, drag-and-drop dashboard creation, and real-time data visualization. You can collaborate on dashboards, share reports securely, and set up alerts for critical metrics.
Tip: For teams that want to move quickly from data to decision, FineBI’s interactive dashboards and AI-driven analytics make collaboration and sharing seamless.
You should choose FineBI when you want bi dashboard software that empowers business users, supports hybrid data environments, and enforces enterprise-level governance. FineBI stands out for its self-service analytics, zero-code dashboard creation, and flexible data visualization. You can connect to over 60 data sources, including big data platforms, cloud warehouses, and APIs. FineBI’s integration with FineDataLink streamlines data pipelines and supports advanced ETL operations.
FineBI’s enterprise governance features allow you to assign permissions by department, role, or responsibility. You can mask sensitive data, track user activity, and maintain compliance with industry standards. FineBI supports collaboration and sharing across teams, enabling everyone to access the right dashboards and data insights. You can build interactive dashboards, apply real-time filters, and use AI-powered tools to interpret your data.
FineBI is the best fit if you want to democratize analytics, unify data from diverse sources, and maintain strict control over data access and reporting. You gain agility, scalability, and security in one platform.
Summary Table: Scenario-Based Recommendations
| Scenario | Recommended BI Dashboard Software | Why It Fits Your Needs |
|---|---|---|
| Small Businesses | Power BI, FineBI | Affordable, easy setup, strong data visualization, sharing |
| Enterprises | FineBI, Power BI, Tableau | Scalable, secure, advanced governance, collaboration |
| Data-Driven Teams | FineBI, Tableau, Power BI | Interactive dashboards, real-time analytics, sharing |
| Hybrid Data Environments | FineBI | Connects to diverse sources, self-service, governance |
You should match your choice to your business goals, team skills, and data environment. FineBI offers a unique combination of self-service analytics, enterprise governance, and flexible data visualization. You can support collaboration and sharing, unify reporting, and empower every user to make data-driven decisions.
You have seen how Power BI, Tableau, and FineBI each lead in different areas. Power BI offers strong integration and cost efficiency. Tableau stands out for creative dashboards. FineBI gives you self-service analytics and enterprise governance. Review your business needs and team skills. Start with a free trial or demo to see which tool fits your workflow. This step helps you make the best choice for your analytics journey.

Best Dashboard Apps for Business Insights
What is a Call Center Dashboard and Why Does It Matter
What is a Reporting Dashboard and How Does it Work
What is An Interactive Dashboard and How Does It Work
What is a Call Center Metrics Dashboard and How Does It Work

The Author
Lewis
Senior Data Analyst at FanRuan
Related Articles

Payment Analytics Dashboard: 12 KPIs Every Operations Leader Should Track to Cut Revenue Leakage
Losing revenue to declines? Discover 12 essential KPIs to track in your payment analytics dashboard to stop leakage and manage disputes.
Lewis Chou
May 05, 2026

SOC Dashboard Explained: 12 Essential KPIs, Views, and Workflows Security Teams Use
Learn about SOC dashboards, the 12 essential KPIs for security teams, and how they centralize alerts and workflows for faster threat detection and response.
Lewis Chou
May 05, 2026

EMR Dashboard Guide: 12 Metrics to Track for Faster Clinical and Operational Decisions
Learn the 12 essential EMR dashboard metrics to track for faster clinical and operational decisions, improving patient flow and revenue cycle management.
Lewis Chou
May 05, 2026


