Market data analysis tools give you the ability to collect, process, and interpret data from multiple sources. These tools help you transform raw data into actionable insights, supporting every stage of your business analysis. In 2025, 80% of businesses will rely on market data analysis tools for decision-making.
| Year | Percentage of Businesses Using Market Data Analysis Tools |
|---|---|
| 2025 | 80% |
When you use the right data analytics tools, you can unlock a range of benefits:
- Higher success rates in product development
- More chances to discover new opportunities and revenue sources
- Superior product quality control and issue resolution
- Result-driven customer experience design
- Stronger customer acquisition and retention
- Improved operational efficiency and productivity
- Enhanced market competitiveness and financial success
Selecting the best marketing analytics tools ensures your team gains data-driven insights that support smarter decisions and measurable growth.
Top Market Data Analysis Tools

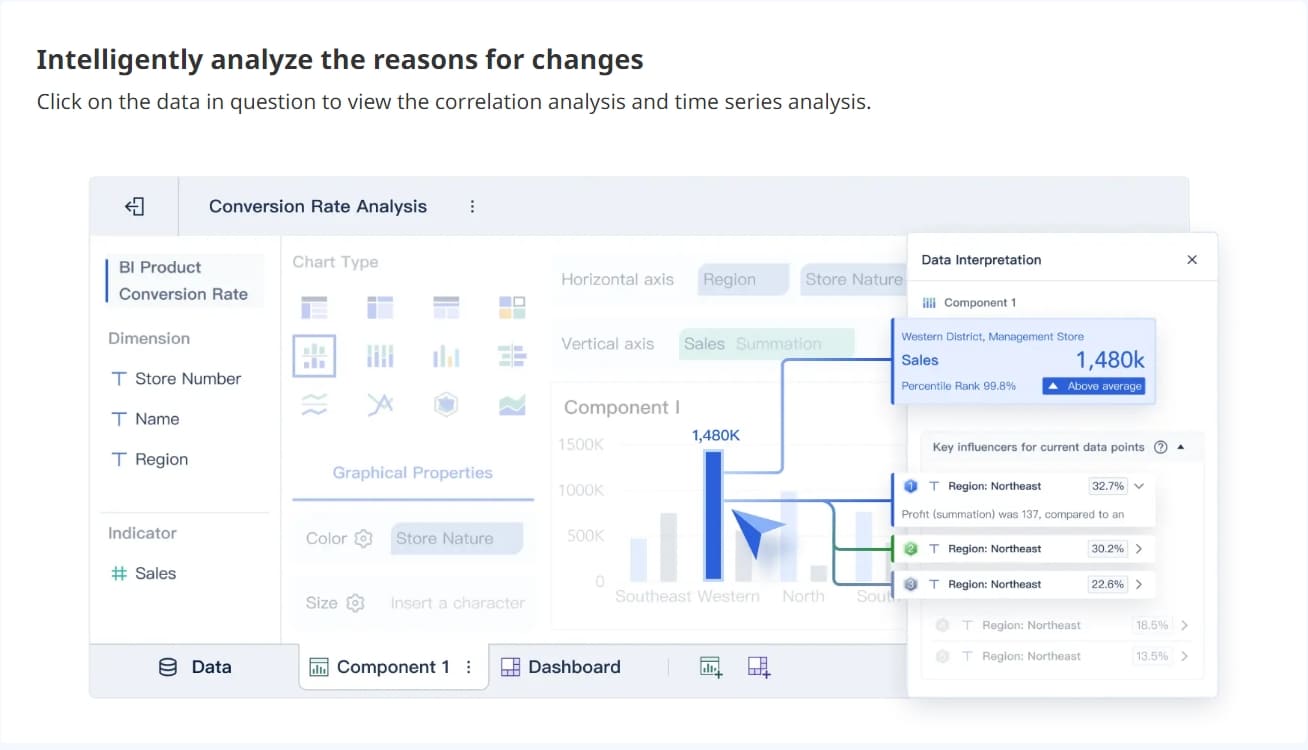
FineBI
FineBI stands out among market data analysis tools for its no-code, self-service approach. You can connect to over 60 data sources, including big data platforms, relational databases, and cloud warehouses. FineBI lets you prepare, analyze, and visualize data without writing code. Its drag-and-drop interface makes it easy for business users and analysts to create dashboards and reports.

| Key Features | Description |
|---|---|
| No-Code Real-Time Analytics | Perform analytics without coding, making it accessible to non-technical users. |
| Drag-and-Drop GUI | Build complex data visualizations through an intuitive interface. |
| Integrated ETL Tools | Prepare and transform data seamlessly within the platform. |
| Robust Data Modeling Features | Support advanced data modeling for comprehensive analysis. |
| Strong Mobile App Support | Access insights anytime, anywhere, with consistent quality across devices. |
| Scalability | Grow with your business, suitable for small to medium-sized businesses. |
| In-Memory Computing Engine | Fast response times even with large datasets. |
| Enterprise-Grade Security | Role-based access control and audit logging for enhanced data security. |
FineBI offers several advantages for your organization:
| Pros | Cons |
|---|---|
| Robust predictive analytics capabilities | Higher cost for premium features |
| User-friendly for non-technical teams | Limited mobile app functionality |
| Strong scalability for enterprise use | Onboarding may take time for complex setups |
You can use FineBI for a wide range of business scenarios. It works well for sales analysis, financial planning, HR metrics, and supply chain monitoring. FineBI is ideal if you want to empower business users to perform self-service analytics and reduce reliance on IT. Its real-time analysis and high-performance engine make it suitable for organizations handling large volumes of data. FineBI also supports big data analytics, making it a strong choice for enterprises seeking data-driven insights.
Tableau
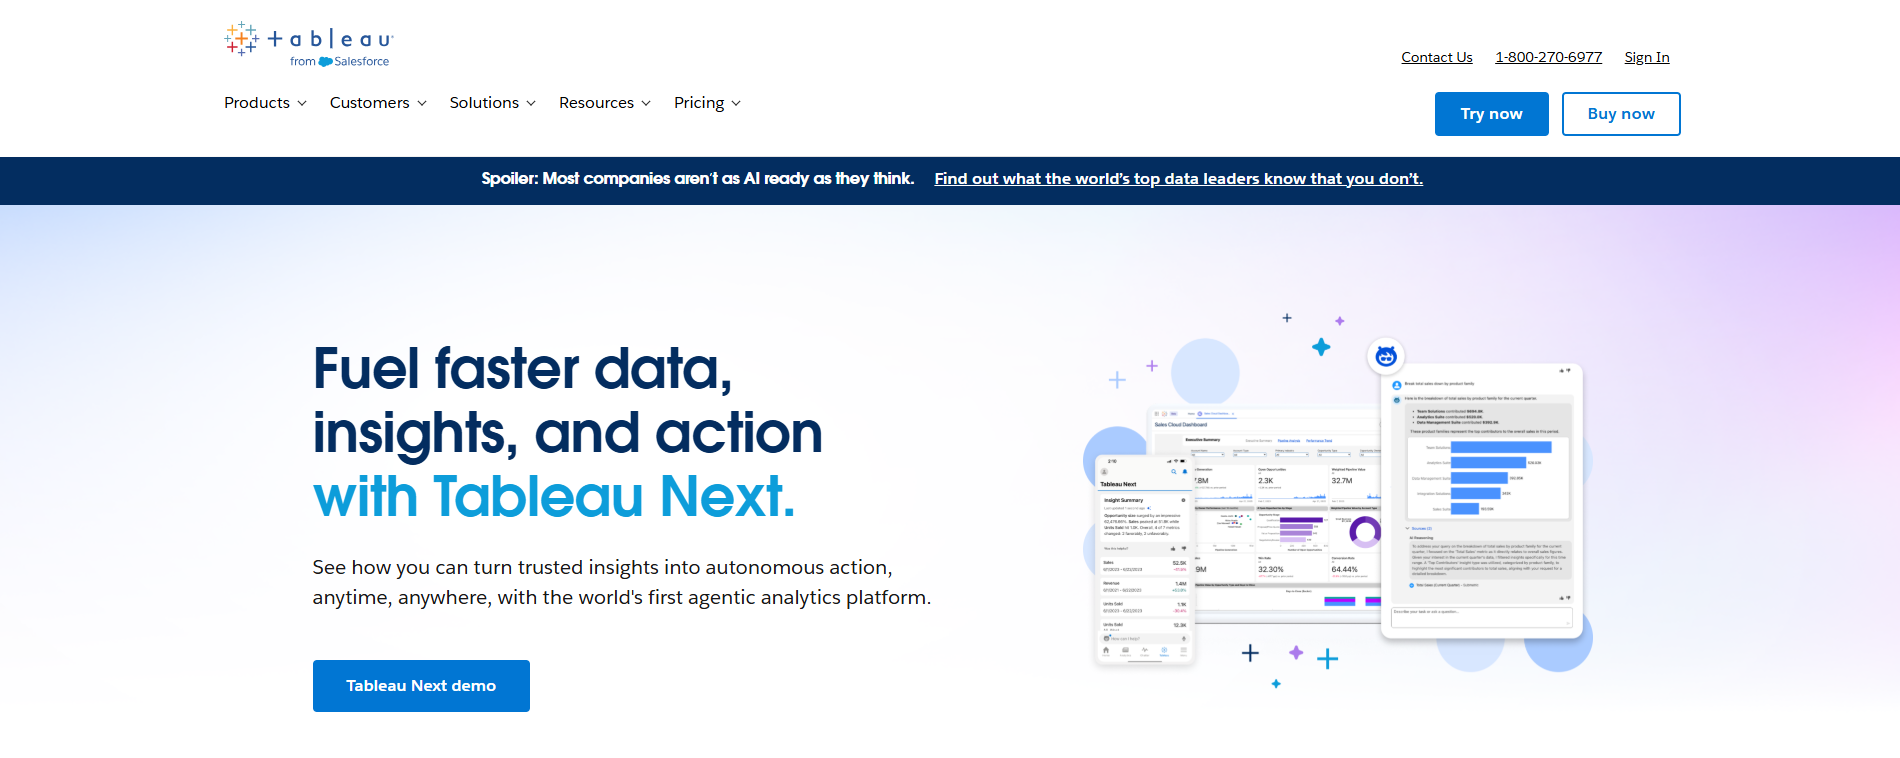
Tableau is a leading name in market data analysis tools. You can use Tableau to create interactive dashboards and visualizations with ease. Its drag-and-drop interface and smart data preparation features help you identify trends quickly. Tableau supports integration with Salesforce Data Cloud, dbt models, and Google Workspace, making it versatile for different business environments.
| Feature/Use Case | Description |
|---|---|
| Semantic Connector | Integrates semantic models from Salesforce Data Cloud, preserving logic and calculations. |
| Viewport Parameters | Dynamically updates filters and calculations based on the visible area of a map. |
| Enhanced Q&A in Tableau Pulse | Allows conversational questions with visual answers and context. |
| Custom Color Palettes via GenAI | Generates custom color themes using natural language prompts. |
| SCIM Provisioning for Tableau Server | Automates user and group provisioning, simplifying admin tasks. |
| dbt Connector | Connects directly to dbt models, integrating best practices into Tableau dashboards. |
| Google Workspace Add-ons | Embeds Tableau dashboards into Google Docs and Slides for real-time data insights. |
Tableau offers a tiered, role-based licensing model. You can choose between Creator, Explorer, and Viewer roles, each with different pricing and access levels. Tableau provides both cloud-based and self-managed deployment options, giving you flexibility based on your infrastructure.
Tableau is best for organizations that need advanced visualization, predictive analytics, and seamless integration with other business tools. Its strong storytelling features and motion transitions make it a favorite for marketing analytics tools and market research tools.
Microsoft Power BI
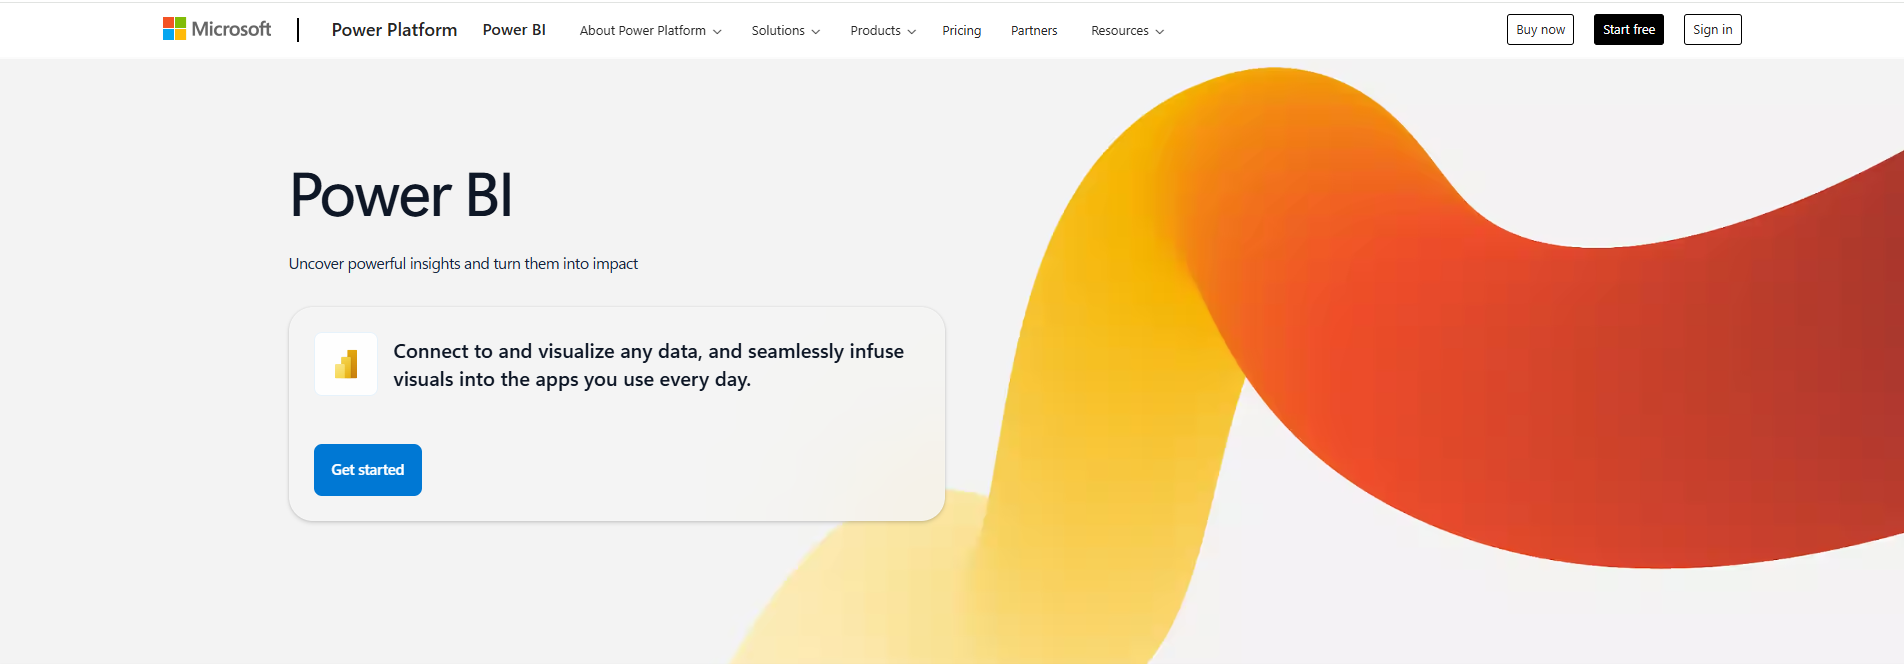
Microsoft Power BI is a popular choice among data analytics tools. You can integrate Power BI deeply with Azure, ensuring high availability and security compliance. Power BI allows you to customize embedded analytics, tailor reports, and support multitenancy for SaaS applications. Real-time data streaming and row-level security enhance your ability to make timely, data-driven decisions.
| Feature | Description |
|---|---|
| Deep Integration with Azure | High availability, security compliance, and access to the latest Microsoft features. |
| Customizable Embedded Analytics | Tailor reports to match branding and user experience. |
| Multitenancy Support | Isolate data for different customers, crucial for SaaS applications. |
| Real-time Data Streaming | Analytics reflect current business conditions for timely decisions. |
| Row-Level Security (RLS) | Tailored data visibility for users or groups. |
| API Integration | Secure and efficient embedding of reports and dashboards. |
Power BI is user-friendly and cost-effective. You can choose from free, Pro, and Premium versions, making it accessible for businesses of all sizes. Power BI excels in advanced data visualization and real-time data processing. It is best suited for organizations already using Microsoft products and those seeking robust security features in their data analysis tools.
Google Data Studio
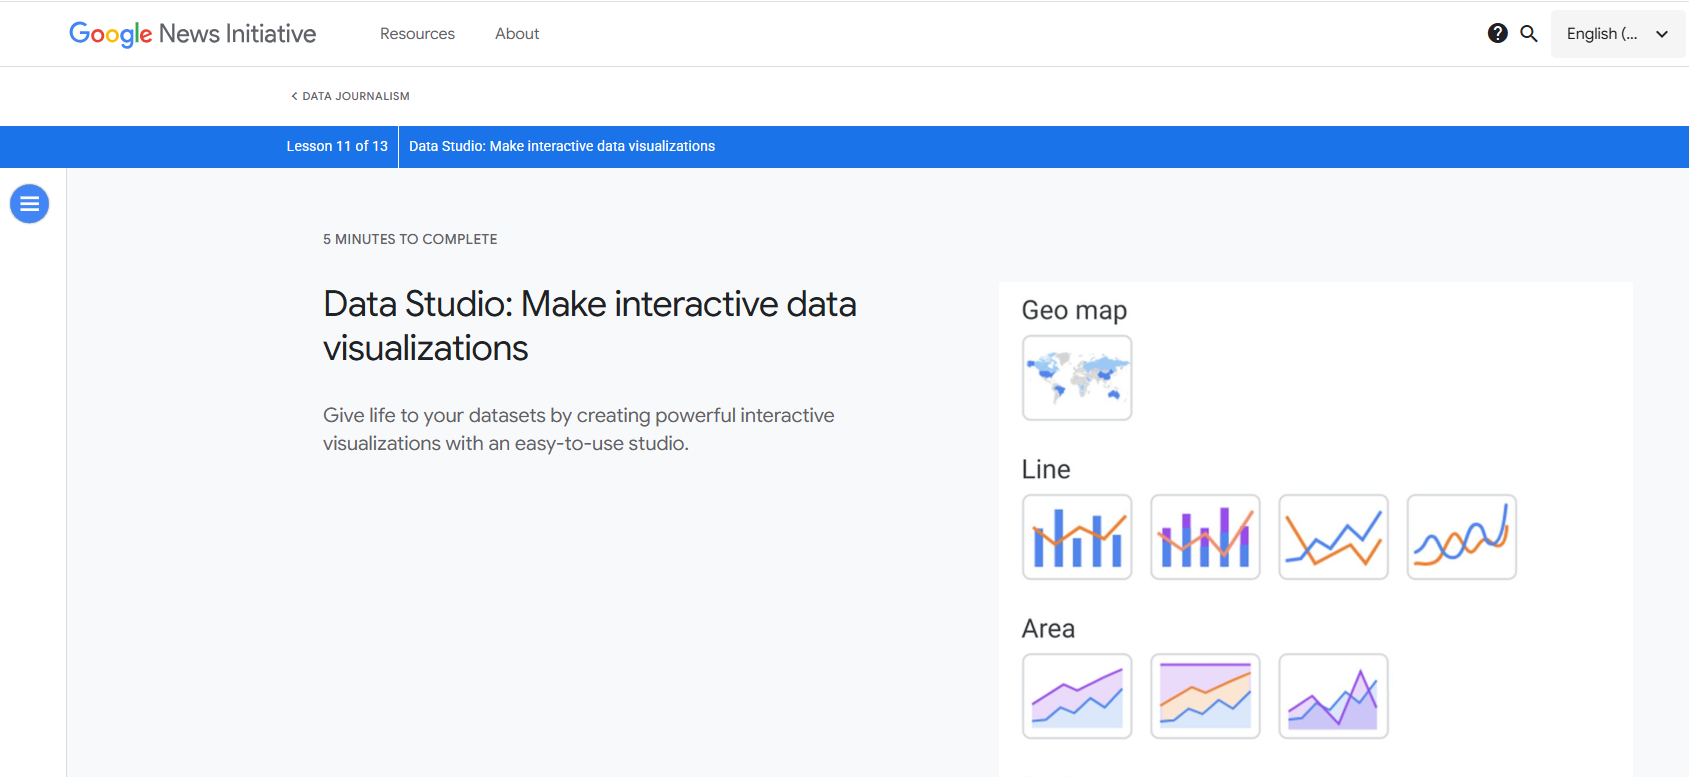
Google Data Studio is a free business intelligence tool that transforms raw data into visual dashboards. You can integrate data from multiple sources, create unlimited reports, and collaborate with your team in real time. Google Data Studio is ideal for marketers, SEO specialists, agencies, and small business owners who need simple, live dashboards.
| Core Features | Ideal Business Scenarios |
|---|---|
| Free business intelligence tool | Marketers, SEO Specialists, and Content Teams can track campaign performance and funnels. |
| Visual dashboards instead of spreadsheets | Agencies, Freelancers, and Client-Facing Teams can provide clients with live dashboards. |
| Data integration from multiple sources | Business Owners and Non-Technical Decision Makers can get simple snapshots of key metrics. |
| Unlimited reports and dashboards | |
| Sharing and collaboration features | |
| Basic data blending | |
| Design and layout control |
Google Data Studio supports automated reporting and audience analysis. You can use it to make data-driven decisions based on the latest information. It is a strong choice for small and medium-sized enterprises looking for accessible marketing analytics tools.
Qlik Sense
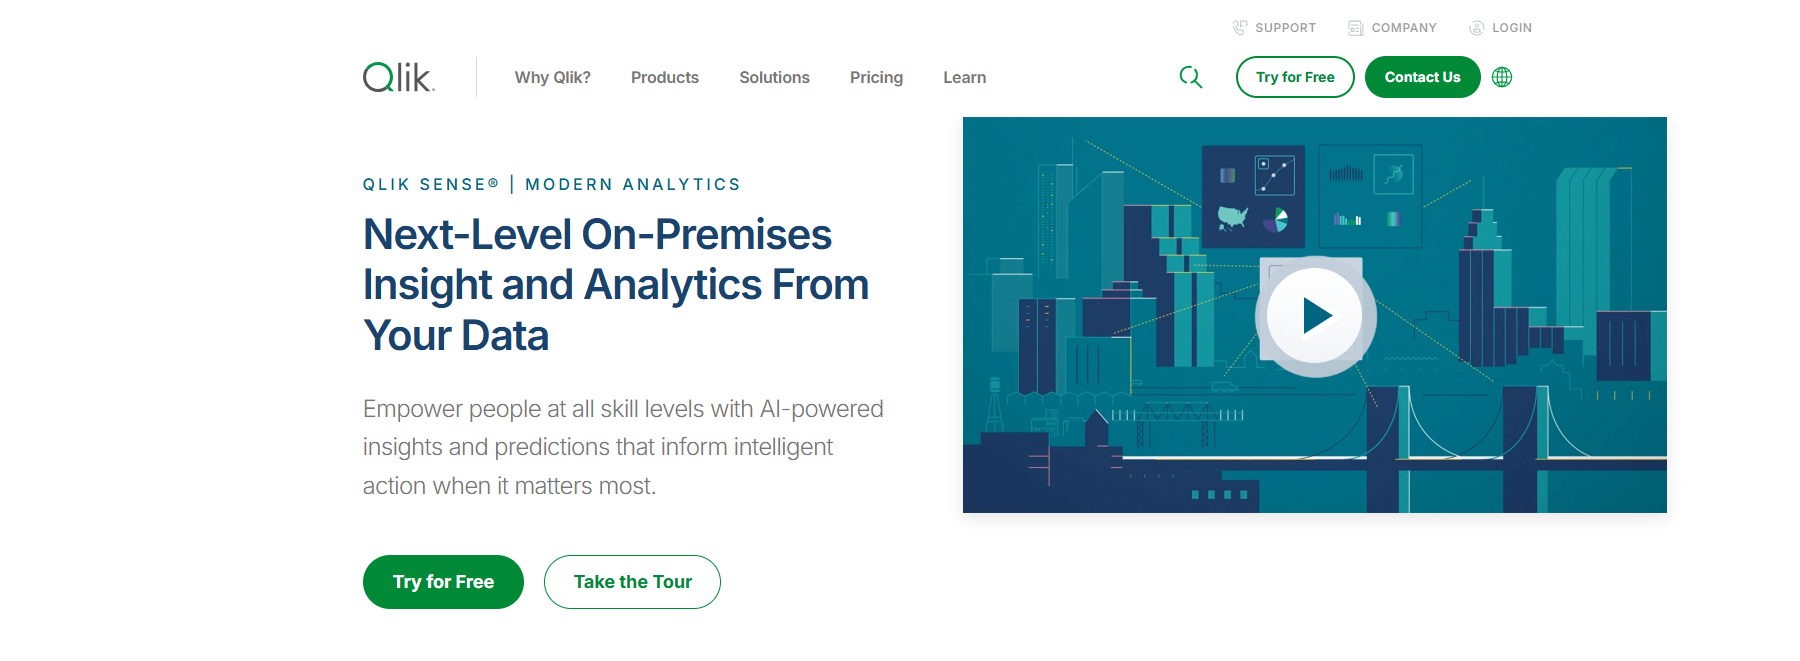
Qlik Sense is known for its unique associative search technology. You can explore data from multiple angles and uncover hidden relationships. Qlik Sense is a leader in the consumerization of business intelligence, making it easy for users to interact with data.
| Strengths | Weaknesses |
|---|---|
| Unique technology -- associative search | Undiversified product portfolio |
| Highly differentiated product | Lack of integration with existing software |
| Leader in the consumerization of business intel | |
| Size (lower R&D spending compared to giants) |
Qlik Sense is suitable for mid-size companies and enterprises in industries like retail, healthcare, manufacturing, financial services, government, and education. Notable customers include BMW Group and Barclays Bank UK. You can use Qlik Sense for big data analytics and market research tools, especially if you need to analyze complex data sets.
Domo
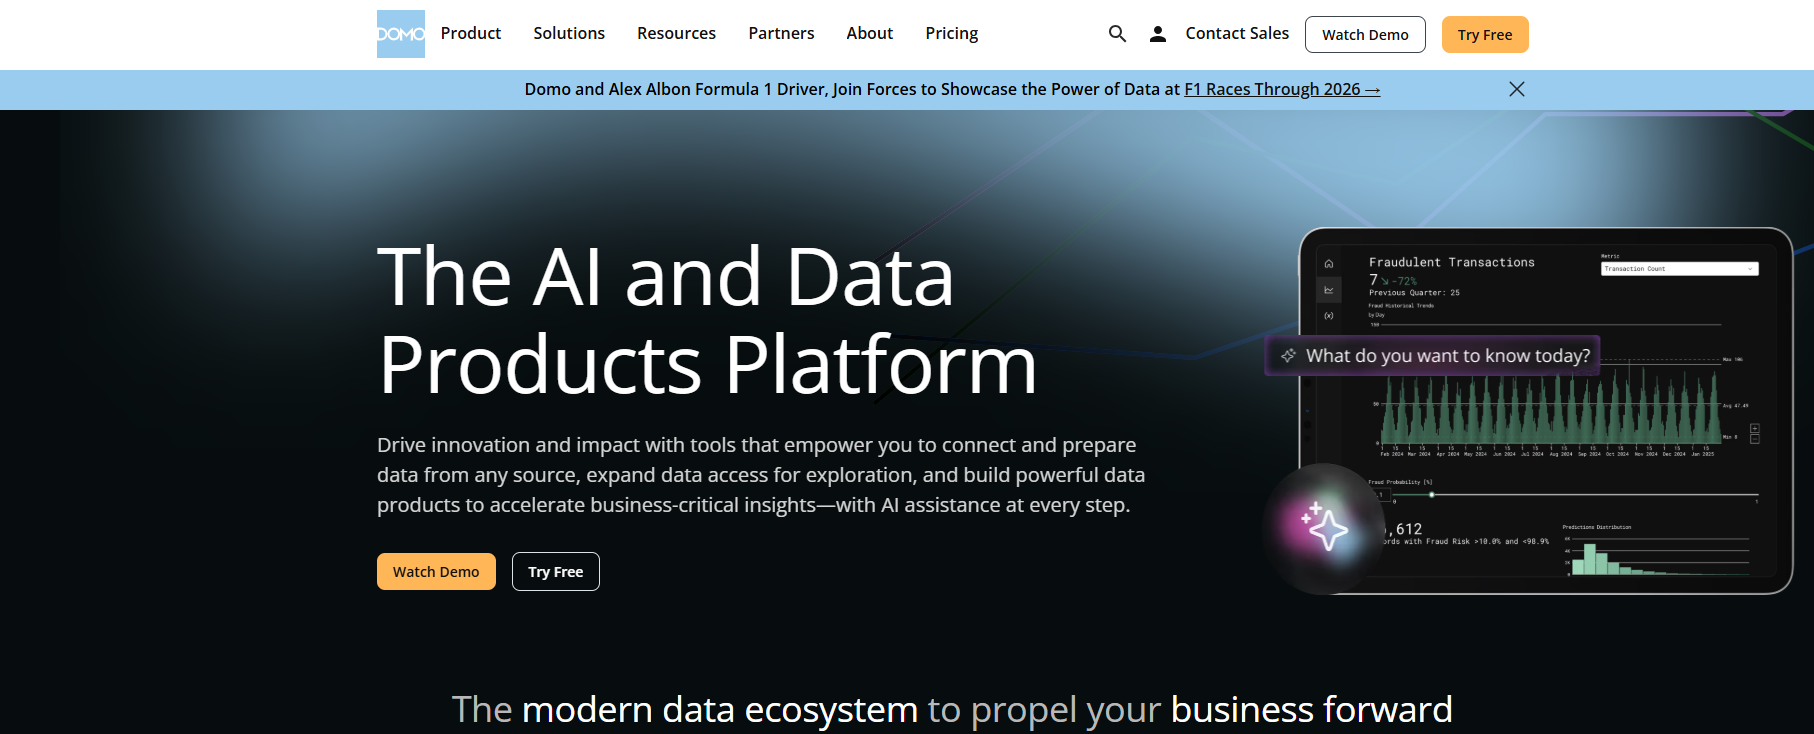
Domo is a cloud-based platform that offers real-time data access and outstanding integrations. You can use Domo to create customizable dashboards, collaborate with your team, and leverage AI and machine learning capabilities. Domo uses a credit-based pricing model, so you pay based on usage rather than per user.
- Real-time data access
- Outstanding integrations
- User-friendly interface
- Customizable dashboards
- Mobile-first design
- Collaboration features
- AI and machine learning capabilities
- Pre-built apps and templates
Domo is suitable for organizations that need scalable data analytics tools and want to empower users with minimal technical skills. Its intuitive dashboard design makes it accessible for a wide audience. Domo is a strong option for marketing data analysis and big data analytics.
Sisense

Sisense provides clear data visuals and interactive dashboards. You can integrate data from multiple sources and customize dashboards to fit your needs. Sisense offers both on-premise and cloud options, making it flexible for different business environments.
| Advantages | Description |
|---|---|
| Clear Data Visuals | Variety of charts and interactive dashboards for easy insights. |
| Responsive Support | Helpful support team, especially with complex issues. |
| Seamless Integrations | Connects to multiple data sources for unified analysis. |
| Customizable Dashboards | Personalize dashboards for functionality and visual appeal. |
| On-Premise and Cloud Options | Caters to different customer needs. |
| Works Well with Large Datasets | Efficiently handles large datasets using a columnar database approach. |
| Elasticube™ Data Snapshots | Supports lifecycle analysis requirements. |
| Disadvantages | Description |
|---|---|
| Onboarding Complexity | Initial setup can be complicated. |
| Hidden Pricing | No public pricing, requiring discussions with sales. |
| Inconsistent Support | High staff turnover and limited support hours. |
| High Cost for Value | Pricing may be steep if not fully utilized. |
| Elasticube™ Complexity | Requires technical expertise for advanced features. |
| Heavy Application | Needs significant resources for setup and adoption. |
| Limited Dashboard Interaction | Dashboards only interact on the web. |
Sisense is widely used in technology, financial services, healthcare, supply chain, and manufacturing. You can use Sisense for unified data analysis and to gain actionable insights from large, complex data sets.
Looker
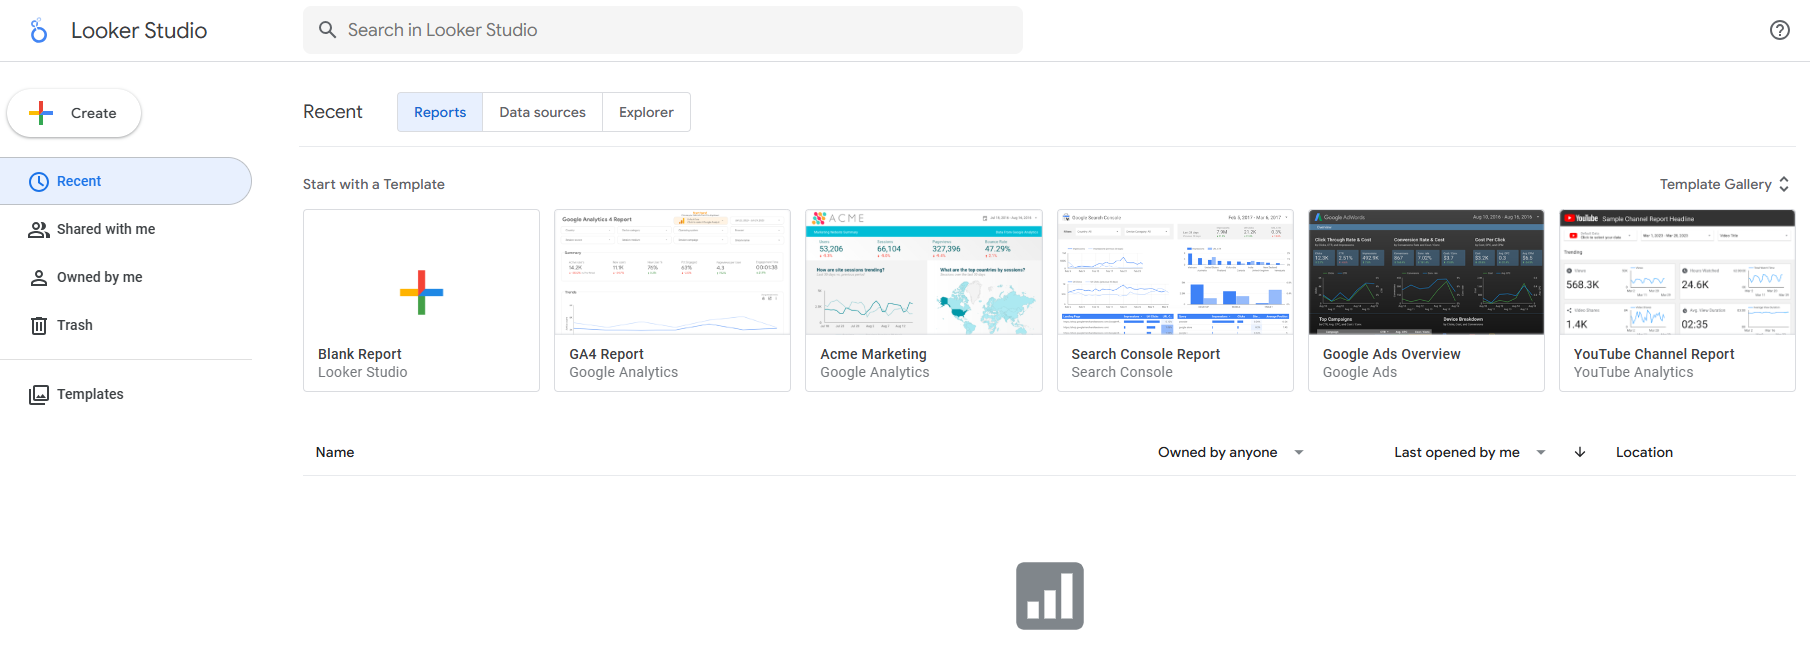
Looker is an AI-powered analytics platform that enables conversational analytics. You can ask questions in plain English and receive instant visualizations and insights. Looker integrates with Microsoft Excel, Google Sheets, and major cloud data warehouses, supporting multi-cloud and hybrid environments.
| Feature | Description |
|---|---|
| AI-Powered Analytics | Transforms data exploration and insights generation through natural language conversations. |
| Conversational Analytics | Ask questions in plain English, eliminating the need for SQL. |
| Automated Visualization Creation | Generates visualizations and reports automatically based on user prompts. |
| Integration with Excel and Google Sheets | Seamless data import across platforms. |
| CI/CD for Analytics Projects | Continuous integration and testing for reliable semantic models. |
Looker is designed for large organizations that need advanced analytics and user-friendly exploration. You can use Looker to democratize access to analytics, making it easy for non-technical users to generate reports and gain data-driven insights.
Zoho Analytics
Zoho Analytics offers flexible pricing plans for businesses of all sizes. You can choose from Standard, Premium, Enterprise, or Always Free plans. Zoho Analytics supports monthly and yearly subscriptions, with payments accepted in multiple currencies.
| Pricing Plan | Features | Price |
|---|---|---|
| Standard | Basic features for small teams | Monthly subscription available |
| Premium | Advanced features for larger teams | Monthly subscription available |
| Enterprise | Comprehensive features for enterprises | Monthly subscription available |
| Always Free | Limited features for small reporting needs | Free |
Zoho Analytics is ideal for sales, marketing, finance, help desk, and HR functions. You can use it to gain insights into sales pipelines, marketing funnels, financial health, customer support metrics, and workforce productivity. Zoho Analytics is a strong choice for organizations seeking the best marketing analytics tools for end-to-end business analysis.
SAP Analytics Cloud
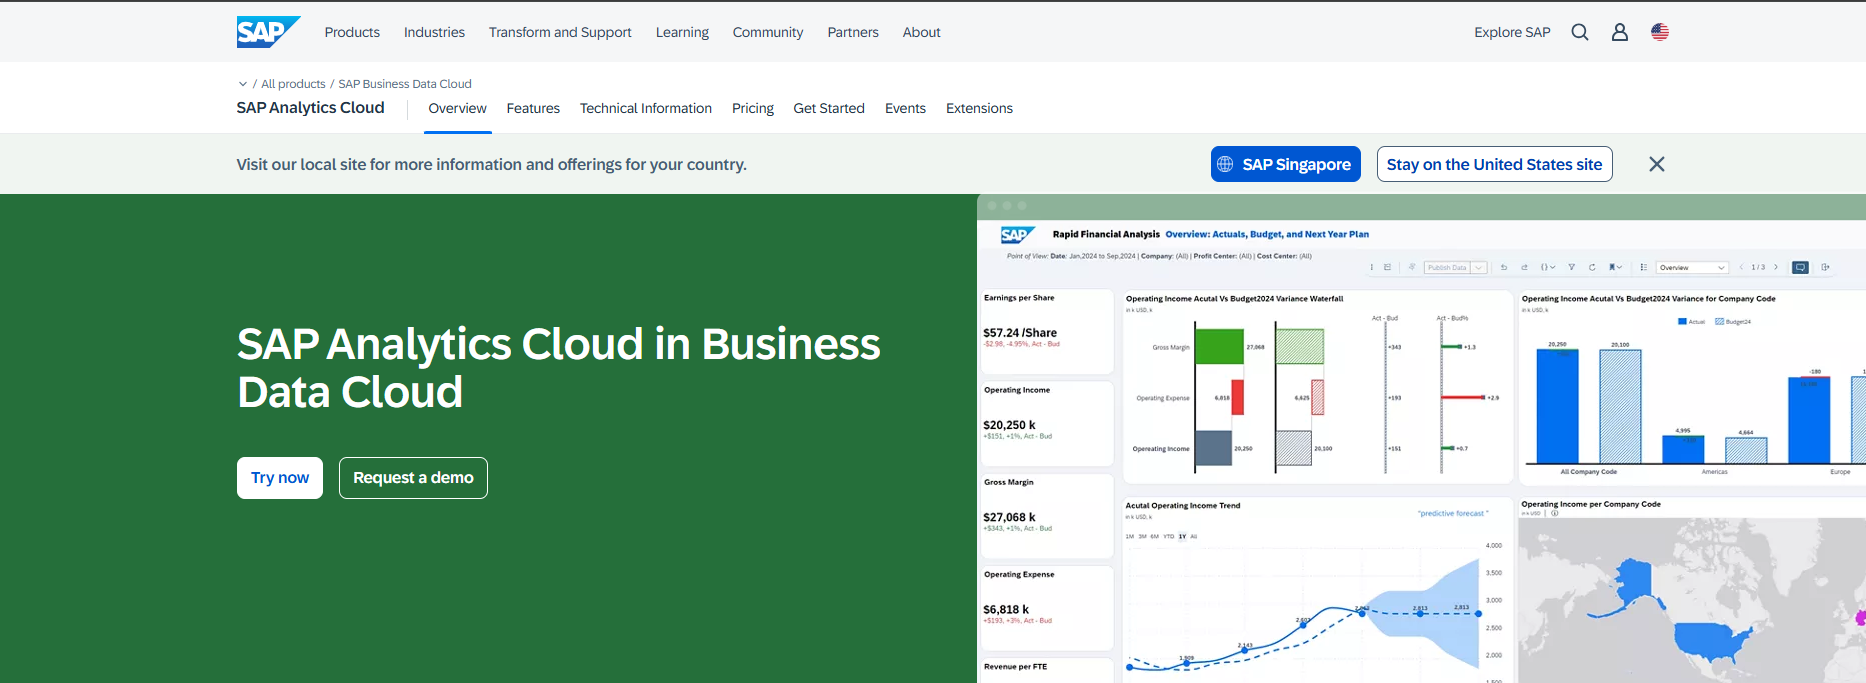
SAP Analytics Cloud provides automated, self-service insights and predictive analytics. You can use it to link plans across your enterprise, access real-time data, and integrate with SAP S/4HANA and third-party solutions. SAP Analytics Cloud supports centralized orchestration and live connectivity, making it suitable for large organizations with complex data needs.
| Feature | SAP Analytics Cloud (SAC) | Limitation |
|---|---|---|
| Dynamic Recipients | Not fully supported | Lacks dynamic recipient logic compared to BO |
| Personalization | Limited personalization | Not as powerful as BO bursting |
| Events-Based Scheduling | Not supported | Only supports time-based scheduling |
| Output Format | Supported (PDF, Excel, PowerPoint) | N/A |
| Destination: Email | Partially supported | No fine-grained control over TO/CC/BCC like BO |
| Integration Aspect | Description |
|---|---|
| Business Intelligence | Automated, self-service insights to answer business questions and detect trends. |
| Augmented and Predictive Analytics | Utilizes AI and machine learning for data exploration and predictive planning. |
| Extended Planning and Analysis | Links plans across the enterprise for better collaboration and essential business semantics. |
| Live Connectivity | Provides real-time data access with SAP S/4HANA and integrates with third-party solutions. |
| Centralized Orchestration with RunMyJobs | Automates publishing and monitoring of insights, enhancing decision-making processes. |
SAP Analytics Cloud is best for enterprises that need advanced planning, predictive analytics, and integration with other SAP solutions. You can use it to support big data analytics and market research tools, ensuring your organization remains data-driven and competitive.
Comparing Market Data Analysis Tools
When you compare market research tools, you want to see how each one fits your business needs. The table below gives you a quick overview of the top tools, their main features, and pricing models.
| Tool | Key Features | Pricing Model | Unique Strengths |
|---|---|---|---|
| FineBI | No-code, self-service, interactive dashboards | Tiered, enterprise | Empowers non-technical users, strong data integration, real-time analysis |
| Tableau | Advanced visualization, smart prep | Role-based, tiered | Storytelling, seamless integration |
| Microsoft Power BI | Azure integration, real-time streaming | Free, Pro, Premium | Deep Microsoft ecosystem integration |
| Google Data Studio | Free, unlimited dashboards | Free | Easy collaboration, live dashboards |
| Qlik Sense | Associative search, big data analytics | Custom, enterprise | Unique data exploration |
| Domo | Real-time, mobile-first, AI features | Usage-based credits | Pre-built apps, strong integrations |
| Sisense | Custom dashboards, Elasticube™ | Custom, enterprise | Handles large datasets efficiently |
| Looker | AI-powered, conversational analytics | Custom, enterprise | Natural language queries, multi-cloud |
| Zoho Analytics | Flexible plans, end-to-end analysis | Standard to Enterprise | Affordable, broad business coverage |
| SAP Analytics Cloud | Predictive, live connectivity | Subscription | SAP integration, planning features |
You should look for tools that match your data needs and business goals. FineBI stands out in several ways:
- FineBI gives you self-service analytics. You can perform your own analysis without waiting for IT support. This feature increases user satisfaction and speeds up decision-making.
- You can build interactive dashboards in FineBI. These dashboards let you explore data and adjust your analysis in real time. This flexibility helps you respond quickly to business changes.
- FineBI offers a wide range of data visualization options. You can present your insights clearly, making it easier for decision-makers to understand trends and act on them.
Many market research tools focus on either ease of use or advanced features. FineBI combines both. You get powerful big data analytics and a user-friendly interface. This balance makes FineBI a strong choice for organizations that want to become more data-driven. When you select data analytics tools, consider how each one supports your analysis, integration, and reporting needs. The right choice will help you turn data into actionable insights and drive business growth.
Choosing the Best Market Data Analysis Tools
Assessing Business Needs
You need to start by understanding your business requirements before selecting marketing analytics tools. Consider how your team will use data and what outcomes you expect. The table below highlights important factors to evaluate:
| Factor | Description |
|---|---|
| Usability | The tool should be straightforward and intuitive for all users. |
| Data Integration | Robust capabilities for seamless collaboration and access to various input sources. |
| Analytics Features | Advanced options like data visualization, trend analysis, and comprehensive reporting. |
| Vendor Support | Ongoing assistance and training to enhance user experience. |
| Customization | Ability to adapt metrics, workflows, and reporting formats to specific business needs. |
| Flexibility | Tools should allow for easy adjustments based on changing business objectives. |
| Understanding Business Needs | Conducting thorough analyses to align products and services with client requirements. |
Matching Features to Goals
You should match tool features to your organizational goals and data requirements. Successful marketing analytics tools support campaign management, roi measurement, and multi-channel attribution tracking. Use the following practices to ensure the best fit:
| Key Practice | Description |
|---|---|
| Gaining Organizational Buy-in | Communicate the value of the tool to ensure team members understand its benefits and are motivated to use it. |
| Training and Onboarding | Provide comprehensive training to ensure all team members can effectively use the tool. |
| Continuous Adaptation | Regularly evaluate the tool's effectiveness and make adjustments based on team feedback. |
| Measuring Tool Effectiveness | Establish metrics to assess the impact of the tool on achieving organizational goals. |
| Customization | Tailor the tool to fit the specific needs and context of the organization. |
Budget and Scalability
You must consider your budget and the scalability of data analytics tools. Pricing varies widely among market research tools. Some, like Google Analytics 4, offer free versions, while others, such as Domo or Supermetrics, use usage-based or subscription pricing. As your data grows, you need tools that can scale with your business. FineBI, for example, supports big data analytics and real-time data analysis, making it suitable for organizations with expanding needs.
Integration and Usability
When selecting the best marketing analytics tools, focus on integration and usability. Look for tools that offer:
- Ease of use for both technical and non-technical users
- Strong integration with existing systems for seamless data collection and integration
- Scalability to handle increasing data volumes and users
- Collaboration features for sharing data insights and interactive data visualization
- Reliable customer support and active user communities
FineBI stands out by providing a user-friendly interface, robust data integration, and advanced analytics. You can use it for digital market analysis, tracking customer interactions, and marketing performance insights. The right data analytics software will help you achieve data-driven growth and improve customer engagement through actionable insights.
Real-World Success with Market Data Analysis Tools
You can see the real impact of market data analysis tools by looking at how leading companies use them. BOE Technology Group, a global leader in the IoT and semiconductor display industry, faced challenges with fragmented data and inconsistent analysis methods. The company needed to unify its data and improve the accuracy of its business analysis. By adopting FineBI, BOE built a strong data integration framework and standardized its analysis processes.
BOE used FineBI to connect data from different sources, automate data integration, and create a unified system for analysis. The company developed over 200 data models and standardized 257 key metrics. This approach helped BOE move from manual, paper-based reports to real-time dashboards and interactive analysis.
You can learn from BOE’s experience. After implementing advanced data analytics tools, BOE achieved measurable results:
- Reduced inventory costs by 5%
- Increased operational efficiency by 50%
- Enabled real-time monitoring and cross-factory benchmarking
- Improved data-driven decision-making across departments
When you use market research tools like FineBI, you gain the ability to track key performance indicators and perform big data analytics. These tools help you identify trends, compare performance, and support roi measurement. You can empower your teams to conduct their own analysis and generate actionable insights. This shift leads to faster responses to business changes and better alignment with strategic goals.
Market research tools do more than just process data. They transform the way you approach analysis and decision-making. By integrating the right tools, you can unlock the full value of your data and drive continuous improvement in your organization.
You need the best marketing analytics tools to unlock business growth. The right tools help you collect and analyze data from every source. FineBI and similar platforms turn data into insights that drive data-driven decisions. Big data analytics gives you a clear view of trends and performance. Review your needs, explore free trials, and start using analytics for better analysis and smarter business moves.

Continue Reading About Market Data Analysis Tools
How to Do Retention Analysis for Business Success
What is Pareto Chart and How Does it Work
How DuPont Analysis Helps You Understand Your Business


FAQ

The Author
Lewis
Senior Data Analyst at FanRuan
Related Articles

What Recruiters Look for in a Data Analysis Portfolio: 10 Criteria to Score Yours Fast
A $1 is not judged like a school assignment. It is judged like a hiring shortcut. Recruiters, hiring managers, and analytics leads use it to answer one question fast: Can this person solve business problems with data in
Lewis Chou
May 29, 2026

What Is Data Analytics Consulting? Beginner’s Guide to Services, Deliverables, and Business Value
$1 helps organizations turn raw data into decisions they can trust. For many business leaders, the challenge is not a lack of data. It is a lack of clarity. Reports conflict, teams track different KPIs, dashboards are un
Lewis Chou
Jun 03, 2026

Data Analyst Job Description [+2026 Guide]: Compare Responsibilities, Skills, and Salary by Industry
A strong $1 does more than list tasks. It defines how a company turns raw data into business decisions, which teams the analyst supports, and what measurable outcomes the role is expected to influence. For employers, tha
Lewis Chou
Jun 02, 2026