What is a real time analytics dashboard? A real time analytics dashboard is a digital interface that displays up-to-the-moment data from multiple sources, providing you with instant insights through interactive visualizations. You can see live metrics, track trends, and respond to changes as they happen.
A real time analytics dashboard works by integrating data from systems like databases, cloud platforms, and APIs. It processes and visualizes this information so you can make fast, data-driven decisions. Businesses that use real time analytics dashboard solutions experience faster decision-making and move from reactive to proactive strategies. FineBI stands out as a leading tool, helping you connect, analyze, and visualize live data efficiently.
| Evidence Type | Findings | Source |
|---|---|---|
| ROI from Streaming Initiatives | 95% of IT leaders reported 2 to 10 times ROI | Confluent Survey |
| Customer Experience ROI | 633% ROI over 3 years from customer experience investments | Forrester's Total Economic Impact |
Real Time Analytics Dashboard Overview

Definition and Key Concepts
An analytics dashboard gives you a clear, interactive view of your business data. Unlike traditional dashboards, which show historical information and update periodically, a real time analytics dashboard displays live data feeds. You see metrics as they change, which helps you respond quickly to new developments. The analytics dashboard acts as a dynamic user interface, showing key metrics and data as they update. You can monitor and analyze the latest information efficiently.
You benefit from improved decision-making because you access up-to-the-minute data. The analytics dashboard enhances visibility into your business operations by consolidating key metrics in one place.
Here is a comparison between traditional dashboards and real time analytics dashboards:
| Feature | Traditional Dashboards | Real-Time Dashboards |
|---|---|---|
| Data Source | Historical data | Live data feeds |
| Update Frequency | Periodically (daily to monthly) | Instantaneous |
| Visibility | Retrospective view | Immediate visibility |
| Issue Detection | Delayed detection of issues | Rapid issue detection |
| Decision-Making | Long-term strategic insights | Enhanced decision-making agility |
| Data Integrity | High accuracy based on validated historical data | Potential data integrity challenges due to live feeds |
| Contextual Understanding | Strong historical context for analysis | May lack historical context for long-term planning |
The analytics dashboard relies on several key concepts:
- Data integration from various sources centralizes all necessary information.
- Data processing ensures accuracy and relevance for reliable insights.
- Automated updates keep your analytics dashboard current.
- Visualization transforms data into charts and graphs for quick understanding.
- User interface customization allows you to tailor the analytics dashboard to your needs.
FineBI’s Approach to Analytics Dashboard
FineBI takes a unique approach to the analytics dashboard. You can connect to more than 60 data sources, including databases, cloud warehouses, and APIs. FineBI’s workflow guides you through four stages: data integration, data processing, visual exploration, and publishing. You use self-service tools to prepare and refine your data, then build interactive dashboards with drag-and-drop features.
FineBI’s analytics dashboard lets you apply filters, customize layouts, and share insights securely. You do not need coding skills to create or modify dashboards. The platform supports real-time analytics, so you always work with the latest data. FineBI empowers you to make fast, informed decisions and collaborate with your team using a centralized analytics dashboard.
How Real Time Analytics Dashboard Works
A real time analytics dashboard delivers actionable insights by connecting, processing, and visualizing data as events unfold. You can track metrics, monitor operations, and make decisions based on the latest information. FineBI’s workflow guides you through four essential stages: data integration, real-time data processing, visual exploration, and publishing. Each stage plays a vital role in transforming raw data into meaningful insights.
Data Integration and Sources
You start by integrating data from multiple sources. FineBI enables you to connect to over 100 systems, including databases, cloud platforms, and APIs. You can unify structured and unstructured data, making analysis seamless. The platform supports on-premise, private cloud, and hybrid deployments, so you choose the best fit for your organization.
| Deployment Options | Description |
|---|---|
| On-Premise | Suitable for organizations with strict data residency requirements and security policies. |
| Private Cloud | Offers flexibility for organizations transitioning to cloud solutions while maintaining control. |
| Hybrid | Combines both on-premise and cloud solutions, ideal for gradual migration strategies. |
| Connectors | Over 100 connectors available, particularly effective for systems like SAP and Oracle E-Business Suite. |
You can integrate a wide range of data sources into your real time analytics dashboard:
- Structured data from SQL or NoSQL databases
- Data from third-party services accessed via APIs, such as social media platforms
- Web analytics tools or Internet of Things (IoT) devices
- Real-time data streams like sensor data, log files, or user interactions
FineBI’s real-time data pipelines ensure that your dashboard receives continuous updates. You can schedule incremental refreshes or set up live connections for instant data delivery. This approach supports real-time monitoring and keeps your analytics dashboard current.

Real-time Data Processing
Once you connect your sources, FineBI processes incoming data using advanced technologies. Real-time data pipelines leverage event streaming platforms, stream processing engines, and real-time databases. You benefit from rapid data transformation and low-latency delivery.
- Event streaming platforms (e.g., Kafka) ingest data as it arrives.
- Stream processing engines (e.g., Apache Flink, Apache Spark) transform and enrich data in motion.
- Real-time databases (e.g., ClickHouse, Apache Druid) store and retrieve data with minimal delay.
- Real-time API layers deliver processed data to your dashboard interface.
Real-time data processing architectures combine these technologies to support instant analytics. You can analyze trends, detect anomalies, and respond to changes without waiting for batch updates. FineBI’s real-time data pipelines optimize performance, so you experience reliable real-time monitoring.
The latency for data updates varies by use case. Here is a summary of typical update speeds in leading real time analytics dashboard solutions:
| Use case | Workload | Typical latency |
|---|---|---|
| Fraud detection | Operational | <1 second |
| Patient monitoring | Operational | <1 second |
| Internet-of-things insights | Operational | <5 seconds |
| Customer service/experience | Operational | <10 seconds |
| Customer analytics | Analytics | <5 minutes |
| Social media analytics | Analytics | <5 minutes |
| Analytics dashboard | Analytics | <10 minutes |
| Business intelligence | Analytics | <15 minutes |
You can achieve near-instant updates for operational tasks and rapid refreshes for analytics. FineBI’s real-time data pipelines help you maintain high standards for real-time performance tracking.
Visualization and User Interaction
After processing, FineBI transforms your data into interactive visualizations. You use drag-and-drop tools to build charts, maps, and dashboards. The platform supports a wide variety of visualization types, each designed to enhance your understanding and engagement.
| Visualization Type | Description |
|---|---|
| Bar Charts | Compare different categories or data sets, such as campaign performance metrics. |
| Pie Charts | Show proportional data, like budget allocation across channels. |
| Interactive Charts | Allow real-time filtering and adjustments to explore trends in greater detail. |
| Line Charts | Display trends over time, such as monthly traffic or revenue growth. |
| Heat Maps | Visualize data intensity or frequency, often used for website user behavior or engagement. |
| Geographic Maps | Highlight location-based data, such as regional sales or audience distribution. |
| Dashboards | Combine various metrics into a single view for comprehensive insights. |
Visualization tools in your real time analytics dashboard simplify complex data. You can spot patterns and trends, communicate insights, and engage stakeholders. Interactive visuals allow you to filter, drill down, and adjust views in real time. This flexibility supports dynamic storytelling and makes data accessible to everyone.
Tip: Use interactive charts and filters to explore different scenarios and uncover hidden opportunities in your real time analytics dashboard.
FineBI’s real-time data pipelines ensure that every visualization reflects the latest information. You can monitor KPIs, track operational metrics, and collaborate with your team using live dashboards. Real-time monitoring and data visualization empower you to make informed decisions quickly.
You complete the workflow by publishing dashboards and sharing insights securely. FineBI supports role-based access, so you control who can view or edit each dashboard. You can audit user activity and maintain governance across your organization.

Real Time Analytics Dashboard Features and Benefits
Live Data Refresh and Filtering
You gain a major advantage with live data refresh in your real time analytics dashboard. Fresh data gives you the most relevant information, so you respond quickly to market changes and customer needs. You monitor performance in real time, restock popular products, and launch new offerings promptly. Timely data ensures your business intelligence decisions rely on current information, which is crucial for fast-paced industries.
FineBI supports live data updates and advanced filtering. You use filters to focus on specific fields, details, or results in group tables, cross tables, and scheduled reports. The data filter function lets you overlay new tables, filter, and save data for future analysis. This flexibility improves data monitoring and helps you anticipate trends.
| Feature | Real-Time Analytics Dashboards | Other Dashboards |
|---|---|---|
| Data Display | Real-time or near real-time | Historical and aggregated |
| Focus | Immediate actionability | Performance evaluation |
| Use Case | Monitoring live processes | Assessing past performance |
| Insight Nature | Speed to resolution | Trends and patterns |
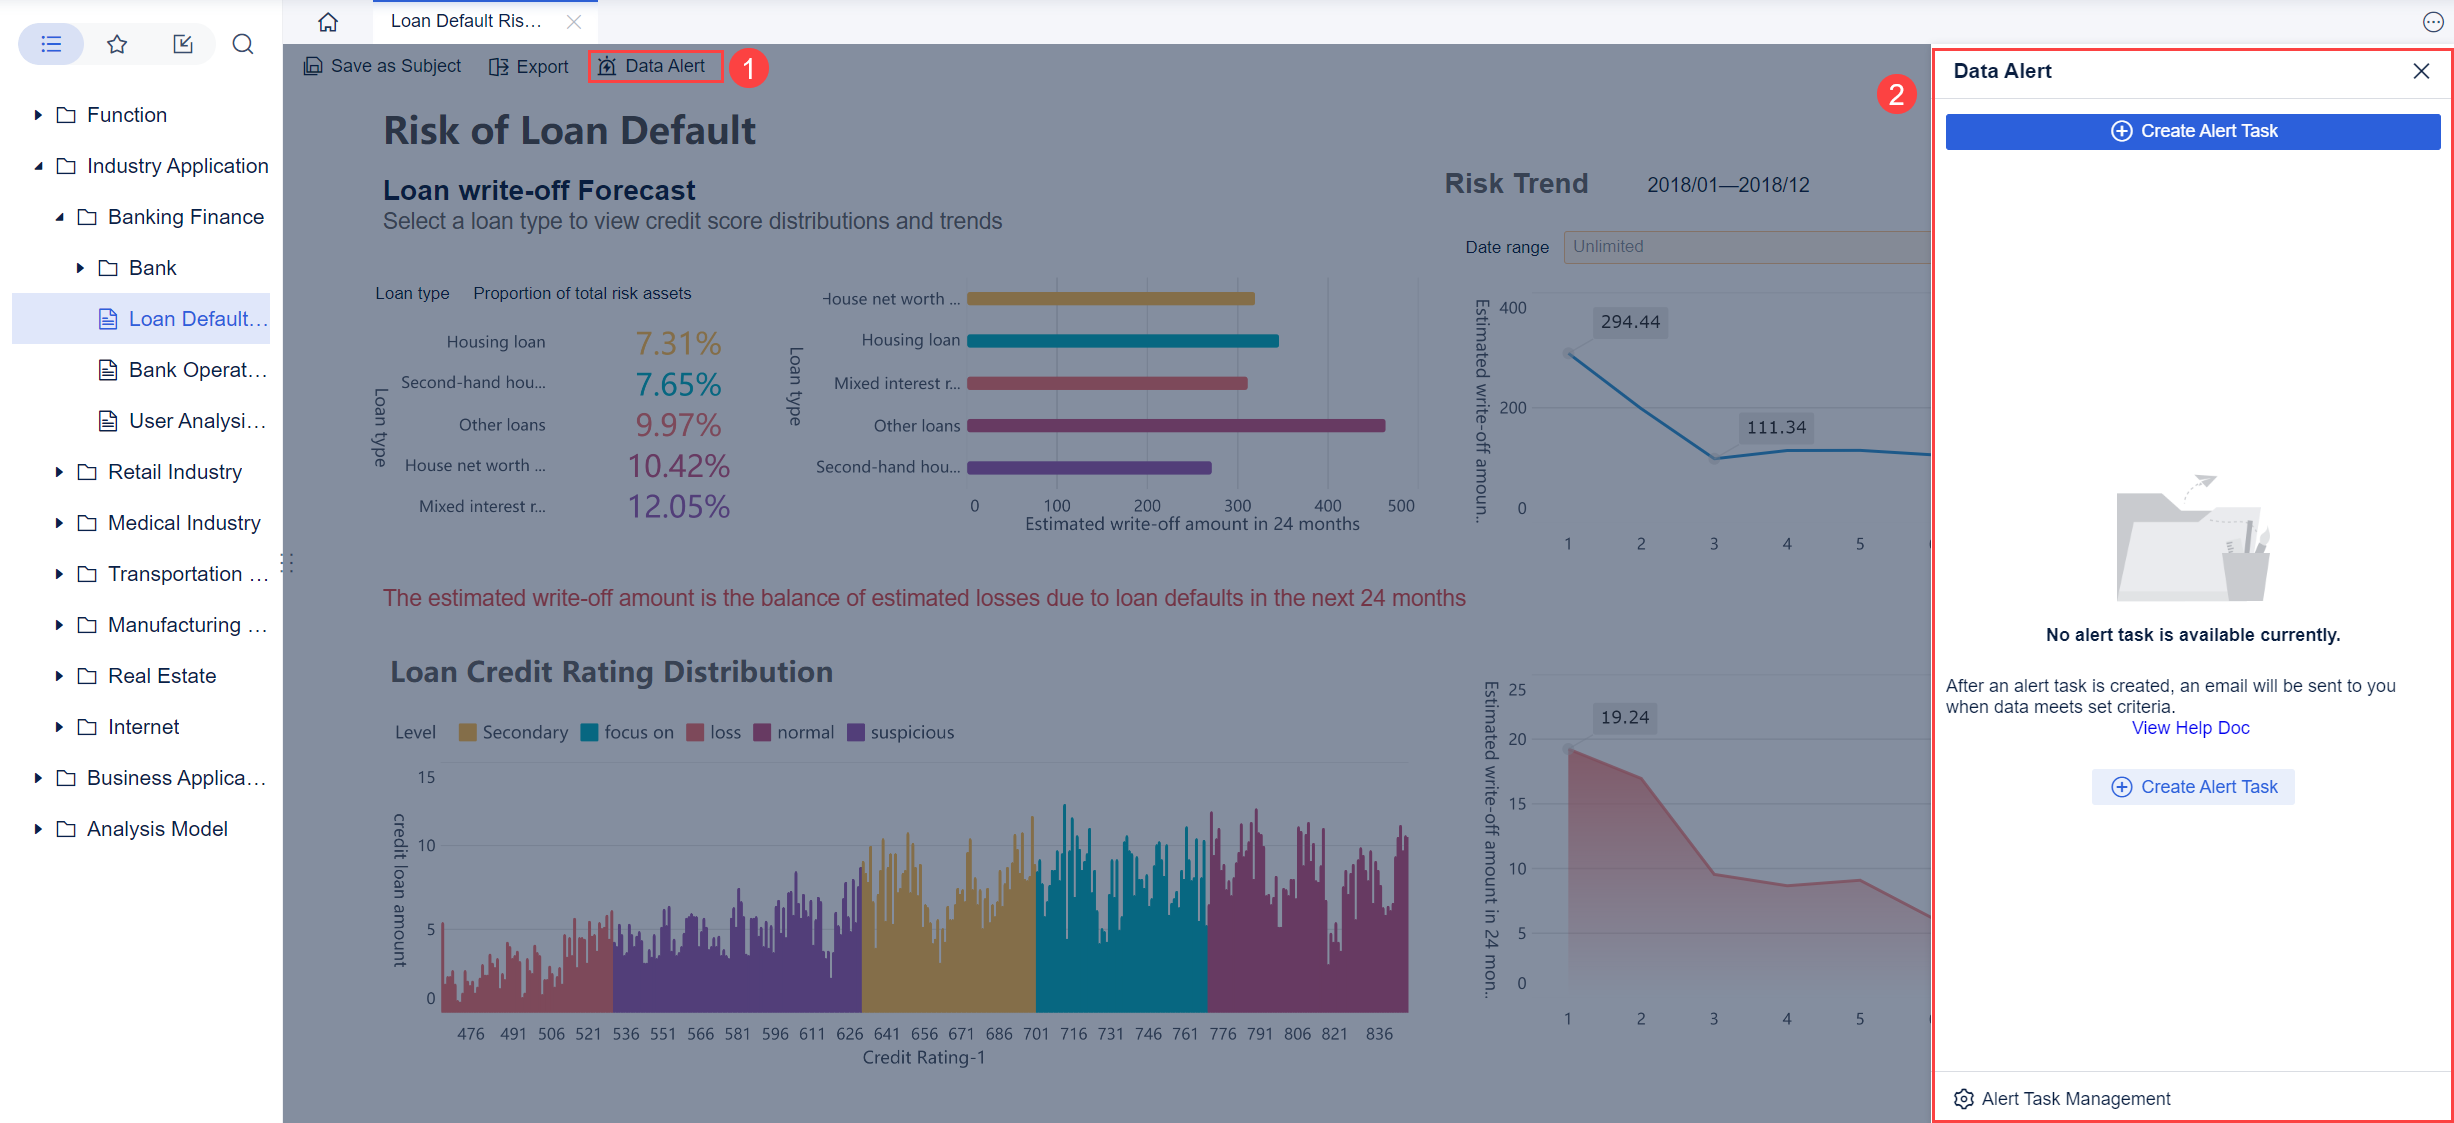
Customizable Views and Alerts
You tailor your analytics dashboard to your needs. Customizable views let you adjust metrics and layouts, which enhances operational agility. You monitor performance by focusing on the metrics that matter most to your role. This targeted approach improves efficiency and helps you prioritize tasks.
Alerts notify you when specific conditions occur, such as overdue activities. You receive proactive notifications, so you do not need to sift through static reports. This system encourages ownership and adoption of the dashboard, leading to increased engagement and productivity.
Tip: Customizing your dashboard and setting alerts helps you stay ahead of changing priorities and ensures you act on live insights.
Collaboration and Governance with FineBI
Collaboration transforms your analytics dashboard into a powerful business intelligence tool. You share insights across departments, break down silos, and align perspectives for consistent analysis. FineBI supports data monitoring and unified approaches to analytics, which streamlines decision-making and improves customer understanding.
| Benefit of Collaboration | Description |
|---|---|
| Data Sharing | Promotes sharing of insights across departments, leading to more informed decision-making. |
| Breaking Down Silos | Encourages transparency and communication, reducing barriers between teams. |
| Cross-Departmental Insights | Facilitates a unified approach to data analysis, enhancing overall organizational effectiveness. |
| Faster Decision-Making | Streamlines the process of making decisions based on shared data and insights. |
| Improved Customer Understanding | Allows for a more comprehensive view of customer data, leading to better service and engagement. |
FineBI ensures enterprise-grade security with role-based access control, row-level security, single sign-on integration, and audit logging. You control who can view or edit dashboards, protect sensitive data, and maintain compliance. Mobile support lets you access live insights and monitor performance anywhere, making your business intelligence dashboard a central hub for data-driven decisions.
Real Time Analytics Dashboard Use Cases
Operational Dashboards
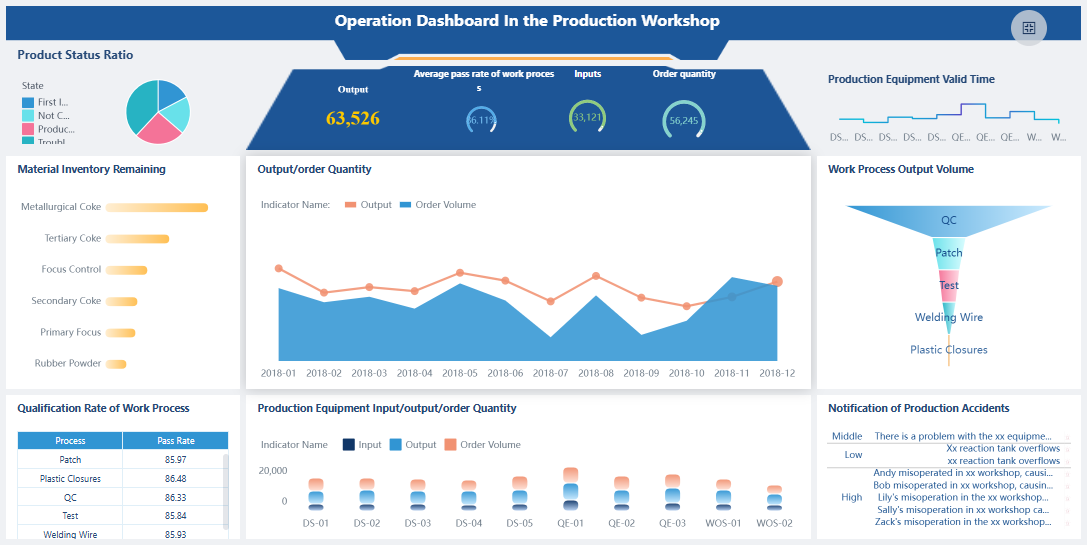
You can use a real time analytics dashboard to monitor key business metrics in manufacturing, logistics, and service operations. When you track inventory levels, you see which products move quickly and which ones age in storage. You detect equipment failures as soon as they happen, which helps you reduce downtime. You follow production rates and quality control metrics, so you maintain high standards and respond to issues immediately. Real-time tracking gives you a clear view of your operations and helps you make fast decisions.
- Inventory management dashboards show stock status and sales potential.
- Operational overviews highlight process bottlenecks and equipment health.
- Performance dashboards display metrics like Overall Equipment Effectiveness (OEE).
- Quality control dashboards ensure products meet specifications.
Sales and Marketing Dashboards
A real time analytics dashboard helps you improve campaign performance and sales outcomes. You forecast results using predictive analytics, which lets you plan for success. Automated insights and anomaly detection alert you to unusual patterns, so you focus on strategy. You visualize sales data instantly and see how your team performs against goals. Accurate reporting gives you confidence to act quickly.
| Value of sales dashboards | Why it matters |
|---|---|
| Real-time visibility into reps’ sales performance | You instantly assess progress toward goals and keep your team focused. |
| Improved decision-making with accurate sales data | You base decisions on facts, not assumptions, and act decisively. |
| Ability to visualize your sales analytics instantly | You spot patterns, forecast trends, and make smarter go-to-market choices. |
You track campaign reach, impressions, click-through rates, conversions, and return on ad spend. You identify gaps in the customer journey and optimize conversion paths. You consolidate key business metrics across marketing activities for a complete view.
Industry Examples with FineBI
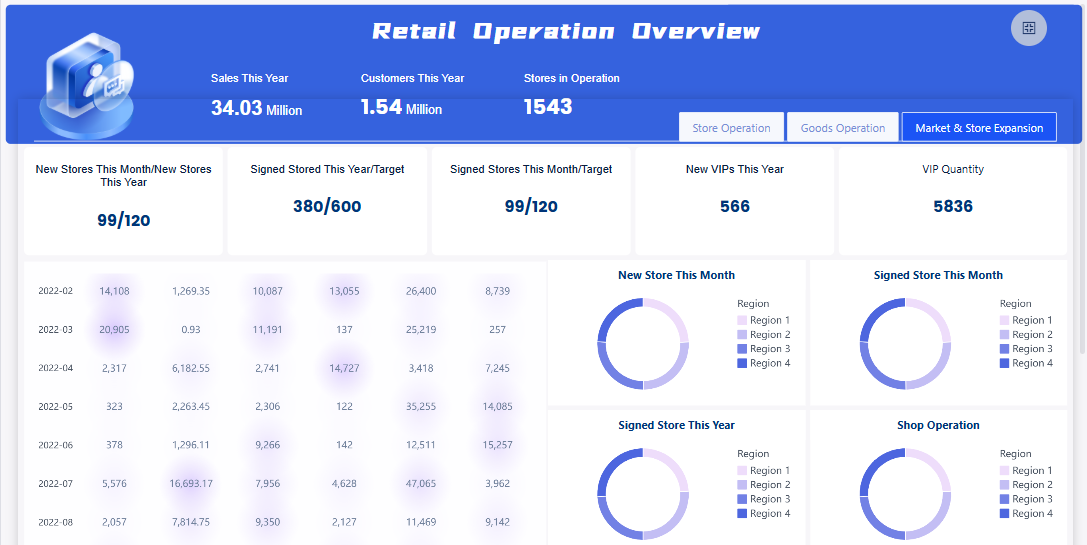
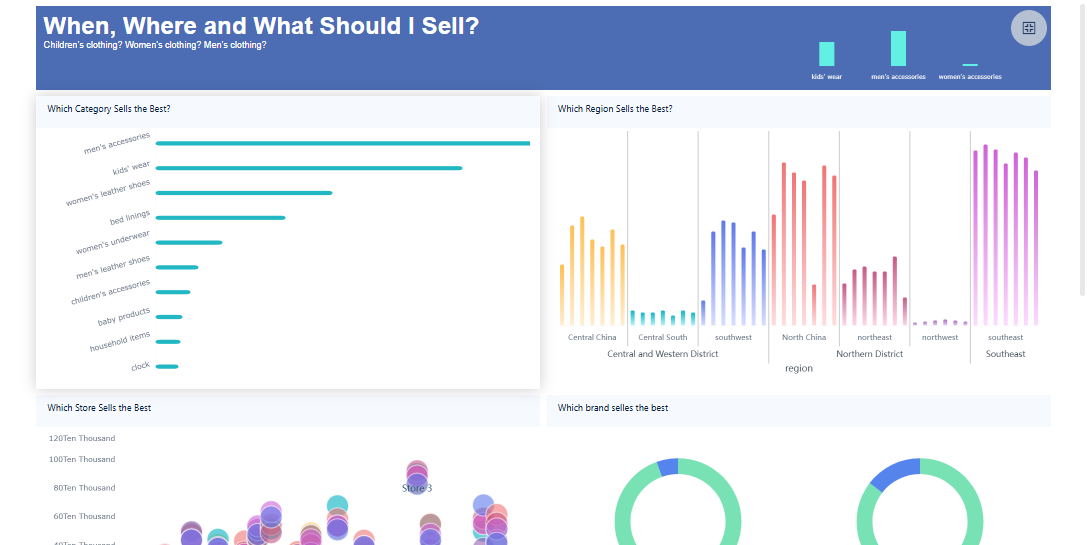
FineBI supports real time analytics dashboards in many industries. In manufacturing, you manage inventory and monitor production quality. In retail, you analyze sales trends and customer preferences. Healthcare organizations use dashboards to track patient care and resource allocation. Finance teams rely on real-time tracking for risk management and compliance. FineBI’s customer stories, such as Kintetsu World Express, show how you can integrate multiple data sources and improve operational efficiency. You gain access to real-time customer analytics, which helps you understand behavior and deliver better service. FineBI’s solutions help you streamline data analysis and make informed decisions in any sector.
Implementing Real Time Analytics Dashboard
Steps to Build with FineBI
You can build a real time analytics dashboard by following a clear set of steps. Start by preparing your technical environment. Make sure your server meets recommended specifications for stability and speed. For example, a Linux server running Ubuntu 18.04.4 or later, with at least 40 GB of disk space and SSD storage, provides a strong foundation. The table below shows typical configurations for different user volumes:
| Number of Daily Active Users (DAUs) | Recommended Configuration |
|---|---|
| 500 | CPU: 8 cores, 16 threads, 2.5 GHz; JVM memory: 16 GB; Physical memory: 24 GB |
| 2000 | CPU: 16 cores, 32 threads, 2.5 GHz; JVM memory: 16 GB; Physical memory: 32 GB (two-node cluster) |
| 3000 | CPU: 16 cores, 32 threads, 2.5 GHz; JVM memory: 16 GB; Physical memory: 24 GB (three-node cluster) |
| 4000 | CPU: 16 cores, 32 threads, 2.5 GHz; JVM memory: 16 GB; Physical memory: 24 GB (four-node cluster) |
Once your environment is ready, you can begin building your dashboard:
- Install the Data Portal plugin.
- Prepare or create a dashboard, such as a Sales Director Real-time Dashboard.
- Create a role in FineBI and assign users to it.
- Set up a directory for your dashboard in System Management.
- Add a portal in Data Portal Management and configure it for your needs.
FineBI guides you through each step, making the process straightforward. You can customize dashboards for different roles and departments, ensuring relevant data reaches the right users.
Common Challenges and Solutions
You may encounter several challenges when implementing a real time analytics dashboard. Data quality issues can arise if your source data is incomplete or inconsistent. Integration complexity often appears when connecting systems with different formats. Performance concerns may affect dashboard responsiveness, especially with large data volumes. Some users may resist new tools, preferring familiar reports. Change management requires clear communication and training. Technical challenges, such as network bandwidth and security settings, can also impact deployment.
Tip: You can address these challenges by using FineBI’s robust data integration tools, automated data cleansing features, and scalable architecture. FineBI supports secure access controls and provides training resources to help users adapt quickly. By following best practices, you ensure your real time analytics dashboard delivers reliable insights and supports informed decision-making.
A real time analytics dashboard gives you instant access to live business data, empowering you to act quickly and make informed decisions. You benefit from reduced time to insight, user empowerment, and proactive monitoring, as shown below:
| Benefit | Description |
|---|---|
| Reduction in time to insight | Immediate answers for faster decisions |
| Empowerment of users | Broader data access and improved data literacy |
| Increased efficiency for analysts | More time for strategic projects |
| Proactive monitoring | Continuous tracking of key metrics |
You can enhance operational efficiency, improve customer experiences, and drive innovation by adopting a real time analytics dashboard. To get started with FineBI, focus on effective visualization, prioritize critical metrics, and enable real-time monitoring for your team.

Continue Reading About Real Time Analytics Dashboard
Best Dashboard Apps for Business Insights
What is a Call Center Dashboard and Why Does It Matter
What is a Reporting Dashboard and How Does it Work
What is An Interactive Dashboard and How Does It Work
What is a Call Center Metrics Dashboard and How Does It Work


FAQ

The Author
Lewis
Senior Data Analyst at FanRuan
Related Articles

How to Build an Investment Portfolio Reporting Dashboard for Executives: KPIs, Benchmarks, and Drill-Down Views
Investment portfolio reporting for executives is not about showing every holding, transaction, and chart your investment team can produce. It is about giving CEOs, CFOs, CIOs, boards, and investment committees a fast, re
Yida YIn
Jun 25, 2026

12 KPI Reporting Examples for Executive Dashboards: What to Show in Weekly, Monthly, and Quarterly Reviews
Executive leaders do not need more data. They need decision ready $1 examples that match how often they review the business and what actions they are expected to take. A weekly $1 should surface fast moving risks and per
Yida YIn
Jun 25, 2026

How to Build a Digital Marketing Reports Dashboard: Executive Examples, KPIs, and Templates
A $1 is the control layer that helps executives and marketing leaders turn scattered channel data into fast, confident decisions. If you are a CEO, CMO, operations director, or marketing analytics lead, the real problem
Yida Yin
May 07, 2026