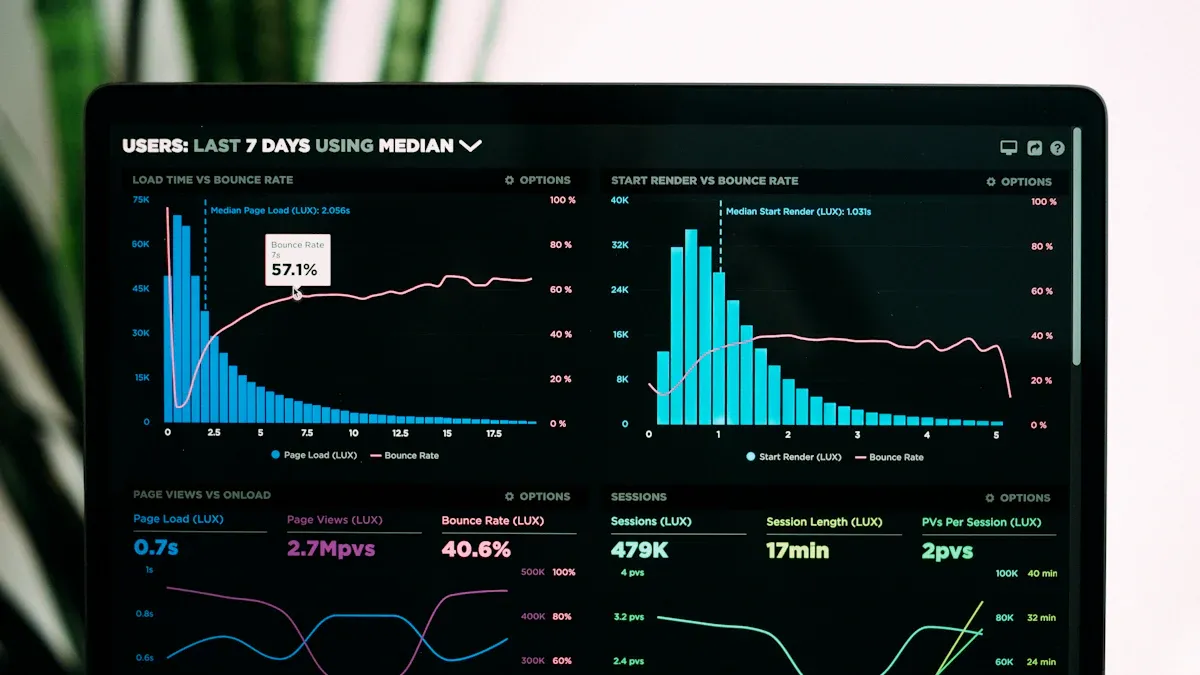
What is an email marketing dashboard? It is a digital tool that brings all your email campaign data together in one place. You can see opens, clicks, bounces, and more—right at your fingertips. This dashboard gives you a single, clear view of your email results.
Tracking your email performance helps you understand what works and what needs improvement. When you centralize your metrics, you spot trends faster and catch underperforming campaigns before they drag you down. You make better decisions because you see every important email number in one dashboard. By pulling in data from different sources, you get the full picture of your customer journey and can quickly adjust your strategy for the best results.
When you use an email marketing dashboard, you get a single place to track all your email campaigns. This dashboard pulls in data from different sources, so you see everything you need at a glance. You can check how many people opened your email, clicked on links, or even unsubscribed. The dashboard helps you spot trends and understand what your audience likes.
Unlike traditional email analytics tools, an email analytics dashboard gives you more control and depth. You can drill down into your data, customize your view, and answer ad hoc questions quickly. Here’s a quick comparison:
| Feature | Dashboard | Email Analytics |
|---|---|---|
| Time to access data | 2-3 minutes | Instant (open inbox) |
| Data depth | Unlimited drilling down | Limited to report scope |
| Team alignment | Difficult | Easy |
| Customization | Extensive | Minimal |
| Real-time data | Yes | No (typically daily) |
| Historical comparisons | Possible but manual | Built-in automatically |
An email analytics dashboard does more than just show numbers. It brings together data from your email client, web analytics, and CRM. This gives you a full view of your marketing efforts. Here are the main functions you can expect:
| Function | Description |
|---|---|
| Data Aggregation | Combines data from email clients, web analytics, and CRM systems for a comprehensive view. |
| Performance Tracking | Monitors metrics such as sends, opens, clicks, conversions, and unsubscribe rates. |
| Decision-Making Support | Helps you spot trends and make smart choices to improve your campaigns. |
You’ll also find these essential features in a strong email analytics dashboard:
With these features, you can see what works and what needs to change. The dashboard makes it easy to adjust your strategy and get better results from every email campaign.
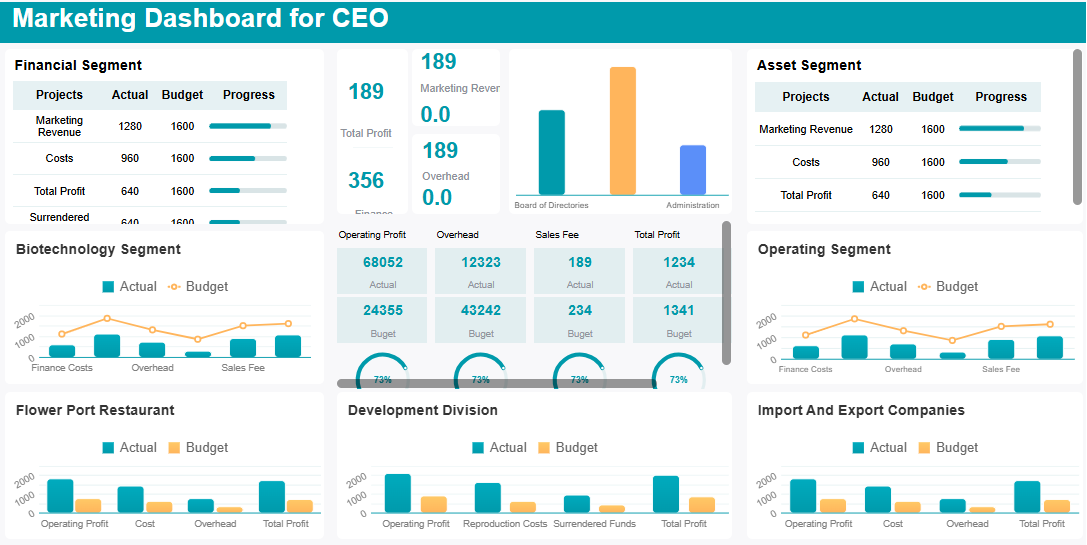
When you use an email marketing dashboard, you give yourself a real advantage. You can see all your email data in one place, which makes it much easier to understand what’s happening with your campaigns. Instead of jumping between different tools or spreadsheets, you get a clear, visual overview of your email analytics dashboard. This saves you time and helps you focus on what matters most—growing your business.
Here are some of the top benefits you’ll notice right away:
| Benefit | Description |
|---|---|
| Enhanced Campaign Effectiveness | An email analytics dashboard gives you actionable insights, so you can create more personalized and effective campaigns. |
| Comprehensive Data Analysis | You can combine data from all your campaigns, making it easier to understand how your audience responds. |
| Time Efficiency | Automation in data collection and visualization lets you spend less time on manual tasks and more on strategy. |
You can track essential metrics like open rates, click-through rates, conversion rate, and revenue per campaign. The dashboard also lets you compare automated flows with one-off campaigns. This helps you see which email flows boost your average order value and repeat purchases. You can then prioritize and optimize your efforts for the best results.
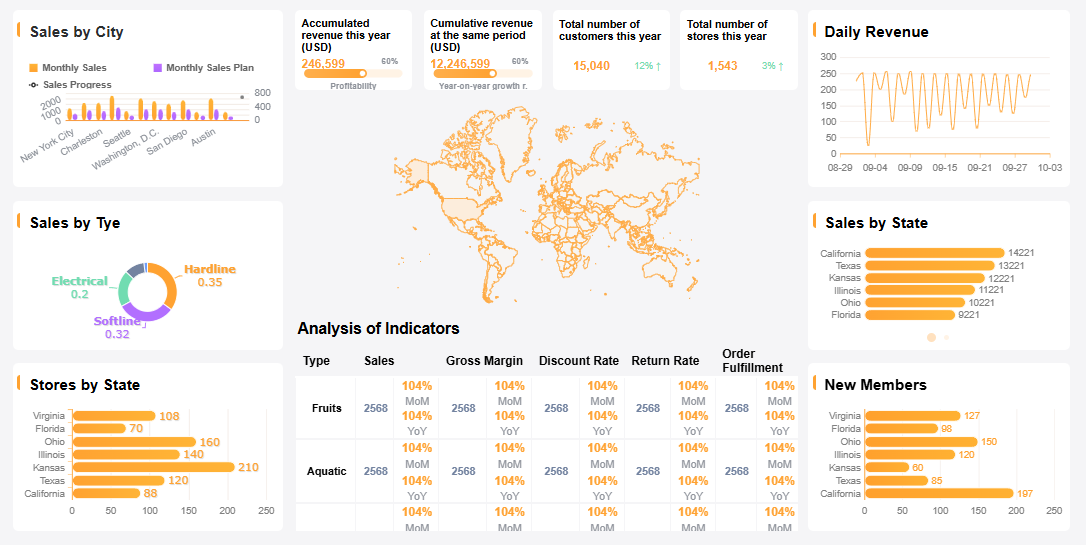
A good email analytics dashboard centralizes your performance data. You get a visual summary that makes decision-making easier. You can quickly spot what’s working and what needs attention. This means you can act faster and with more confidence.
You also get real-time visibility into your campaigns. The dashboard consolidates all your data, so you can track performance metrics and spot trends or issues as soon as they happen. If a campaign underperforms, you’ll know right away and can make changes before it affects your results.
Tip: Use your email analytics dashboard to monitor engagement metrics like open rates and click-through rates. This helps you spot trends and adjust your strategy for better engagement.
An email analytics dashboard does more than just show you numbers. It helps you make smarter, data-driven decisions that improve your return on investment. When you track subscriber behavior and campaign impact, you get a deeper understanding of your email performance. You can see how subscribers interact with your emails over time and spot patterns in their engagement.
With a dashboard, you can compare your email channel against others. This shows the true value of your email marketing campaign and can help you secure more budget for future campaigns. By integrating AI with CRM data, you can even predict what your subscribers will do next. This lets you optimize your campaigns and stay ahead of the competition.
Businesses that use dashboards to guide their decisions often see impressive results. Many companies report returns of $36 to $45 for every $1 spent on email. Some even achieve a 3,600% ROI by making decisions based on the metrics that drive revenue, not just sending more emails.
You can define key metrics like cost per acquisition, conversion rates, and revenue generated. Tools like Google Data Studio or Tableau help you visualize this data in real time. You can create reports that compare your marketing spend to your results, making it clear how your email efforts contribute to business growth.
When you use an email analytics dashboard, you can:
You don’t have to guess what’s working. The dashboard gives you the actionable insights you need to make every campaign better than the last.
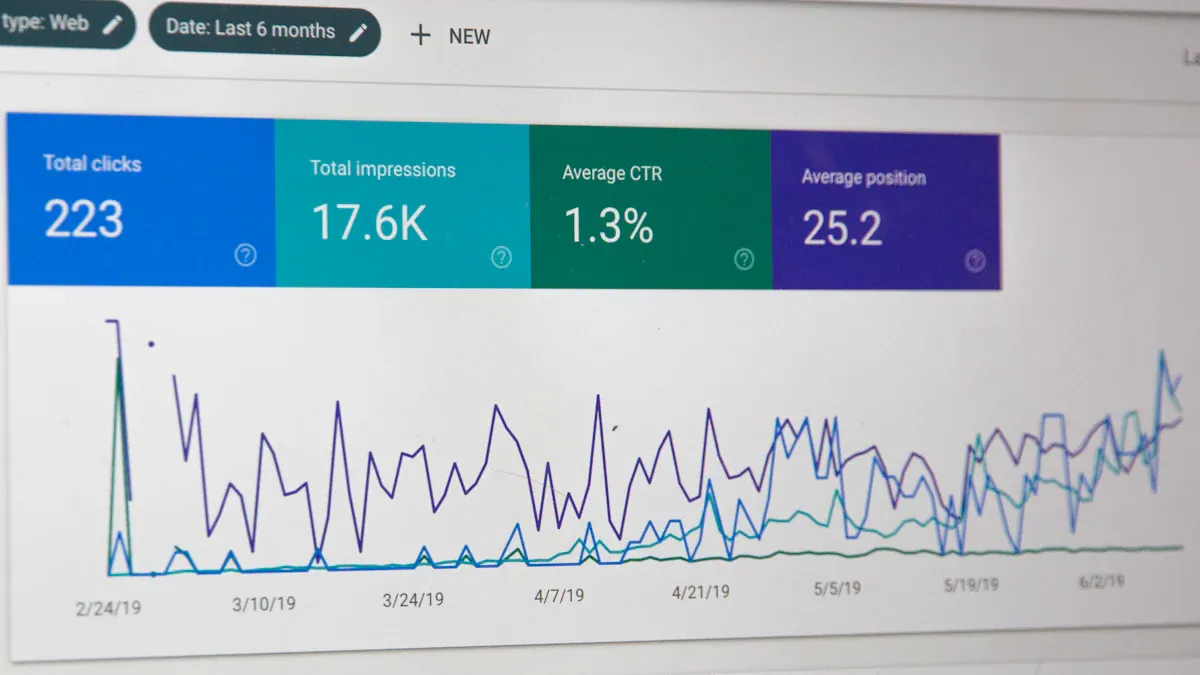
When you use an email marketing dashboard, you unlock a clear view of your campaign performance. The right dashboard helps you track the numbers that matter most, so you can make smart decisions and boost your email marketing ROI. Let’s break down the essential KPIs and engagement metrics you should watch to get the most insight from your email metrics dashboard.
You want your dashboard to focus on the KPIs that drive your email marketing campaign forward. Don’t get lost in vanity stats. Instead, pick 5–7 core metrics that match your business goals. Here are the most important ones to include:
You can also monitor campaign performance over time, response time, and email volume. These KPIs help you spot trends and adjust your email marketing strategy for better results.
Tip: Focus on actionable data. The most effective dashboard highlights metrics that lead to real improvements in your campaigns.
Here’s a quick look at industry averages for key metrics:
| Metric | All Industries Average |
|---|---|
| Open Rate | 42.35% |
| CTR | 2.3% |
| CTOR | 5.3% |
| Bounce Rate | 2.48% |
| Unsubscribe | 0.22% |
Engagement metrics show how your audience interacts with your emails. These numbers tell you if your content connects or if you need to tweak your approach. The most predictive engagement metrics include:
| Metric | Why It Matters |
|---|---|
| Conversion rate | Shows how many recipients completed your goal |
| Revenue per email | Reveals the value of each email sent |
| Click-to-open rate | Measures clicks among those who opened the email |
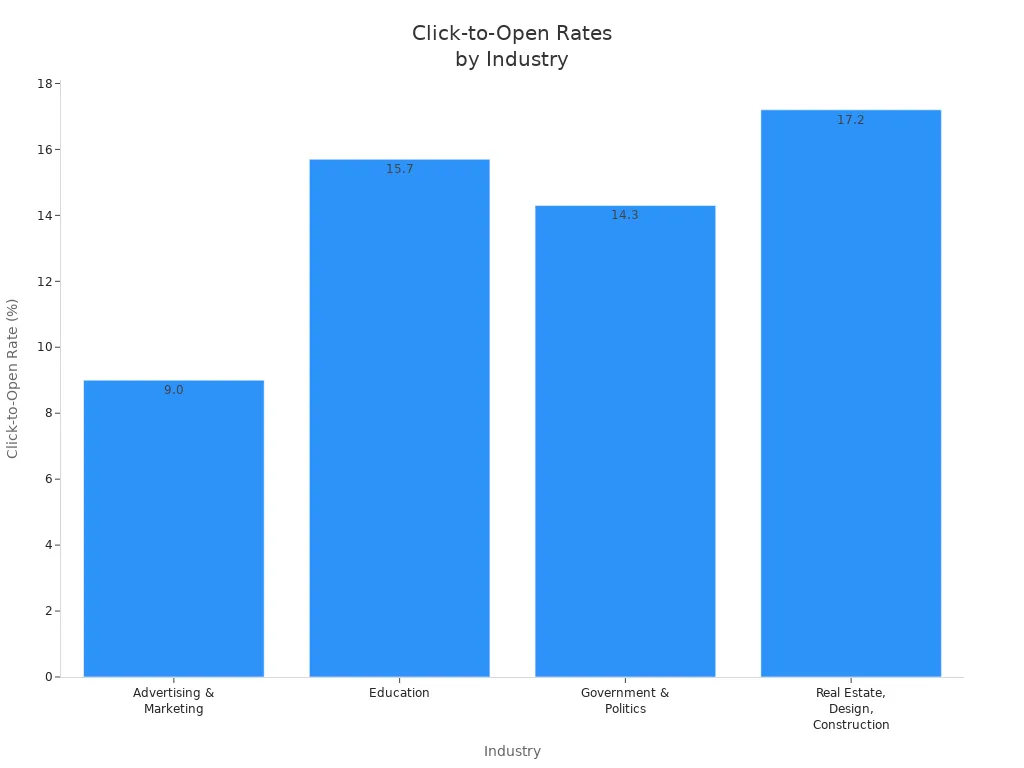
If you see a drop in engagement, try running A/B tests or reviewing your content. Each unsubscribe is a chance to refine your targeting and build a more engaged list. By tracking these metrics in your dashboard, you gain the insight needed to optimize every email marketing campaign and improve overall email performance.
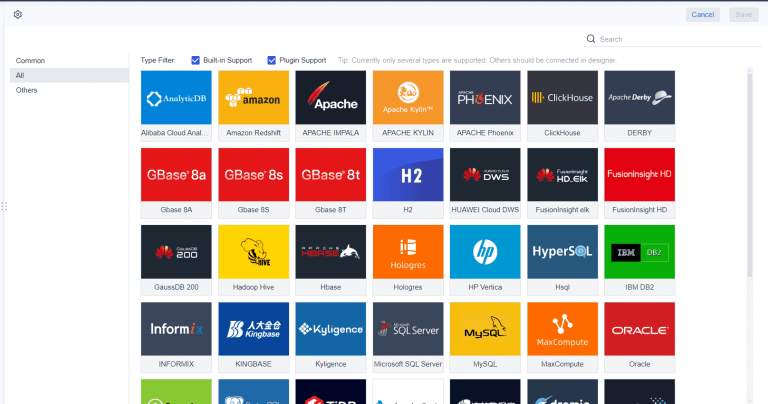
If you want to take your email analytics dashboard to the next level, FineReport gives you the tools you need. You can connect FineReport directly to your databases and use SQL to pull in all your email campaign data. This means you get real-time updates on your dashboard, so you always know how your email performance is trending.
FineReport stands out because it lets you customize your email analytics dashboard for any reporting need. You can build fixed-format reports or switch between different graphs to see trends in your email campaigns. The dashboard supports interactive visualizations, so you can drill down into specific metrics like open rates or click-through rates. You can even access your dashboard on your phone, making it easy to check email performance on the go.
Here’s what users like about FineReport:
| Feature | Rating |
|---|---|
| Ease of Use | 4.1/5 |
| Data Connectivity | Positive |
| Interactive Visualizations | Positive |
You can integrate FineReport with your existing email, CRM, and web analytics platforms. This lets you bring all your campaign data into one email analytics dashboard. You can customize the dashboard layout, choose which metrics to display, and set up real-time alerts for key performance changes.
Let’s walk through a simple example. Imagine you want to track open rates, click-through rates, and revenue per email for your latest campaign. You connect FineReport to your email platform and database. Then, you use the drag-and-drop interface to add charts for each metric. You can filter results by campaign, date, or audience segment. If you want to share insights, you can annotate the dashboard and send it to your team.
With FineReport, you get a flexible email analytics dashboard that adapts to your needs. You can monitor campaign performance, spot trends, and make quick decisions to improve your email results.
An email marketing dashboard gives you a clear path to campaign success. You see all your email data in one place, making it easy to spot trends and act fast. Tools like FineReport help you access critical business information, monitor performance in real time, and uncover new opportunities. You can understand customer interactions and drive growth with every email. Take time to review your current analytics. Focus on key metrics like open rate, click-through rate, and conversion rate. Keep learning from your email data and adjust your strategy for better results.

Best Dashboard Apps for Business Insights
What is a Call Center Dashboard and Why Does It Matter
What is a Reporting Dashboard and How Does it Work
What is An Interactive Dashboard and How Does It Work
What is a Call Center Metrics Dashboard and How Does It Work

The Author
Lewis
Senior Data Analyst at FanRuan
Related Articles

Payment Analytics Dashboard: 12 KPIs Every Operations Leader Should Track to Cut Revenue Leakage
Losing revenue to declines? Discover 12 essential KPIs to track in your payment analytics dashboard to stop leakage and manage disputes.
Lewis Chou
May 05, 2026

SOC Dashboard Explained: 12 Essential KPIs, Views, and Workflows Security Teams Use
Learn about SOC dashboards, the 12 essential KPIs for security teams, and how they centralize alerts and workflows for faster threat detection and response.
Lewis Chou
May 05, 2026

EMR Dashboard Guide: 12 Metrics to Track for Faster Clinical and Operational Decisions
Learn the 12 essential EMR dashboard metrics to track for faster clinical and operational decisions, improving patient flow and revenue cycle management.
Lewis Chou
May 05, 2026


