ESG reporting is the process of disclosing how a company performs on environmental, social, and governance issues that can affect risk, reputation, compliance, and long-term value. For CFOs, sustainability leaders, operations directors, HR heads, and compliance teams, the challenge is not just publishing a report—it is building one that is credible, decision-useful, and defensible under growing investor and regulatory scrutiny. A strong ESG reporting approach helps leadership connect non-financial data to business performance, identify gaps early, and communicate progress with clarity instead of vague claims.
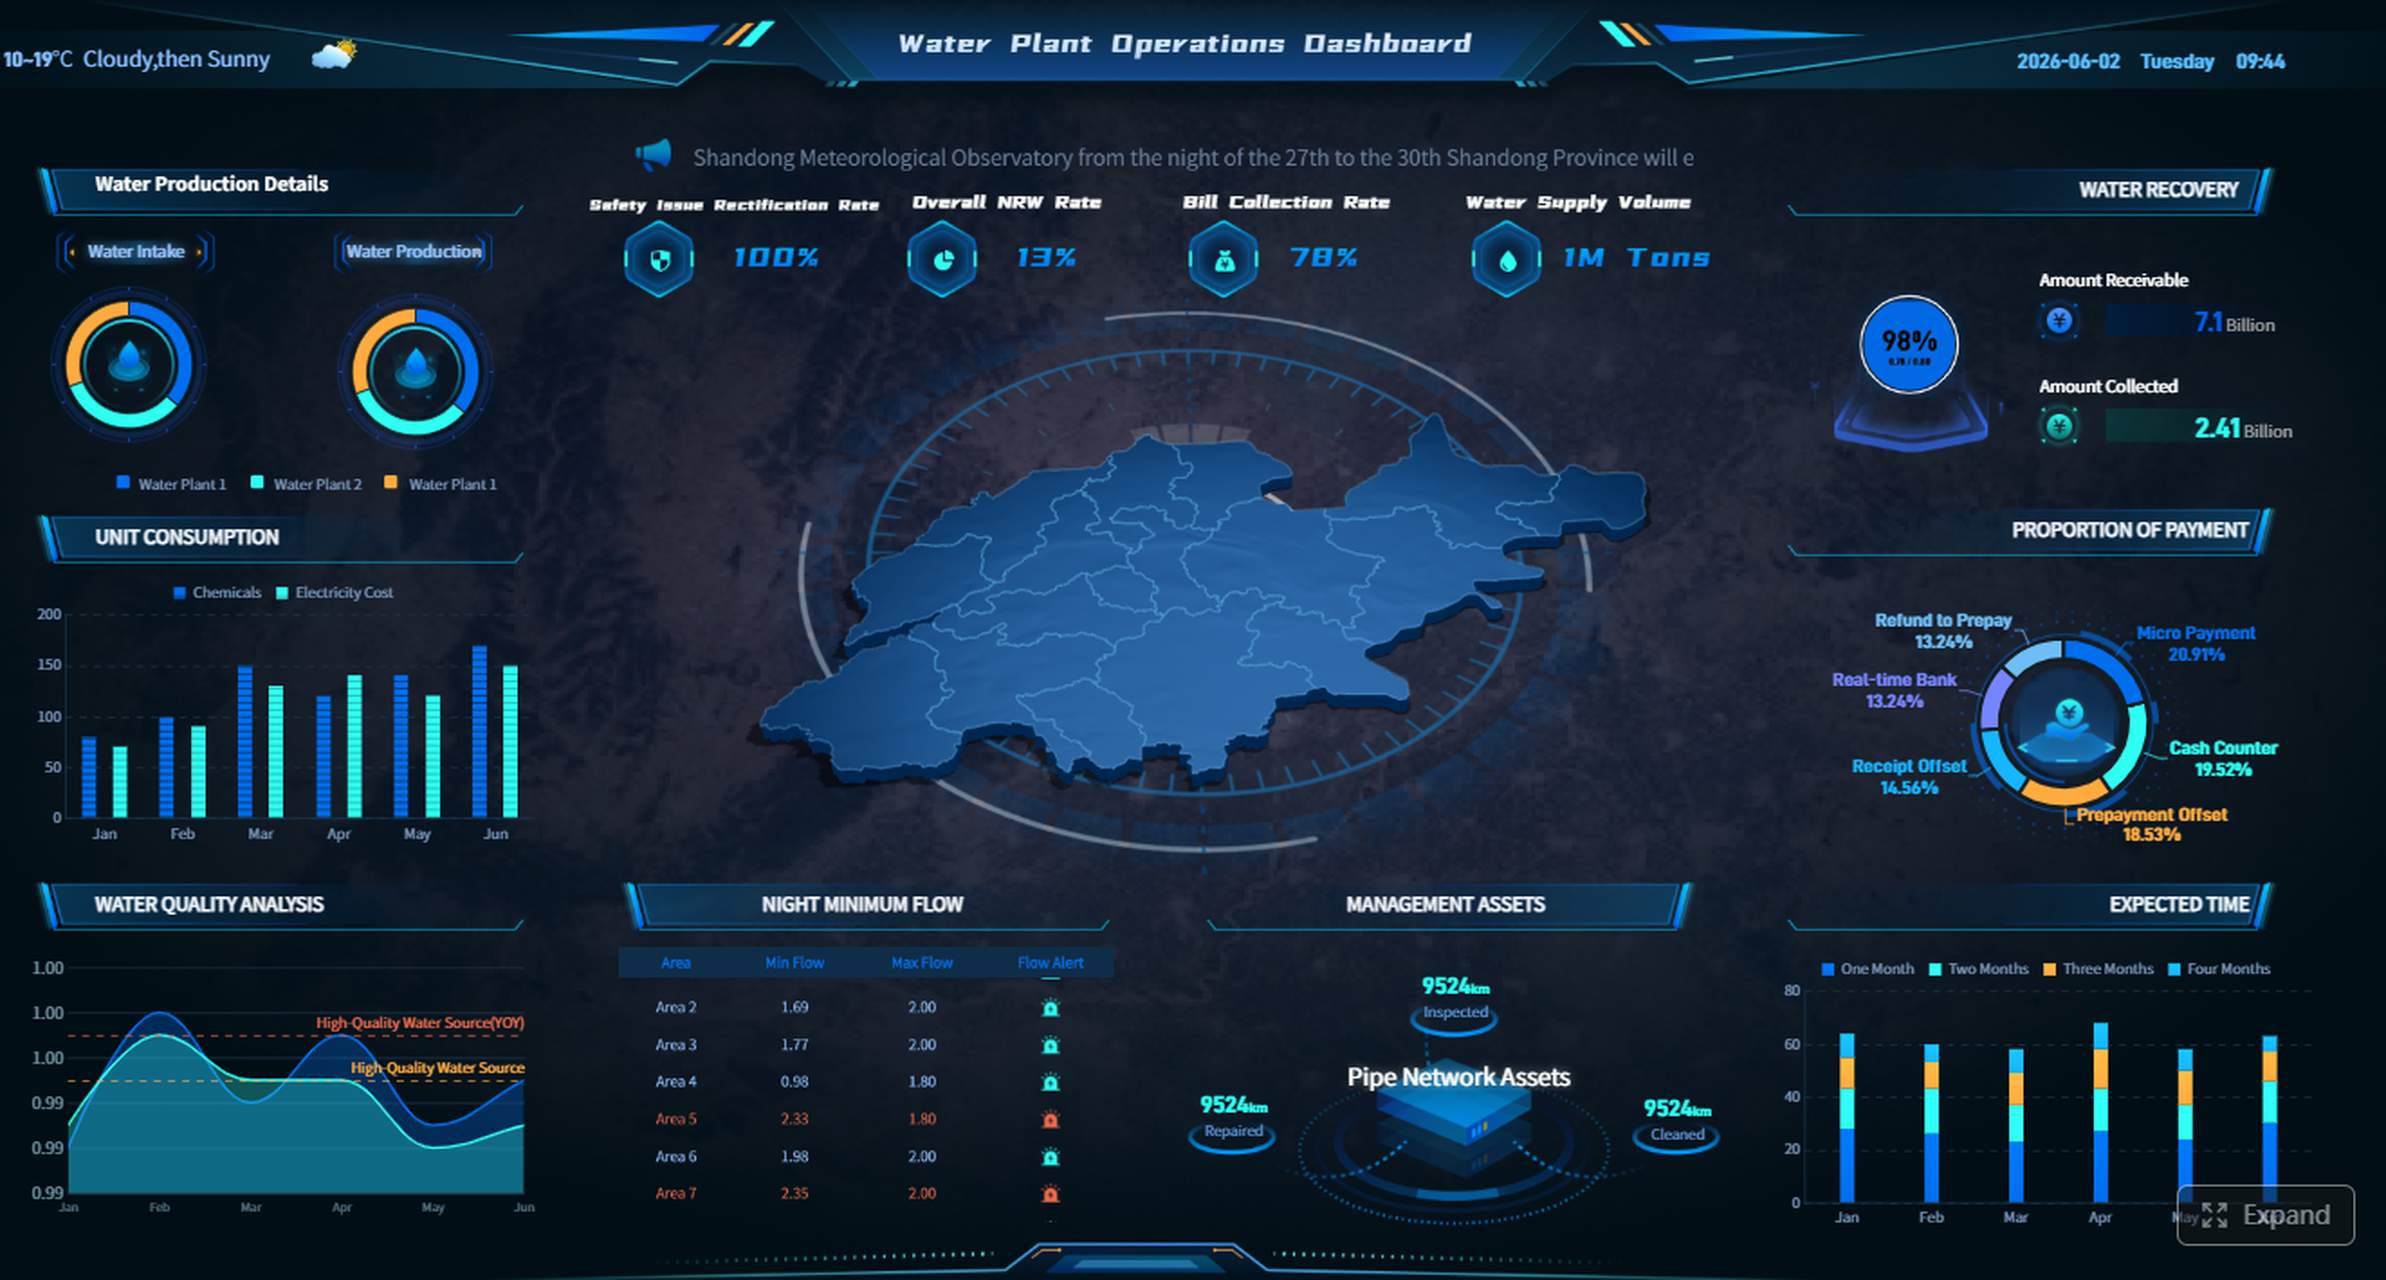
All reports in this article are built with FineReport.
ESG reporting refers to the structured disclosure of a company’s performance, risks, policies, and outcomes across environmental, social, and governance topics. In plain language, it shows how the business manages issues such as emissions, energy, labor practices, safety, ethics, and board oversight.
This matters because stakeholders increasingly evaluate companies on more than revenue and profit. Investors want better visibility into operational resilience and long-term risk. Customers want evidence behind sustainability claims. Employees want to work for organizations with responsible practices. Regulators want comparable, auditable disclosures. Strong ESG reporting helps each of these groups assess whether a company is managing its impacts and responsibilities effectively.
ESG reporting is often confused with sustainability reporting, but they are not exactly the same. Sustainability reporting typically focuses on a company’s broader environmental and social impact and long-term sustainability agenda. ESG reporting is usually more structured around decision-making, risk, governance, and measurable disclosures that investors, boards, and regulators can evaluate. Related disclosures—such as climate disclosures, diversity reporting, modern slavery statements, or annual governance statements—may sit alongside ESG reporting or feed into it.
For finance leaders and executive teams, ESG reporting has become a strategic management tool. It helps quantify exposure to climate risk, supply chain disruption, human capital issues, and governance failures. It also supports capital access, strengthens internal accountability, and improves stakeholder communication. In practice, the best companies no longer treat ESG reporting as a once-a-year publishing task. They treat it as an operating discipline.
Core sections of ESG reporting
A credible ESG report should be easy to navigate, clear on scope, and balanced in how it presents both progress and gaps. The sections below form the backbone of a report stakeholders can trust.
Executive summary and reporting scope
The executive summary should explain what matters most in the company’s ESG reporting this year. It should summarize major priorities, key changes, material developments, and top outcomes without burying readers in technical detail.
At minimum, this section should clarify:
The reporting period
The intended audience
The organizational boundary
The entities and subsidiaries included
The geographic regions covered
The business units and operations within scope
Any major acquisitions, divestitures, or methodology changes affecting comparability
If the scope is unclear, the entire report becomes harder to interpret. For example, emissions data may cover owned operations only, while safety metrics may include contractors in selected regions. Stakeholders need to understand exactly what is being measured and where.
Governance and oversight
Governance is where ESG reporting gains credibility. This section should explain who oversees ESG topics at the board level, who is accountable in management, what policies apply, and how controls are maintained.
A strong governance section usually covers:
Board committee oversight of ESG issues
Executive ownership and reporting lines
Ethics and compliance policies
Anti-corruption and whistleblower programs
Risk management processes
Internal controls for ESG data
Roles of finance, legal, HR, operations, and sustainability teams
Links between ESG performance and compensation, if applicable
This is the section many companies underwrite, but stakeholders pay close attention to it. If a report contains ambitious goals but little detail on accountability, readers may question whether the program is operational or merely aspirational.
Environmental metrics and disclosures
Environmental disclosures usually draw the most scrutiny because they often involve regulatory expectations, public targets, and direct cost implications. This section should report measurable environmental performance and explain the methodologies behind it.
Common areas include:
Energy consumption
Scope 1 emissions
Scope 2 emissions
Scope 3 emissions where relevant
Climate-related risks and opportunities
Water withdrawal and consumption
Waste generation and diversion
Resource efficiency
Pollution or environmental incidents
Climate or environmental targets
Good ESG reporting does more than list totals. It explains baseline years, operational boundaries, calculation methods, assumptions, and whether data was estimated. It also shows progress against goals and makes year-over-year changes understandable.
Social and workforce information
The social section should explain how the company manages people-related risks, workforce development, inclusion, safety, and community impact. This is where readers assess whether the organization’s people practices align with its stated values and operating model.
Typical content includes:
Workforce composition
Diversity and inclusion metrics
Hiring and turnover rates
Employee engagement results
Training and development
Health and safety performance
Human rights commitments
Labor practices
Supply chain social standards
Community investment and impact
The strongest reports combine quantitative indicators with concise narrative. Numbers show performance. Context explains why performance changed, what actions were taken, and what remains difficult. For example, a rising turnover rate may reflect labor market pressure, restructuring, or a deliberate strategy shift. The report should say so directly.
ESG reporting metrics that stakeholders expect to see
Stakeholders do not just want a long narrative. They want a disciplined set of metrics and disclosures that show what is material, how it is measured, and whether management is making progress.
Quantitative metrics
Quantitative metrics are the measurable indicators at the center of ESG reporting. They should be defined consistently and presented with year-over-year comparisons wherever possible.
Key Metrics (KPIs)
Scope 1 emissions: Direct greenhouse gas emissions from owned or controlled sources.
Scope 2 emissions: Indirect emissions from purchased electricity, steam, heating, or cooling.
Scope 3 emissions: Other indirect emissions across the value chain, such as purchased goods, travel, logistics, or product use.
Energy consumption: Total energy used across operations, often broken down by source and renewable share.
Energy intensity: Energy use relative to output, revenue, floor space, or production volume.
Water withdrawal: Total water drawn from all sources for operations.
Water consumption: Water used and not returned to the original source.
Waste generated: Total waste produced, often split by hazardous and non-hazardous categories.
Waste diversion rate: Share of waste diverted from landfill through recycling, reuse, or recovery.
Recordable incident rate: Frequency of work-related injuries or illnesses based on hours worked.
Lost time injury rate: Rate of injuries resulting in time away from work.
Employee turnover: Percentage of employees leaving during the reporting period.
Gender representation: Share of women across workforce, management, and board levels.
Training hours per employee: Average learning and development hours per employee.
Supplier ESG assessments: Percentage or number of suppliers assessed for ESG risks or compliance.
Board independence: Proportion of board members classified as independent.
Ethics incidents or compliance cases: Number of reported, substantiated, or resolved conduct-related cases.
These metrics should be shown in trend format, not isolated snapshots. A single-year number gives limited insight. Three-year trends, target lines, and segment breakdowns are far more useful.
Qualitative disclosures
The numbers alone are not enough. Qualitative disclosures explain why certain ESG topics matter, how they are governed, and what management is doing about them.
Important qualitative elements include:
Material ESG issues and why they were selected
Policies and commitments
Governance structures and board oversight
Risk identification and mitigation processes
Climate transition plans
Human rights and labor management approach
Stakeholder engagement process
Management actions taken during the year
Explanations for underperformance or data limitations
This narrative should be concrete. Generic statements such as “we care deeply about sustainability” add little value unless backed by specific policy, process, or outcome detail.
Materiality, targets, and progress tracking
A report becomes far more credible when it shows how the company defines what matters most. Materiality should link ESG topics to business strategy, risk exposure, stakeholder concern, and operational impact.
This section should explain:
How material topics were identified
Which stakeholders were engaged
How priorities were assessed
Whether financial materiality, impact materiality, or double materiality was considered
How selected topics map to business strategy and risk management
Targets should be time-bound and measurable. Instead of saying “reduce emissions over time,” a credible report states the baseline year, the target percentage, the target year, and current progress. Interim milestones are equally important because they show whether management is on track.
How to structure a credible ESG reporting process
Building a reliable ESG reporting process requires much more than collecting data at year-end. It requires governance, systems, controls, and cross-functional ownership.
Choose frameworks and reporting standards
The first step is deciding which frameworks, standards, or regulations the report will align with. The right choice depends on your industry, geography, investor base, and reporting obligations.
Most organizations need to balance several goals at once:
Regulatory compliance
Investor relevance
Industry comparability
Internal usability
Consistency over time
The key is not to chase every framework at once. Start with the reporting requirements and stakeholder expectations most relevant to your business, then build a disclosure architecture that can scale. Consistency matters because users want comparable data over time, not a different structure every year.
Build reliable data collection and controls
This is where many ESG reporting programs succeed or fail. Reliable data collection requires defined owners, standard definitions, documented assumptions, and review controls across departments.
In practice, this means:
Assigning metric ownership by function
Creating clear calculation methodologies
Establishing reporting calendars and submission workflows
Validating source data before consolidation
Maintaining audit trails for changes and estimates
Reconciling ESG figures to operational and financial data where relevant
Preparing documentation for internal review and external assurance
Finance often plays a central role here because ESG reporting increasingly demands the same discipline as financial reporting. Operations supplies environmental data. HR owns workforce metrics. Legal and compliance support governance disclosures. Sustainability teams coordinate methodology and stakeholder alignment. Without clear ownership, reporting quality degrades quickly.
Consider external support and ESG reporting services
External support can be useful when internal teams face tight timelines, evolving regulations, or system limitations. Companies often bring in outside expertise for framework mapping, benchmarking, assurance readiness, data architecture, or report drafting.
When evaluating ESG reporting services, look for providers that can help with:
Choose partners that understand your sector and can work with your internal systems, not just deliver slide decks. The goal is to strengthen your long-term reporting capability, not create dependency.
Actionable best practices for implementing ESG reporting
If you want ESG reporting to be credible and scalable, treat it like an enterprise reporting program rather than a marketing project. These are the practices I recommend most often.
1. Start with a materiality-led reporting design
Identify the ESG topics that are genuinely relevant to your business model, risk profile, and stakeholder concerns. Do not begin by collecting every possible metric. Begin by deciding what decision-makers and external readers actually need to know.
2. Define one source of truth for every KPI
For each metric, assign an owner, source system, methodology, review process, and reporting frequency. If emissions come from one team, safety data from another, and headcount from a third, you need a clear data dictionary and approval workflow.
3. Build year-over-year comparability into the process
Stakeholders want trend visibility. Lock down boundaries, definitions, and formulas early. When a methodology changes, disclose it clearly and restate prior periods where appropriate.
4. Write balanced commentary, not promotional copy
The strongest ESG reporting acknowledges both progress and gaps. If a target is off track, explain why, what changed, and what corrective actions are underway. This builds trust far faster than selective storytelling.
5. Prepare for assurance before it is required
Even if limited or reasonable assurance is not mandatory today, your process should be built as if review could happen tomorrow. Maintain evidence, assumptions, version history, and sign-off records from the start.
These best practices turn ESG reporting from a reactive annual exercise into a repeatable management process.
Real-world ESG reporting examples and common mistakes to avoid
Strong ESG report examples usually look different by industry, but they share a few common traits. They are structured logically, focused on material issues, transparent about methodology, and honest about where progress is uneven.
What strong ESG report examples have in common
High-quality ESG reporting typically includes:
A clear executive summary
Defined reporting boundaries
Material metrics with multi-year trends
Transparent calculation notes
Specific targets and milestone updates
Balanced explanation of wins and shortfalls
Visuals and tables that simplify complex data
Obvious alignment between business strategy and disclosures
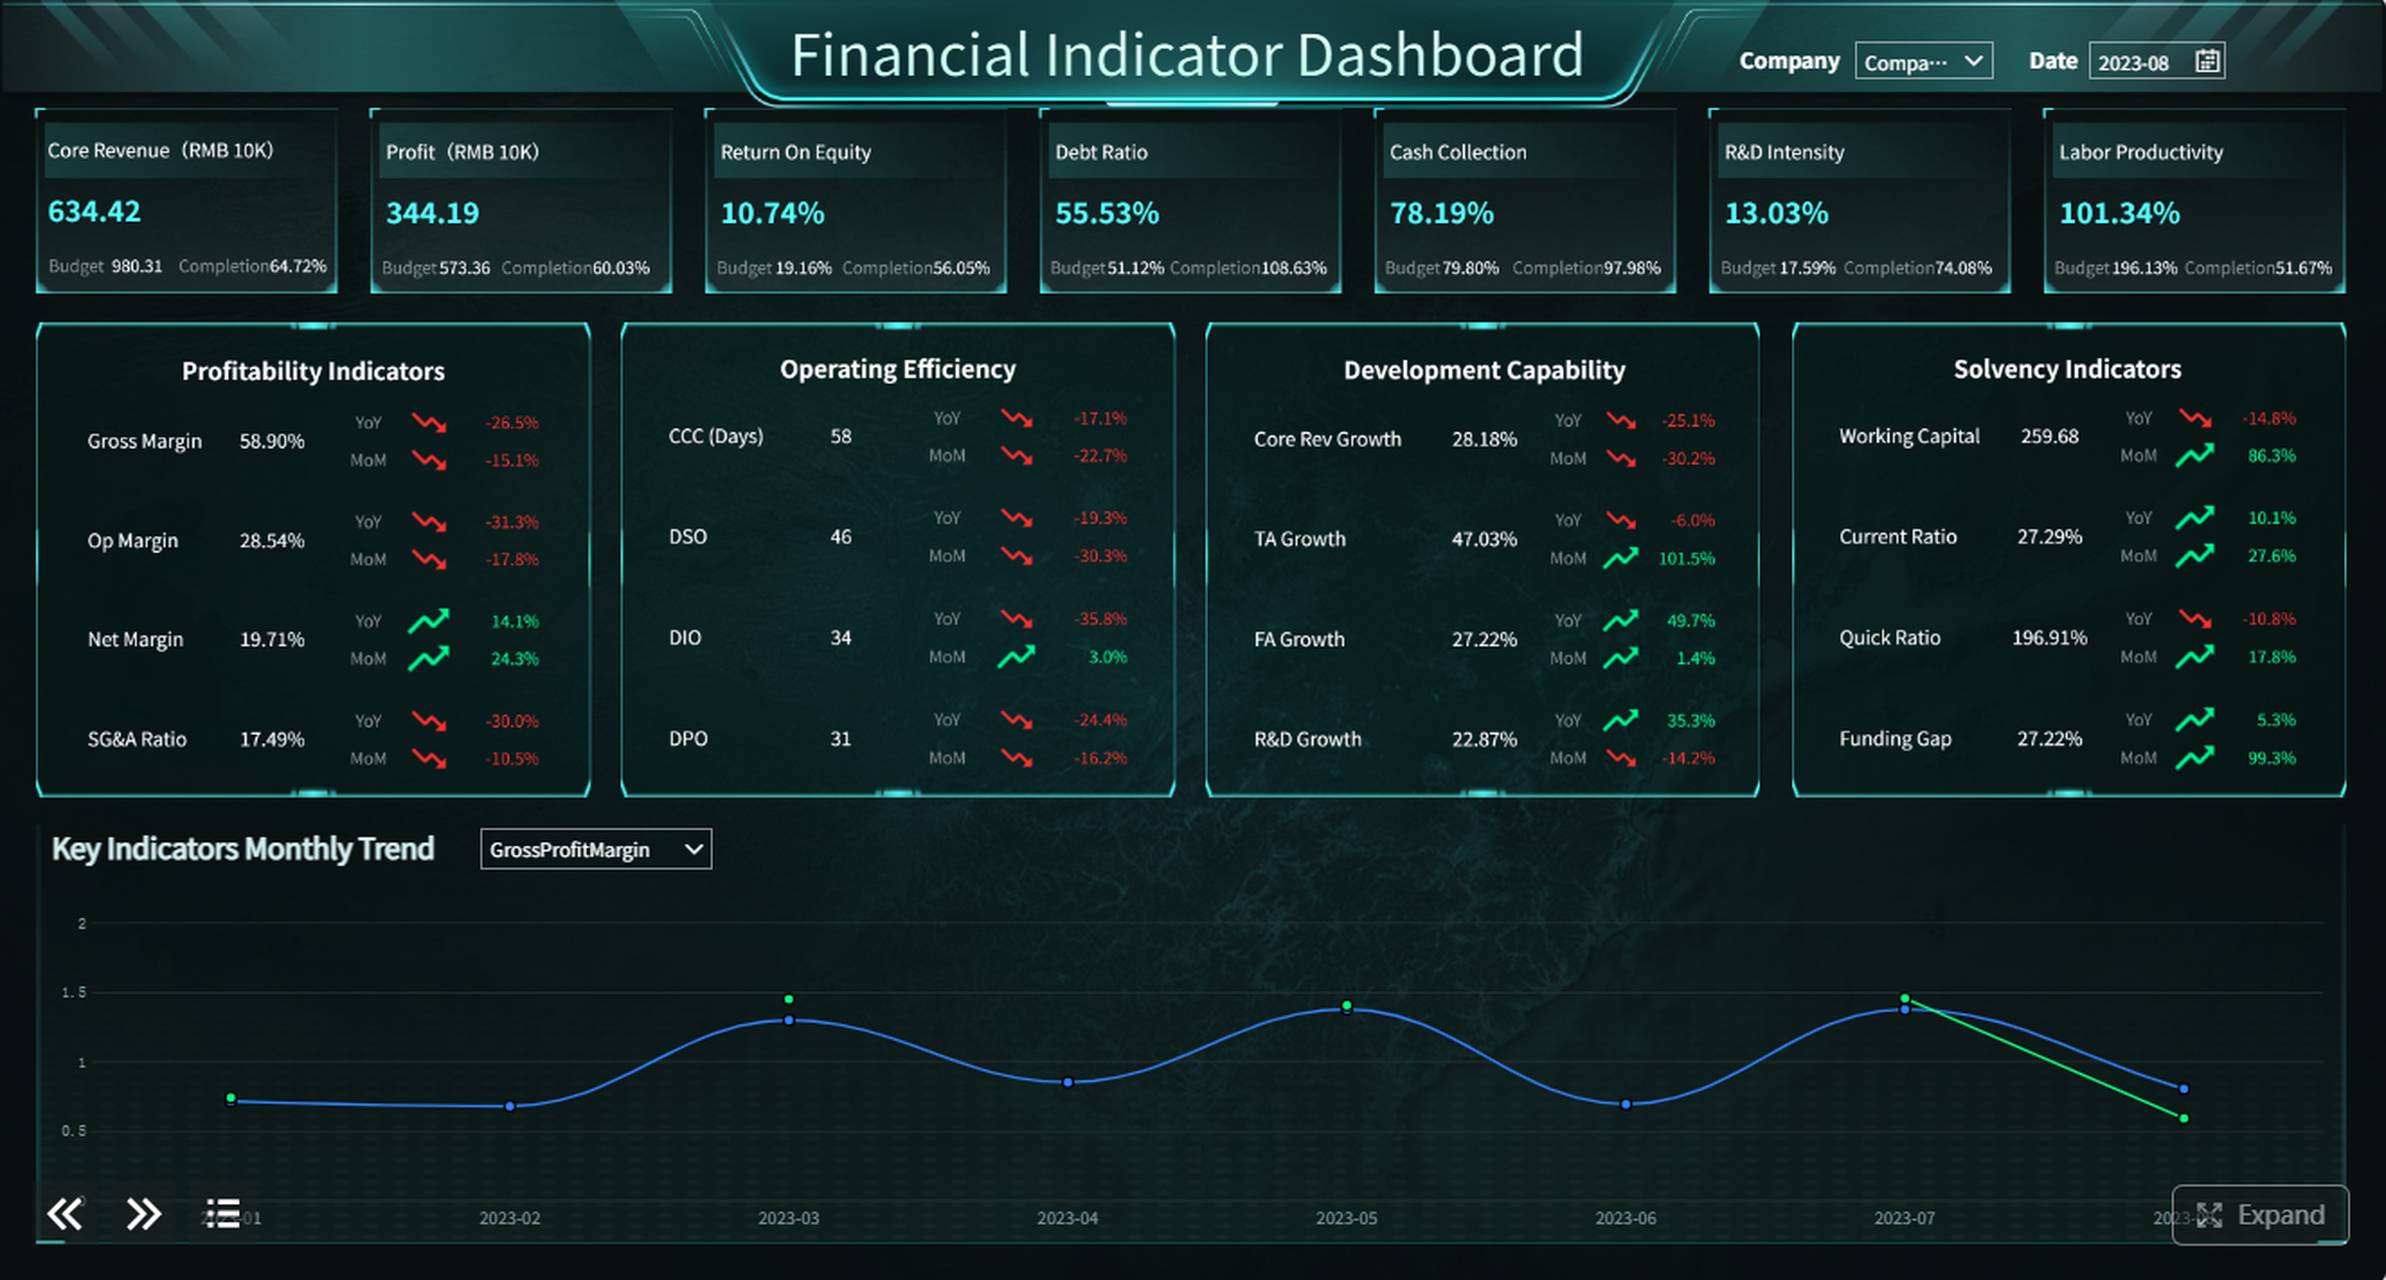
The best reports are easy for both analysts and non-specialists to read. They use dashboards, scorecards, and summary tables to make performance understandable without oversimplifying it.
Common reporting mistakes
Many ESG reports fail not because the company lacks effort, but because the report lacks discipline. Common mistakes include:
Making vague claims without supporting evidence
Changing reporting boundaries without explanation
Omitting definitions for key metrics
Presenting selective data that flatters performance
Ignoring governance and control details
Overloading readers with immaterial information
Failing to explain risks, trade-offs, or negative trends
Publishing inconsistent numbers across sections
A report should answer hard questions before stakeholders ask them. If it leaves major assumptions unexplained, confidence drops quickly.
A practical checklist before publication
Before releasing your ESG reporting, confirm the following:
All required entities, geographies, and business units are included
Boundary consistency
Scope is consistent across metrics or clearly explained where different
Methodology clarity
Definitions, formulas, assumptions, and estimation methods are documented
Target accuracy
Baselines, target years, and progress calculations are correct
Framework alignment
Disclosures map correctly to selected standards or regulatory requirements
Leadership review
Legal, finance, sustainability, and executive stakeholders have signed off
Narrative balance
The report explains both achievements and gaps
Accessibility
Tables, charts, summaries, and structure make the report easy to use
This final review is where credibility is protected. A polished design cannot compensate for unclear numbers or weak governance narrative.
Make ESG reporting smarter with FineReport
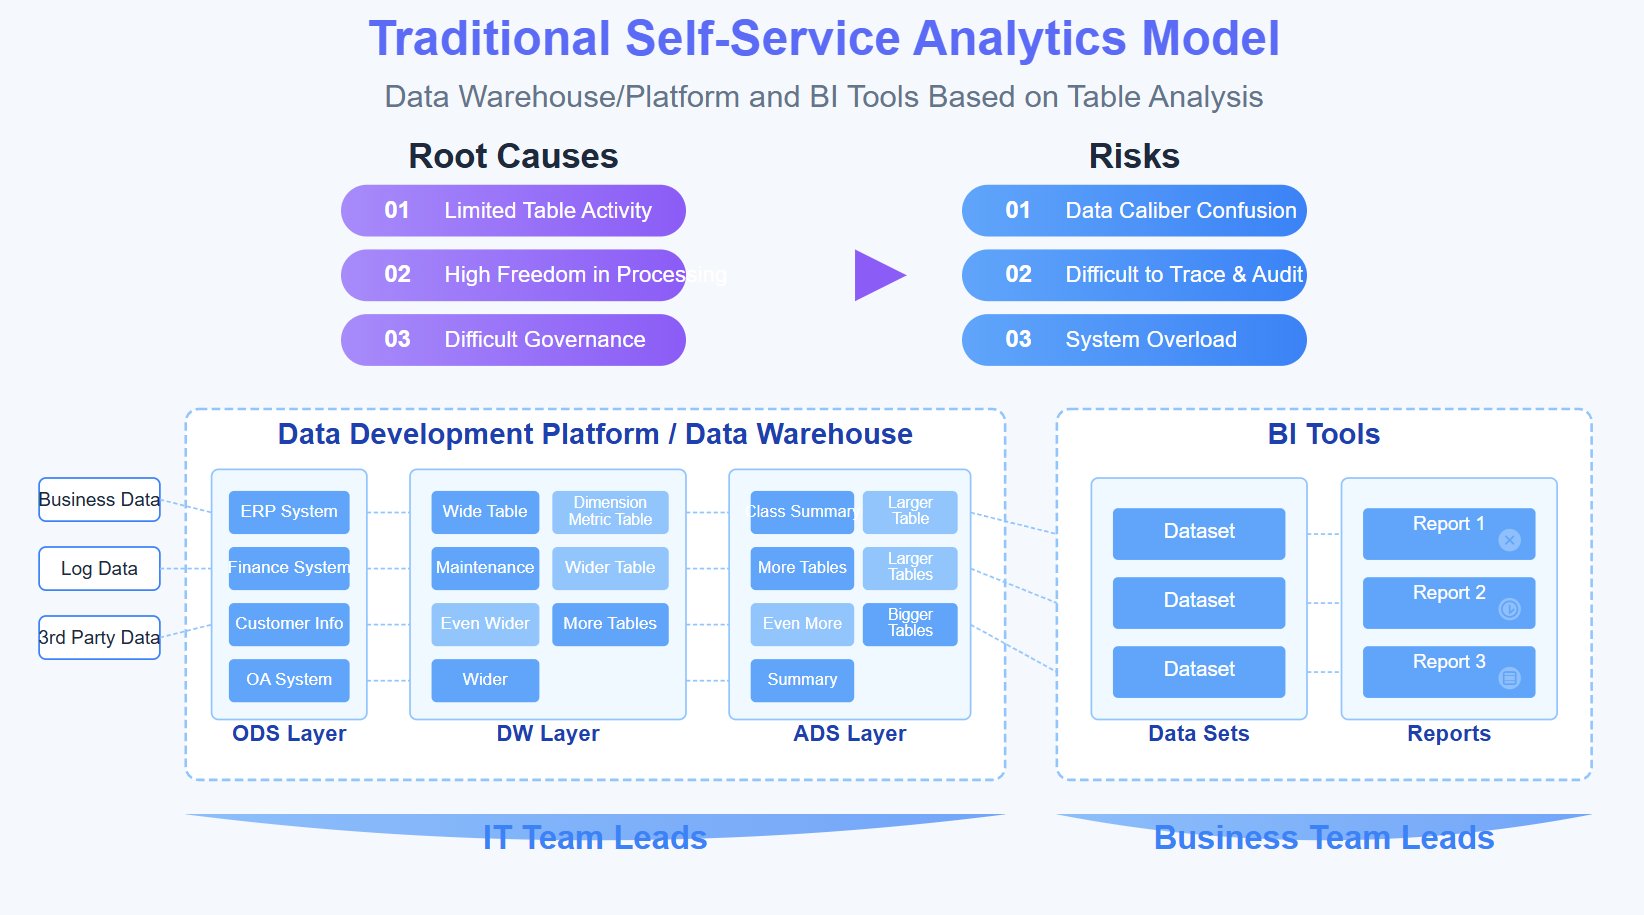
At enterprise scale, ESG reporting quickly becomes difficult to manage manually. Data comes from finance, operations, HR, compliance, procurement, and regional teams. Definitions change. Targets evolve. Leadership wants dashboards, regulators want consistency, and stakeholders expect faster answers.
Building this manually is complex; use FineReport to utilize ready-made templates and automate this entire workflow.
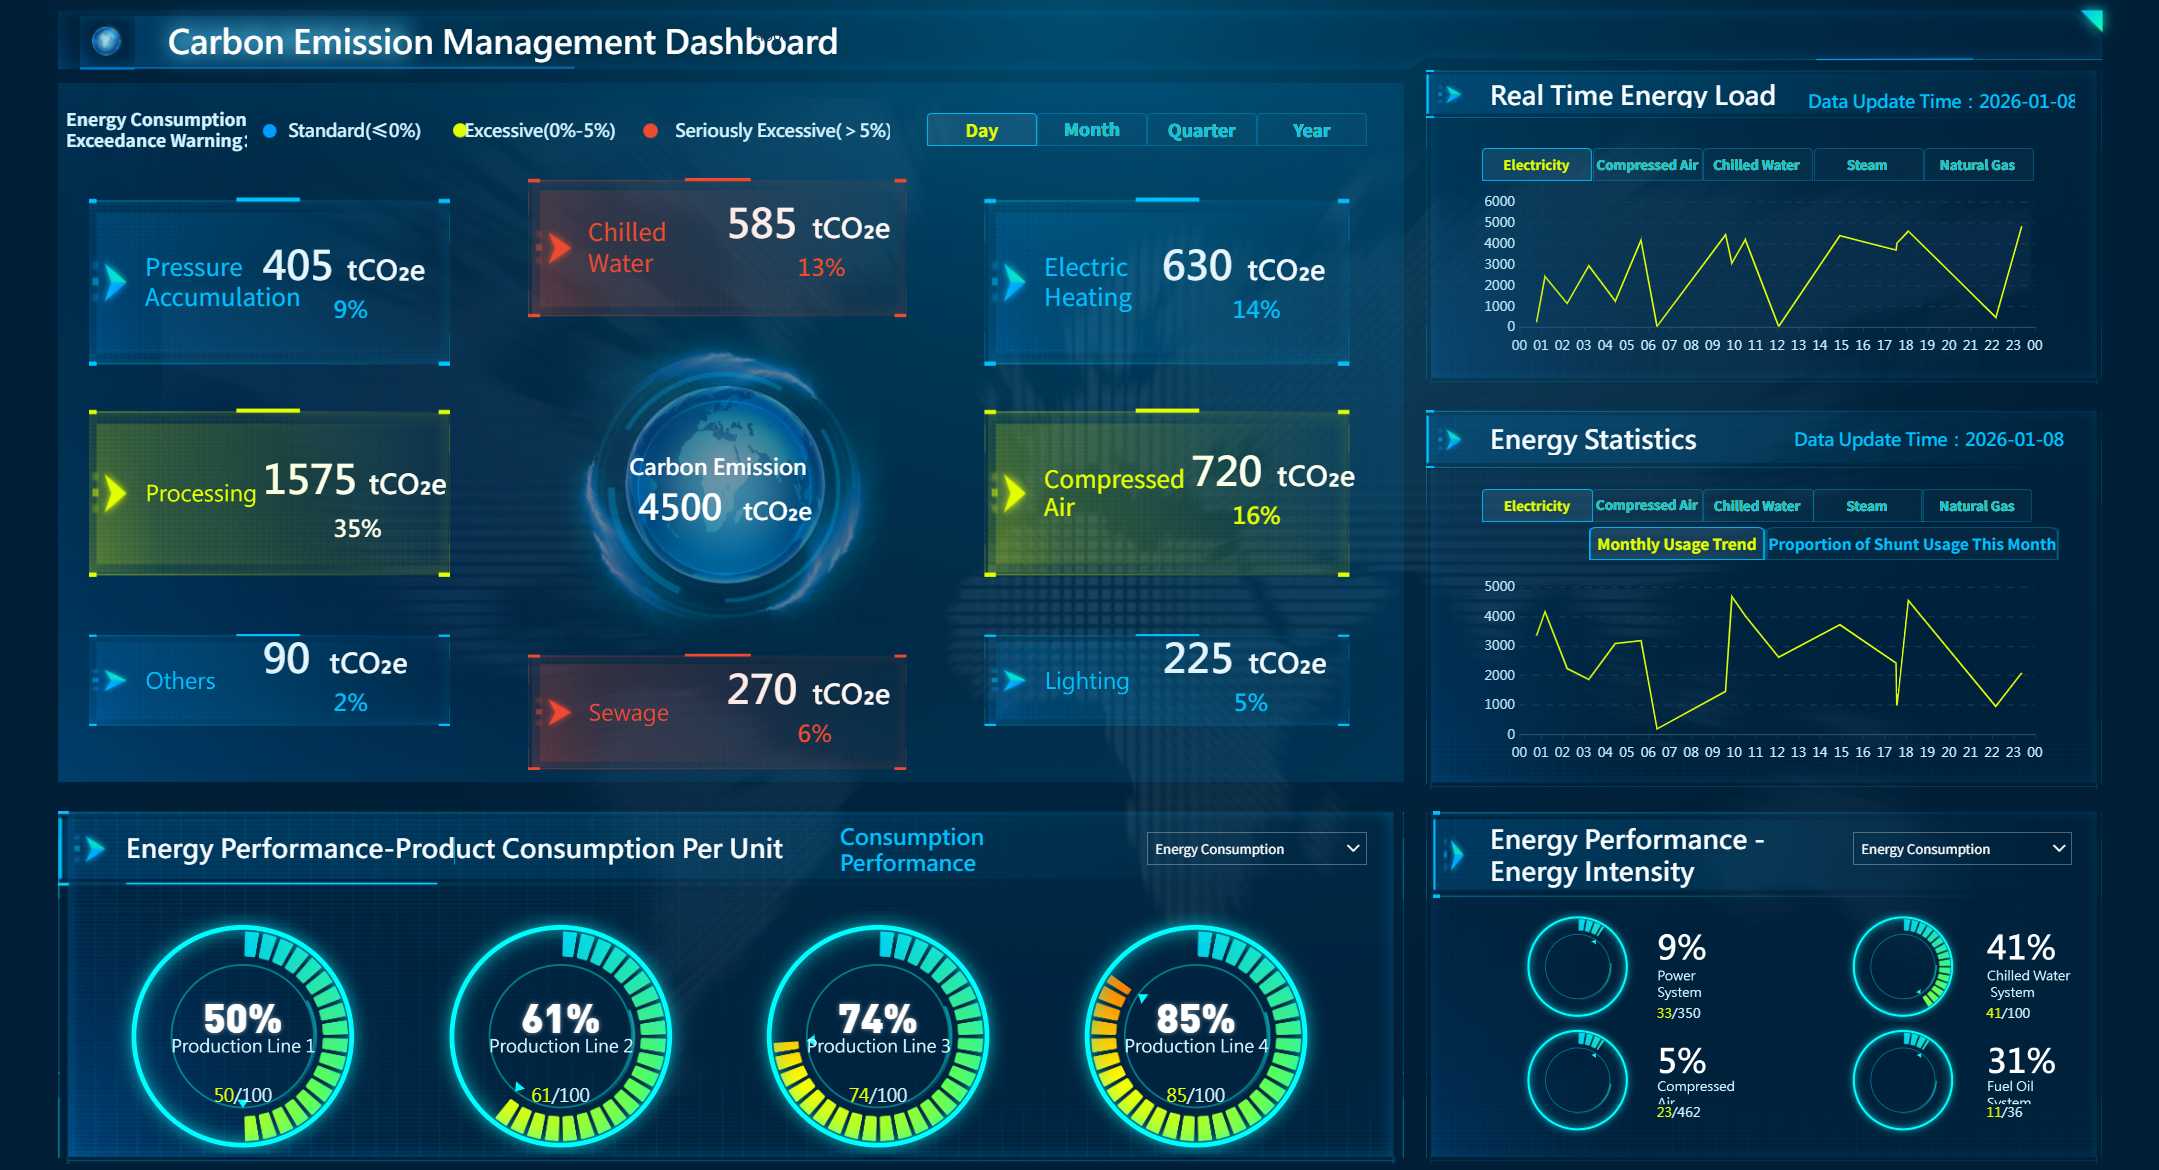
With FineReport, teams can centralize ESG data collection, standardize KPI definitions, build dynamic dashboards, and produce reader-friendly reports with less spreadsheet dependency. Instead of stitching together metrics from disconnected files, you can create a governed reporting process with visual tracking for emissions, safety, workforce data, supplier assessments, and governance indicators.
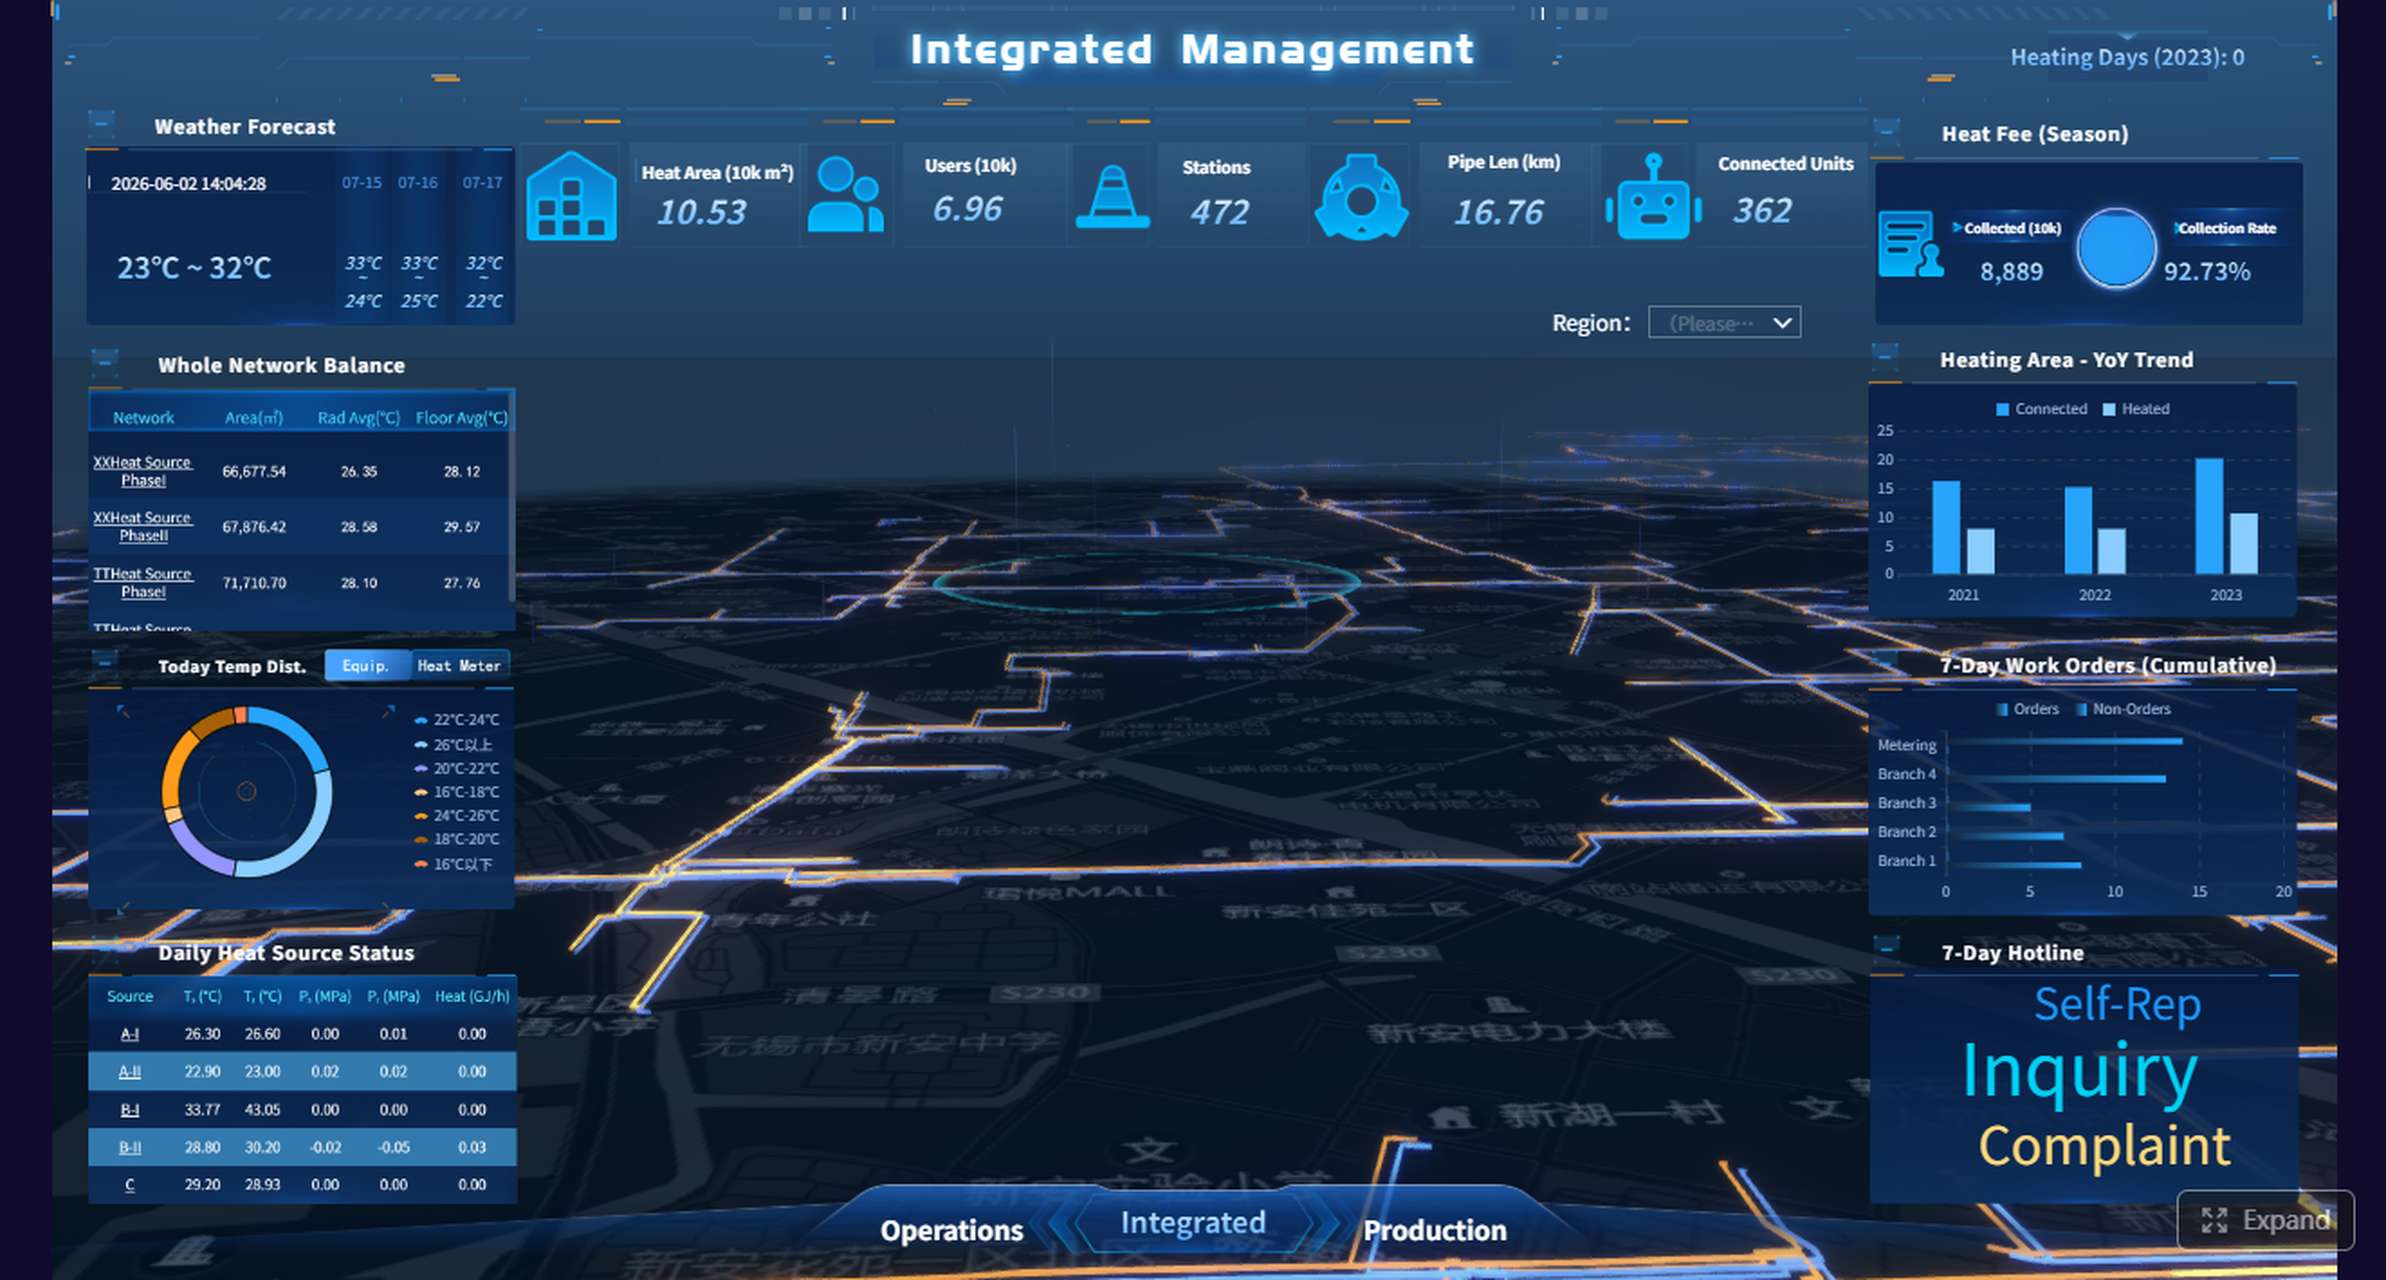
Create executive dashboards and board-ready summaries
Track progress against ESG targets in real time
Standardize report templates across regions or business units
Improve data transparency and approval workflows
Present ESG reporting in a clearer, more actionable format
Get Ready-to-Use Dashboard Templates in Fine Gallery
If your team is under pressure to produce more reliable ESG reporting with less manual effort, the right reporting platform can make the difference between a stressful annual scramble and a repeatable, controlled process.
An ESG report should include reporting scope, governance and oversight, material ESG topics, measurable environmental, social, and governance metrics, targets, methodologies, and year-over-year performance. It should also explain accountability, boundaries, and any assumptions or changes that affect comparability.
ESG reporting is usually more structured around risks, controls, governance, and investor-useful metrics, while sustainability reporting often takes a broader view of long-term environmental and social impact. In practice, the two often overlap, but ESG reporting tends to be more disclosure-focused and measurable.
The most important ESG metrics are the ones that are material to the business and its stakeholders. Common examples include greenhouse gas emissions, energy use, water, waste, workforce diversity, health and safety, ethics, compliance, and board oversight.
Companies usually start with a materiality assessment to identify the ESG issues that have the greatest business impact and stakeholder relevance. They then align disclosures to their reporting scope, industry risks, strategy, and applicable regulations or frameworks.
Governance shows who is responsible for ESG performance and how the company manages controls, risks, and decision-making. Without clear oversight and accountability, ESG claims can appear weak or difficult for stakeholders to trust.
Product Trial
FineReport
Pixel-perfect reports · Interactive dashboards · Easy data entry · Digital twins
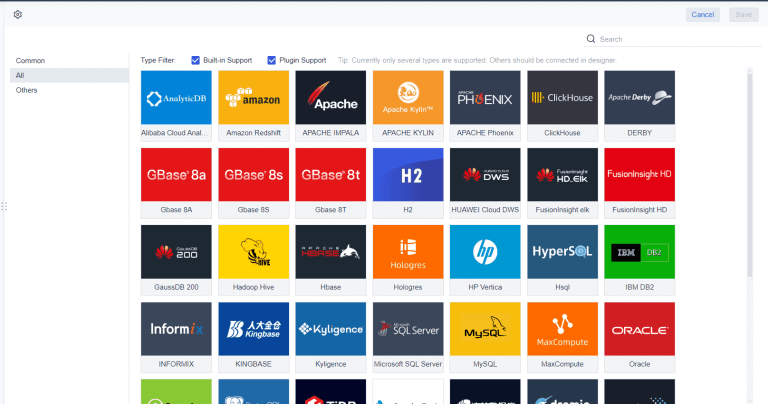 Data Connection of