Identifying leading data intelligence companies helps you achieve better business outcomes. You need the right business intelligence platform to support data-driven decision-making. Many businesses report that adopting data intelligence tools enhances decision-making performance. When you select a platform, you gain access to centralized data and deeper customer insights. The right choice improves operational efficiency and fosters a culture focused on data. The table below outlines how platform selection can impact your organization:
Benefit
Description
Faster, informed decision-making
Centralizes data for quick access to accurate insights, enabling timely decisions.
Deeper customer insights
Uncovers customer behaviors to guide targeted marketing, enhancing engagement and satisfaction.
Operational efficiency
Identifies inefficiencies through real-time monitoring, optimizing resources and improving productivity.
Fostering data-driven culture
Encourages decisions based on data, promoting accountability and strategic thinking within teams.
Leading Data Intelligence Companies
Overview of Top Platforms
You see many data intelligence companies shaping the future of analytics and business intelligence platforms. Industry analysts like IDC, BARC, and Gartner recognize erwin Data Intelligence by Quest as a leader in this space. These companies help you manage data, improve data integration, and drive data-driven decisions. You also find market share leaders such as Techsalerator, Statista, IBISWorld, and MarketResearch.com. They provide platforms that deliver market share data, competitive insights, and analytics for a wide range of industries.
Here is a quick look at how analysts recognize top data intelligence companies:
Analyst
Recognition
IDC
Recognized erwin Data Intelligence by Quest as a leader in data intelligence platforms.
BARC
Named erwin as a Market Leader in Data Intelligence Platforms 2025.
Gartner
Included in the 2025 Magic Quadrant for Data & Analytics Governance Platforms.
You will notice that these platforms offer a variety of features. Some focus on data integration and governance, while others provide advanced analytics and real-time insights. The adoption of business intelligence platforms continues to rise in industries like IT, BFSI, retail, manufacturing, and healthcare. For example, IT and telecommunication companies dominate the market, while healthcare and retail sectors increasingly use business intelligence software for secure analytics and instant data insights.
Key Differentiators
What sets leading data intelligence companies apart? You benefit from their focus on innovation, integration, and user-friendly features. Many platforms introduce new features each year. For instance, Cogram lets you query databases in plain English, while Midjourney and Let’s Enhance use AI to improve visual content. In finance, ComplyAdvantage and Plaid deliver real-time data insights and compliance solutions. In healthcare, platforms like Clarify and AiCure use analytics to improve patient outcomes.
You also see that top business intelligence platforms support seamless data integration, self-service analytics, and robust governance. These features help you discover valuable data insights, streamline data analysis, and enable real-time decision-making. As you explore the detailed reviews ahead, you will learn how each platform’s unique features and integration capabilities can support your organization’s data-driven journey.
You can compare thetop business intelligence platforms using the table below. This table helps you see how each platform supports data integration, analytics, and real-time insights. You will notice differences in features, pricing, and integration options.
60+ data connectors, big data, cloud, API, custom SDK
Subscription, enterprise licensing
Zero-code interface, scalable for large organizations
Tableau
Advanced visualization, interactive dashboards, automated insights, data discovery
Wide data source support, cloud and on-premises
Subscription, tiered plans
Leading visual analytics, strong community
Power BI
Real-time dashboards, AI analytics, seamless Microsoft integration, data modeling
Microsoft ecosystem, cloud, on-premises, APIs
Freemium, subscription
Deep Office 365 integration, cost-effective
Qlik Sense
Associative analytics engine, self-service, automated insights, data storytelling
Broad data integration, cloud, on-premises
Subscription, enterprise
Associative data model, strong data discovery
Looker
Data modeling, embedded analytics, real-time reporting, governed data access
Cloud data warehouses, APIs, custom integrations
Subscription, usage-based
Modern data platform, embedded analytics
Feature Highlights
When you evaluate business intelligence platforms, you should focus on features that support your data-driven goals. These platforms offer strongdata integration, allowing you to connect to both cloud and on-premises sources. Centralizing your data in one accessible location increases productivity and streamlines workflows. You can use automated insights and machine learning to identify trends and forecast outcomes.
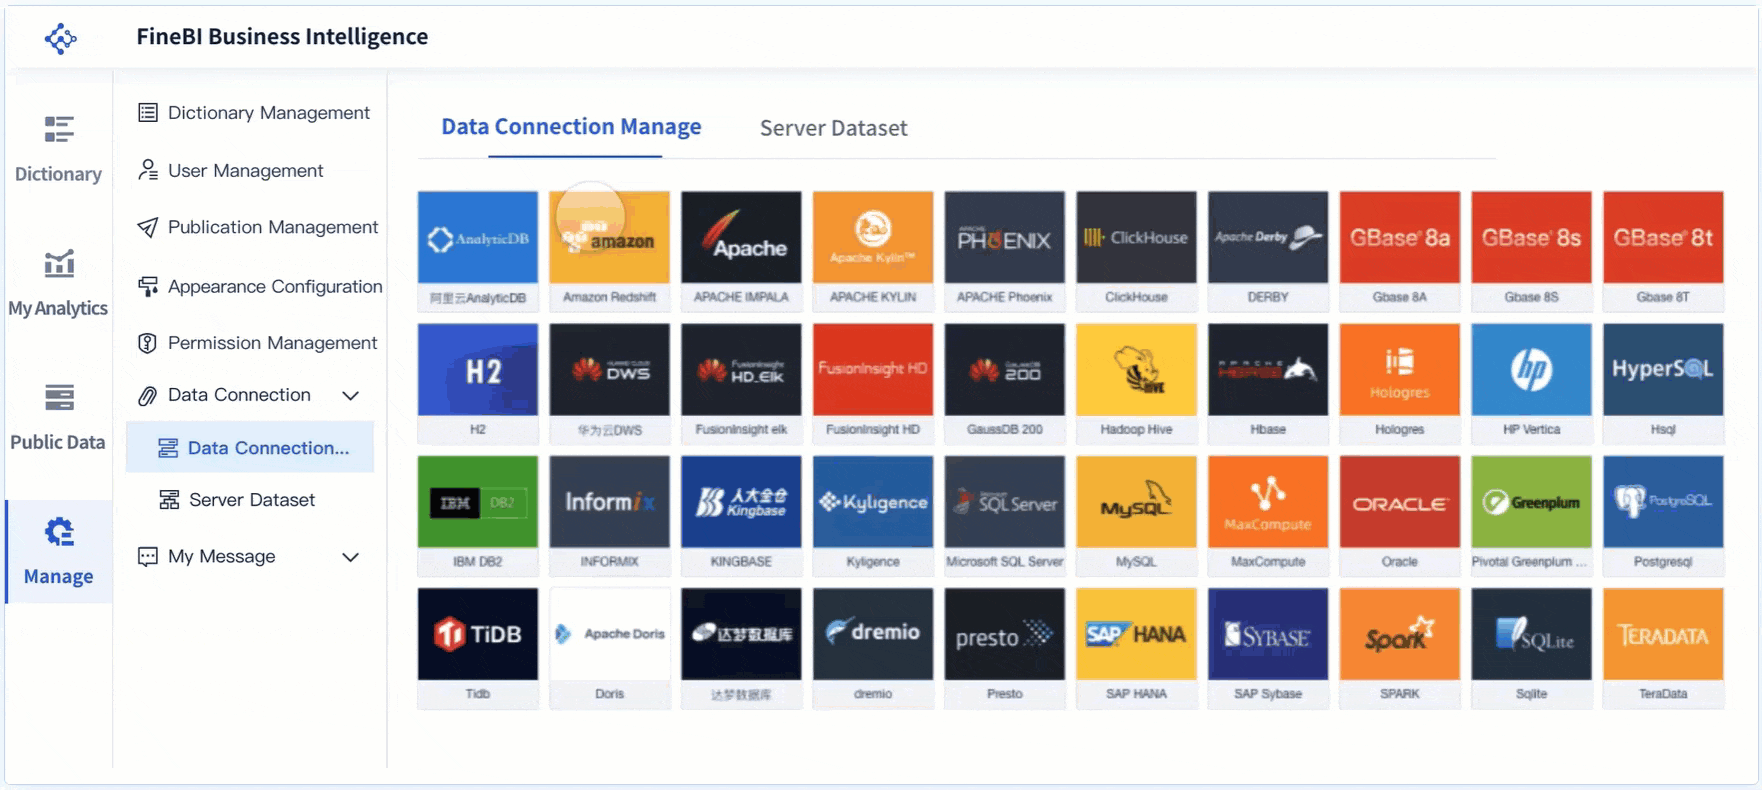
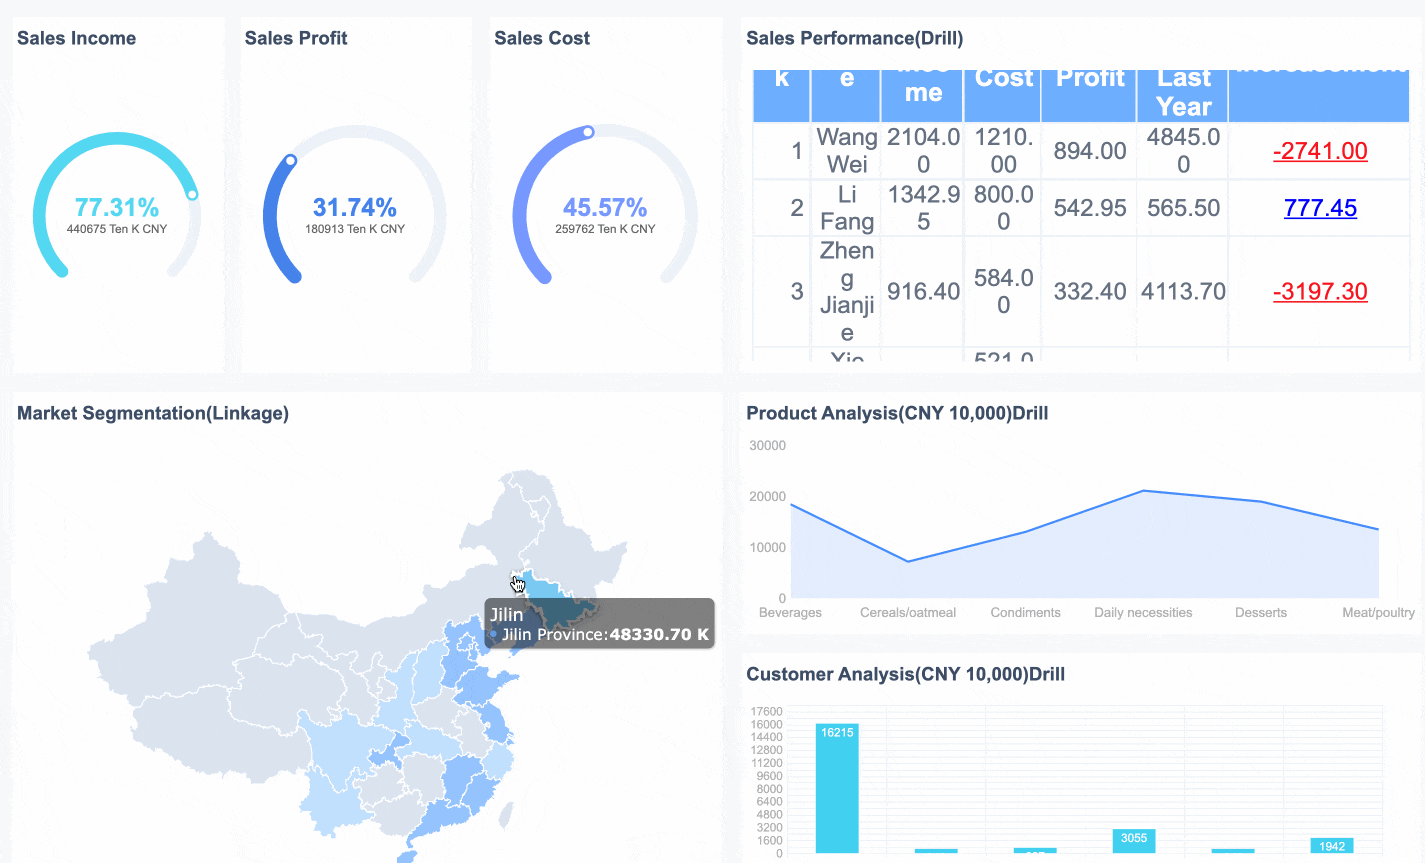
FineBI gives you a zero-code interface, making analytics accessible to everyone. You can connect to over 60 data sources, including big data and cloud platforms. FineBIsupports real-time data analysis and offers enterprise-level governance.
Tableau stands out for its advanced visualization features and interactive dashboards. You can discover insights quickly and share them across your organization.
Power BI integrates deeply with Microsoft solutions. You benefit from real-time dashboards and cost-effective pricing. Power BI supports compliance with standards like HIPAA and GDPR.
Qlik Sense uses an associative analytics engine. You can explore data freely and uncover hidden relationships. Qlik Sense supports automated insights and strong data discovery.
Looker provides modern analytics with embedded solutions. You can model data, create governed access, and deliver real-time insights to users.
You will find that leading business intelligence platforms help you streamline data analysis, support compliance, and enable real-time decision-making. These platforms empower you to turn raw data into actionable insights and drive your business forward.
You gain several advantages when you chooseFineBI as your business intelligence platform. FineBI stands out among business intelligence platforms for its ability to simplify data analysis and empower business users. You can model data efficiently and visualize information with user-friendly dashboards. FineBI offers powerful functions for analytics and supports robust collaboration across teams. You benefit from self-service dataset creation, which allows you to explore data independently. The dashboard function provides unified reporting, making it easier to track key metrics. FineBI supports multiple collaboration and sharing modes, so you can work with colleagues and share insights securely.
Strengths of FineBI
Data modeling capabilities
User-friendly data visualization
Powerful functions for data analysis
Robust data collaboration features
Simplified data analysis for business users
Self-service dataset functionalities
Dashboard function for unified reporting
Multiple data collaboration and sharing modes
FineBI enables you to start small and scale your analytics as your organization grows. The in-memory computing engine handles large data volumes and responds quickly to complex queries. FineBI is suitable for small and medium-sized businesses, but it also supports enterprise-level analytics needs.
FineBI allows you to scale your analytics as your business expands.
The platform manages large data volumes with high-speed processing.
You can rely on FineBI for both SMB and enterprise analytics requirements.
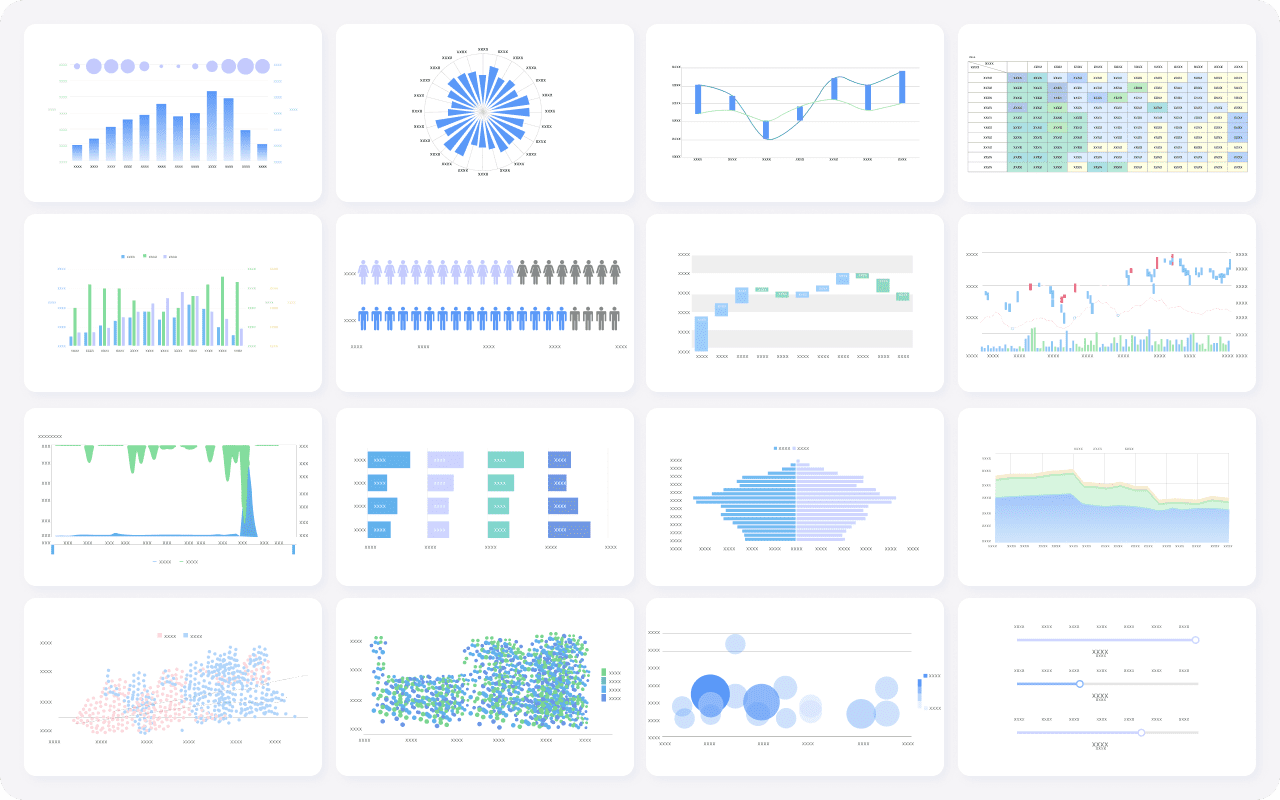
FineBIoffers a rich set of features that help you unlock the full value of your data. You can connect to over 100 data sources, including databases, cloud platforms, and APIs. FineBI’s workflow guides you through data integration, processing, visual exploration, and publishing. You can build datasets with joins, formulas, and hierarchies, then create interactive dashboards using drag-and-drop tools. FineBI supports real-time data updates, so you always have the latest insights for decision-making.
Key Features
Description
Connects to over 100 data sources
Ensures seamless integration of diverse data.
AI-driven predictive analytics
Facilitates trend forecasting for informed decision-making.
Customizable dashboards with interactive visualizations
Enhances user engagement and data interpretation.
Real-time data updates
Provides instant insights for timely actions.
Self-service analytics for non-technical users
Empowers users without technical expertise to analyze data.
Scalable for large datasets and complex KPIs
Supports enterprise-level analytics needs.
You can use FineBI’s self-service analytics to explore data without technical skills. The platform’s AI-driven predictive analytics help you forecast trends and make informed decisions. Customizable dashboards let you visualize data in ways that suit your business needs. FineBI’s governance features ensure secure sharing and role-based access control, so you can manage permissions and protect sensitive information.
Tip: FineBI’s real-time data updates keep your dashboards current, enabling you to respond quickly to changing business conditions.
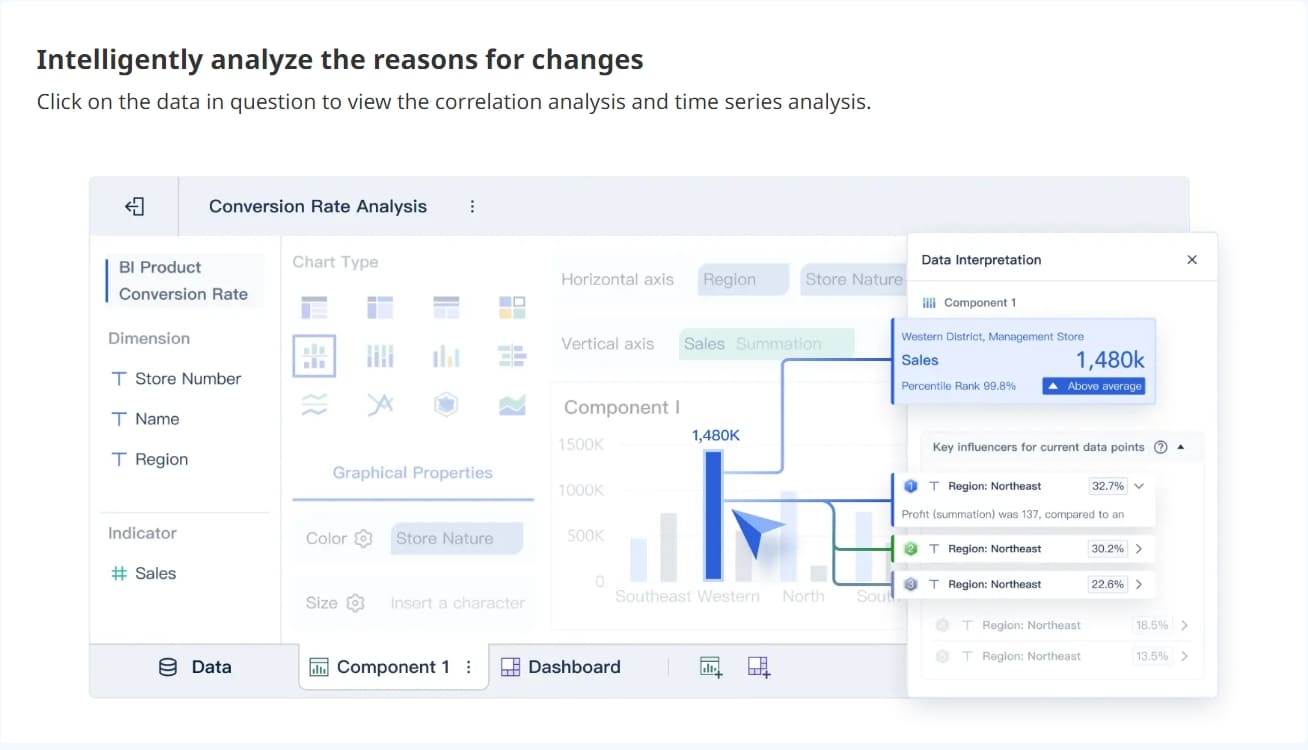
FineBI supports collaborative analytics, allowing teams to share datasets and work together on reports. You can set up alerts for critical metrics and receive notifications when anomalies occur. The platform’s data interpretation tools help you identify key factors behind trends and outliers, making your analytics more actionable.
FineBIserves a wide range of industries and business scenarios. You can use the platform to improve sales performance, analyze financial data, monitor HR metrics, and optimize supply chain operations. FineBI adapts to your needs, whether you are a business analyst, sales manager, finance professional, or executive.
A leading example comes from UnionPay Data Services Co., Ltd. The company faced challenges with fragmented data and inefficient reporting. By implementing FineBI, UnionPay unified its data visualization and analytics. The platform improved system operation efficiency by 5 percent and increased customer value identification accuracy to 90 percent. UnionPay used FineBI to analyze credit card revenue data, identify key areas for improvement, and boost customer engagement. The platform enabled precise marketing and customer segmentation, driving revenue growth and supporting digital transformation.
You can apply FineBI to:
Centralize data from multiple sources for unified analytics.
Empower business users to perform self-service data analysis.
Create interactive dashboards for real-time monitoring.
Collaborate across departments with secure data sharing.
Use AI-driven insights to forecast trends and optimize strategies.
FineBIhelps you build a data-driven culture, streamline analytics workflows, and make faster, more informed decisions. The platform’s scalability, robust features, and real-time capabilities position it as atop choice among business intelligence platforms.
You will find Tableau stands out among business intelligence platforms for its exceptional visualization capabilities. Many users praise the platform for its ease of use and robust feature set. The drag-and-drop interface allows you to create complex visualizations without extensive training. Tableau supports both individual users and large organizations, making it a flexible business intelligence platform for a wide range of needs.
Strength
Description
Visualization
Tableau delivers strong visualizations, helping you turn data into clear, actionable insights.
Ease of Use
The drag-and-drop functionality makes data analysis accessible for all skill levels.
Feature Set
The platform offers enterprise features like governance and data management.
You can rely on Tableau to handle large volumes of data and deliver fast, interactive analytics. The platform supports collaboration, allowing teams to share dashboards and reports securely. Tableau also integrates with many data sources, making it a top choice among business intelligence platforms.
Features
Tableau offers a comprehensive setof features that support advanced analytics and data discovery. You can build interactive dashboards that combine multiple visualizations for a complete view of your data. The platform provides customization options, letting you adjust colors, fonts, and layouts to match your brand. Tableau supports data animations, filters, and tooltips, which enhance user interaction and engagement.
Feature
Tableau's Capability
Comparison to Other Platforms
Interactive Dashboards
Combine multiple visualizations for comprehensive insights.
More engaging user experience.
Customization
Modify colors, fonts, and layouts for branding and presentation.
Greater flexibility.
Data Animations
Add interactive elements like filters and tooltips.
Enhanced user interaction.
AI Integration
Use Ask Data and Explain Data for automated insights and natural language queries.
Streamlined analytics process.
Advanced Analytics
Integrate R or Python models for deeper data exploration.
Sophisticated statistical analysis.
Version Control
Maintain audit trails for data integrity.
Essential for accountability.
Custom SQL Support
Write custom queries for complex data manipulation.
Meets advanced analytical needs.
You can use Tableau to connect to a wide variety of data sources, including cloud services and on-premises databases. The platform supports real-time data updates, ensuring your analytics always reflect the latest information. Tableau’s governance featureshelp you manage permissions and maintain data security across your organization.
Note: Tableau’s AI-driven features, such as Ask Data, let you query data in natural language, making analytics even more accessible.
Use Cases
Tableau serves many industries and business scenarios. You can use the platform to unlock deeper customer insights by integrating data from different business areas. The platform helps you boost product quality by analyzing machine and product data for performance and anomaly detection. Tableau accelerates supply chain operations by providing end-to-end visibility and predictive analytics.
Use Case
Description
Unlock Deeper Customer Insights
Integrate data for a unified view of customer behavior and preferences.
Boost Product Quality
Analyze product and machine data for performance and improvements.
Accelerate Supply Chain
Track KPIs and predict outcomes with comprehensive supply chain analytics.
Enhance Cybersecurity
Analyze security data for threat detection and incident response.
You can also use Tableau to consolidate KPIs across divisions, automate compliance reporting, and provide near real-time dashboards for leadership. The platform empowers business users to answer data questions independently, reducing the need for additional data professionals. Tableau stands out among business intelligence tools and data analytics software for its ability to scale analytics and deliver actionable insights across your organization.
Microsoft Power BI Review as Data Intelligence Companies
Strengths
You will find Microsoft Power BI stands out amongbusiness intelligence platformsfor its deep integration with the Microsoft ecosystem. Many organizations choose this platform because it connects seamlessly with Microsoft 365, Azure, and other Microsoft solutions. This integration streamlines your workflows and enhances collaboration across teams. Power BI offers a low entry cost, making it accessible for organizations of all sizes. You can leverage broad visualization capabilities to present data in ways that drive understanding and action. The platform includes advanced AI features, such as Copilot, which help you work efficiently with SQL-based data and uncover new insights.
Strengths
Description
Integration with Microsoft Ecosystem
Power BI is favored by businesses that are deeply embedded in the Microsoft ecosystem.
Affordability
It has a low entry cost, making it accessible for large organizations.
Visualization Capabilities
Offers broad visualization capabilities that enhance data presentation.
AI Features
Includes advanced AI features like Copilot, beneficial for teams working with SQL-based data.
You can use Power BI to integrate, visualize, and analyze data from a wide range of sources. This versatility makes it a preferred business intelligence platform for large organizations that need flexible analytics solutions.
Features
Power BI provides a complete suite of features for data integration, analytics, and reporting. You can connect to on-premises and cloud data sources, including Azure SQL Database and SharePoint Online. The platform supports real-time analytics, allowing you to monitor key metrics as they change. Power BI’s advanced analytics capabilities let you embed predictive models and automate workflows, which enhances your ability to generate actionable insights.
Feature
Description
Azure SQL Database Integration
Enables real-time data analytics and reporting, leveraging Azure’s scalability and security.
Azure Machine Learning Integration
Embeds predictive models into Power BI reports for forward-looking insights and decision-making.
SharePoint Online Integration
Allows embedding of Power BI reports into SharePoint for effective dissemination of insights.
Microsoft Teams Integration
Facilitates access to Power BI reports within Teams, promoting data-driven discussions.
Excel Integration
Enhances Excel’s capabilities by allowing users to publish datasets to Power BI or import reports.
Power Automate Integration
Automates workflows, ensuring BI reports are up-to-date and relevant.
Power Apps Integration
Enables creation of interactive reports that can initiate actions or update data in real-time.
You benefit from scalability and flexibility through Azure’s cloud infrastructure. Power BI enhances security and compliance, which is critical for organizations handling sensitive data. The platform’s features support seamless data integration, advanced analytics, and effective collaboration, making it one of the most versatile business intelligence platforms available.
Use Cases
Power BI supports a wide range of use cases across industries. In financial services, you can use what-if parameters to create interactive data projections and make informed decisions. The platform automates financial reporting by consolidating data from multiple systems into a single dashboard. This reduces manual data entry time and increases efficiency. Real-time expense management features help you track spending across departments, improving budget utilization. Power BI’s forecasting capabilities enhance accuracy in financial planning and resource allocation.
Use what-if parameters for interactive data projections and scenario analysis.
Automate financial reporting and consolidate key statements in one dashboard.
Reduce manual data entry and access financial insights faster.
Track expenses in real-time to improve budget management.
Enhance forecasting accuracy for better resource planning.
Manage large volumes of financial data without reporting limitations.
You can apply Power BI to many business intelligence platforms scenarios, including sales analytics, operations monitoring, and customer data discovery. The platform empowers you to turn complex data into clear, actionable insights, supporting your organization’s data-driven goals.
Qlik Sense Review as Data Intelligence Companies
Strengths
You will find Qlik Sense stands out amongbusiness intelligence platforms for its unique approach to data analysis. Many platforms focus on traditional query-based exploration, but Qlik Sense uses an associative data model. This model lets you explore data relationships intuitively, making it easier to discover insights. You can create dashboards without coding, thanks to a user-friendly interface. The platform offers strong visualization capabilities, allowing you to customize visual narratives and integrate advanced analytics seamlessly. You receive immediate feedback on your selections, which enhances your understanding of business metrics. Qlik Sense democratizes analytics, empowering teams across your organization to engage in analytical thinking.
Strengths
Description
Associative Data Model
Enables intuitive exploration of data relationships, allowing you to discover insights easily.
User-Friendly Interface
Accessible for non-technical users, facilitating dashboard creation without coding.
Strong Visualization Capabilities
Offers extensive customization for visual narratives, integrating advanced analytics seamlessly.
Real-Time Data Exploration
Provides immediate feedback on data selections, enhancing understanding of business metrics.
Democratization of Analytics
Empowers teams across the organization to engage in analytical thinking, not just specialized departments.
Features
Qlik Sense offers a wide range of features that support your data-driven goals. The associative data model gives you freedom to explore data without the constraints of predefined queries. You can uncover hidden relationships and gain deeper insights across various datasets. The platform supports real-time data exploration, so you always work with the latest information. You can customize dashboards with advanced analytics features, including predictive modeling and interactive visualizations. The platform integrates with multiple data sources, making it easy to centralize your data for unified analysis. You can use drag-and-drop tools to build dashboards, which simplifies the process for business users. Qlik Sense provides robust governance features, ensuring secure sharing and role-based access control. You can collaborate with colleagues, share insights, and set up alerts for critical metrics. The platform supports mobile access, so you can view dashboards and analytics anywhere.
Tip: The associative data model in Qlik Sense lets you explore data freely, helping you identify trends and correlations that might not be immediately visible.
Use Cases
You can apply Qlik Sense to many business intelligence platforms scenarios. In healthcare, the platform supports care pathway applications, improving care and reducing wait times. Real-time dashboards help paramedic services enhance situational awareness and patient distribution. Hospitals use Qlik Sense to track MEWS usage, decreasing cardiac arrest and mortality rates. The platform increases ACT score capture and informs staffing decisions, improving project opportunities and patient discharge processes. You can reduce unnecessary alerts in electronic health records, leading to better understanding of alert triggers.
Use Case Description
Outcome
Care Pathway applications for three conditions
Improved care, reduced wait times, reduced unwarranted clinical variation
Real-time dashboards for Ottawa Paramedic Service
Enhanced situational awareness, improved patient distribution, and response time performance
MEWS usage
Decreased hospital cardiac arrest, mortality, and unplanned ICU transfers
ACT scores tracking
Increased capture of ACT scores from 50% to 75%
Staffing decisions informed by Qlik dashboard
Improved departmental project opportunities and patient discharge processes
Reduction of unnecessary alerts in EHR
Significant decrease in BPA alerts and improved understanding of alert triggers
You can use Qlik Sense to support data analysis, drive discovery, and deliver solutions that improve outcomes. The platform adapts to your needs, whether you work in healthcare, finance, or operations. You gain actionable insights and foster a data-driven culture across your organization.
Looker Data Review as Data Intelligence Companies
Strengths
You will notice that Looker stands out among business intelligence platforms for several reasons. Many platforms offer data integration, but Looker provides strict data governance. This ensures your organization maintains control over sensitive information. You can connect Looker to a wide range of SQL databases, which increases its versatility. Looker supports multiple data sources, so you can perform comprehensivedata analysis across your entire business. These strengths make Looker a reliable platform for organizations that need robust analytics and secure data management.
Strict data governance for secure operations
Robust integration with various SQL databases
Support for multiple data sources for comprehensive analysis
Features
Looker offers features that help you meet complex analytics needs. You can use version-controlled data modeling, which tracks changes and manages updates efficiently. This feature supports collaboration and ensures consistency in your analytics projects. Looker’s embedded analytics capabilities let you share insights directly within your business applications. You can choose from a wide range of visualization options to present your data clearly.
The Looker Modelling Language, called LookML, allows you to define semantic models. This helps maintain reliable data analysis across your organization. You can use Git integration for full version control, which enhances teamwork and transparency. Looker’s SQL Generator converts LookML queries into SQL, so you can define complex data relationships and run advanced analytics directly on your source databases. These features make Looker a powerful business intelligence platform for data-driven organizations.
You will find that Looker supports real-time analytics, which means you always work with the latest data. The platform’s features help you discover trends, automate reporting, and deliver actionable insights to your teams. You can rely on Looker to streamline your analytics workflow and support data discovery at every level.
Use Cases
Looker serves many industries, but you will see strong adoption in retail and e-commerce. The platform helps you create personalized marketing campaigns by analyzing customer purchasing patterns. You can use Looker to optimize inventory management with real-time insights, which improves customer satisfaction and reduces costs.
Use Case
Description
Personalized Marketing Campaigns
An e-commerce retailer analyzed customer purchasing patterns to create targeted marketing campaigns, enhancing conversion rates and loyalty.
Inventory Management
A brick-and-mortar retailer used Looker for real-time inventory insights, optimizing stock levels and improving customer satisfaction.
You can apply Looker to many business intelligence platforms scenarios, including sales analytics, financial reporting, and operational monitoring. The platform’s features support data-driven decision-making and help you uncover valuable insights for your organization.
Choosing the Right Data Intelligence Companies
Evaluation Factors
Selecting the rightbusiness intelligence platformsrequires you to look at several important factors. You want to make sure the platforms you choose align with your business goals and support your long-term strategy. Each organization has unique needs, so you should compare platforms based on how well they fit your requirements.
The table below outlines key evaluation factors to consider when you assess business intelligence platforms:
Evaluation Factor
Description
Alignment with Business Goals
Make sure the platform supports your strategic objectives and helps you achieve measurable outcomes.
Technical Considerations
Look for strong data integration, scalability, and customization to match your business needs.
Usability and User Adoption
Choose platforms with user-friendly interfaces and training resources to encourage adoption.
Performance Metrics
Evaluate speed, reliability, and service agreements to ensure effective decision-making.
Cost-Benefit Analysis
Review all costs over time to determine the return on investment for each platform.
Vendor Reputation and Support
Research the vendor’s technology, client base, and support to ensure long-term success.
You should also consider how platforms handle integration, scalability, and governance. Many organizations need platforms that can scale as the business grows and maintain compliance with regulations. Flexible governance mechanisms help you manage access and security across different systems. Enterprise platforms often adapt to support more users and systems as your needs evolve. Consistent governance across integration platforms increases flexibility and scalability.
Tip: Always match the platform’s strengths to your business’s current and future needs. This approach helps you avoid costly changes later.
Access a wealth of case studies, industry insights, and solution guides to accelerate digital transformation.
FAQ
What are business intelligence platforms?
Business intelligence platforms help you collect, analyze, and visualize data. You use these tools to make informed decisions, track performance, and discover trends. They support integration with multiple data sources and offer features for reporting and analytics.
How do business intelligence platforms support self-service analytics?
You can use business intelligence platforms to explore data without technical skills. These platforms provide drag-and-drop dashboards and intuitive interfaces. You create reports, analyze trends, and share insights independently, which increases efficiency and reduces reliance on IT teams.
Which industries benefit most from business intelligence platforms?
You see business intelligence platforms used in finance, healthcare, retail, manufacturing, and technology. These industries rely on data-driven decisions to improve operations, enhance customer experiences, and gain competitive advantages.
What features should you look for in business intelligence platforms?
Look for data integration, real-time analytics, customizable dashboards, AI-driven insights, and robust governance. These features help you centralize data, analyze trends, and protect sensitive information.
Can business intelligence platforms handle large datasets?
Yes, business intelligence platforms use high-performance engines to process large datasets. You can analyze complex data, track key metrics, and support many users at once. This scalability makes them suitable for both small businesses and large enterprises.