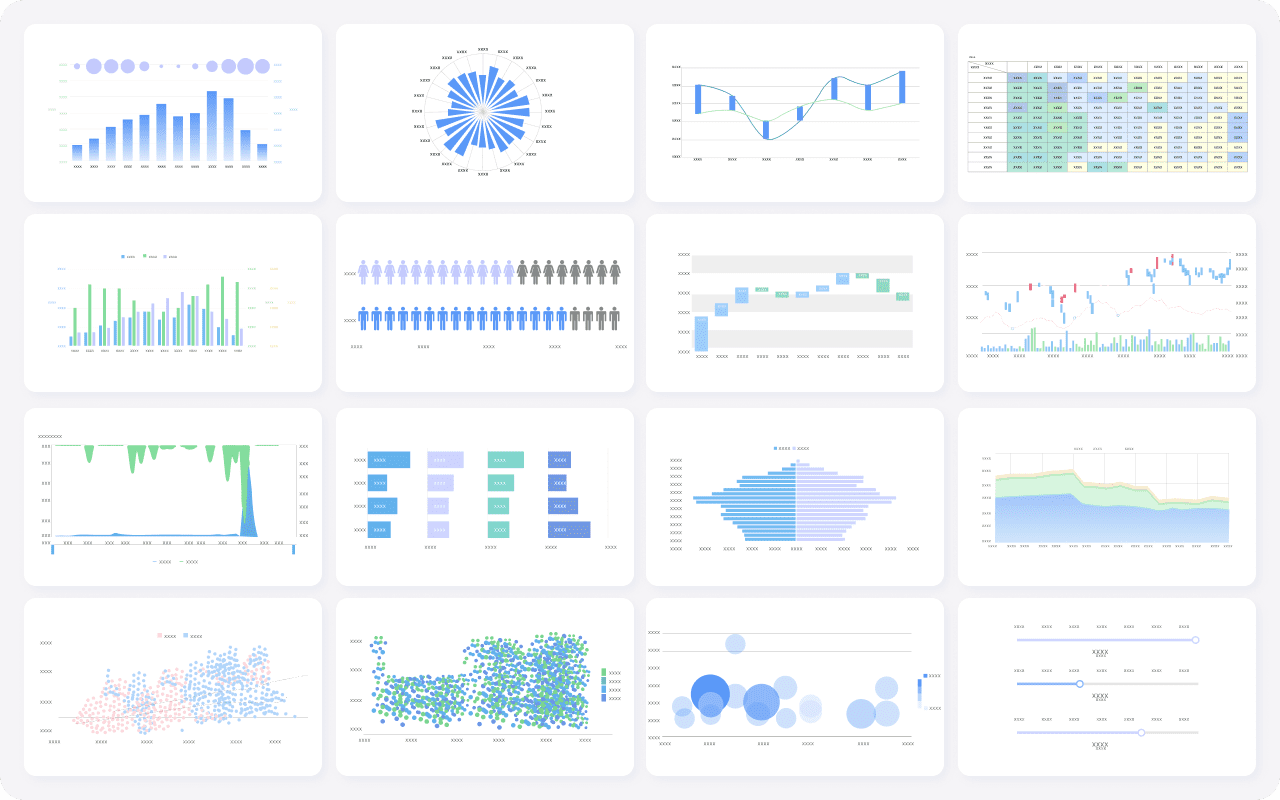
Free data analysis tools help you explore, visualize, and understand your data without paying for a license. These solutions give you access to essential analytics features at no cost. You can use free data analysis tools to connect multiple data sources, create dashboards, and uncover trends.
Some of the top free tools include FineBI, Microsoft Power BI Free, Google Data Studio, KNIME Analytics Platform, Tableau Public, Apache Superset, and Orange Data Mining. You gain easy-to-use interfaces, strong integration options, and innovative features that support your workflow.
Top Free Data Analysis Tools

Choosing the right free data analysis tools can transform how you work with data. You gain access to powerful features without spending money. These tools help you connect to different data sources, build dashboards, and share insights with your team. Below, you will find the best data analysis tools. Each tool offers unique strengths for data analytics, visualization, and collaboration.
FineBI Overview and Key Features

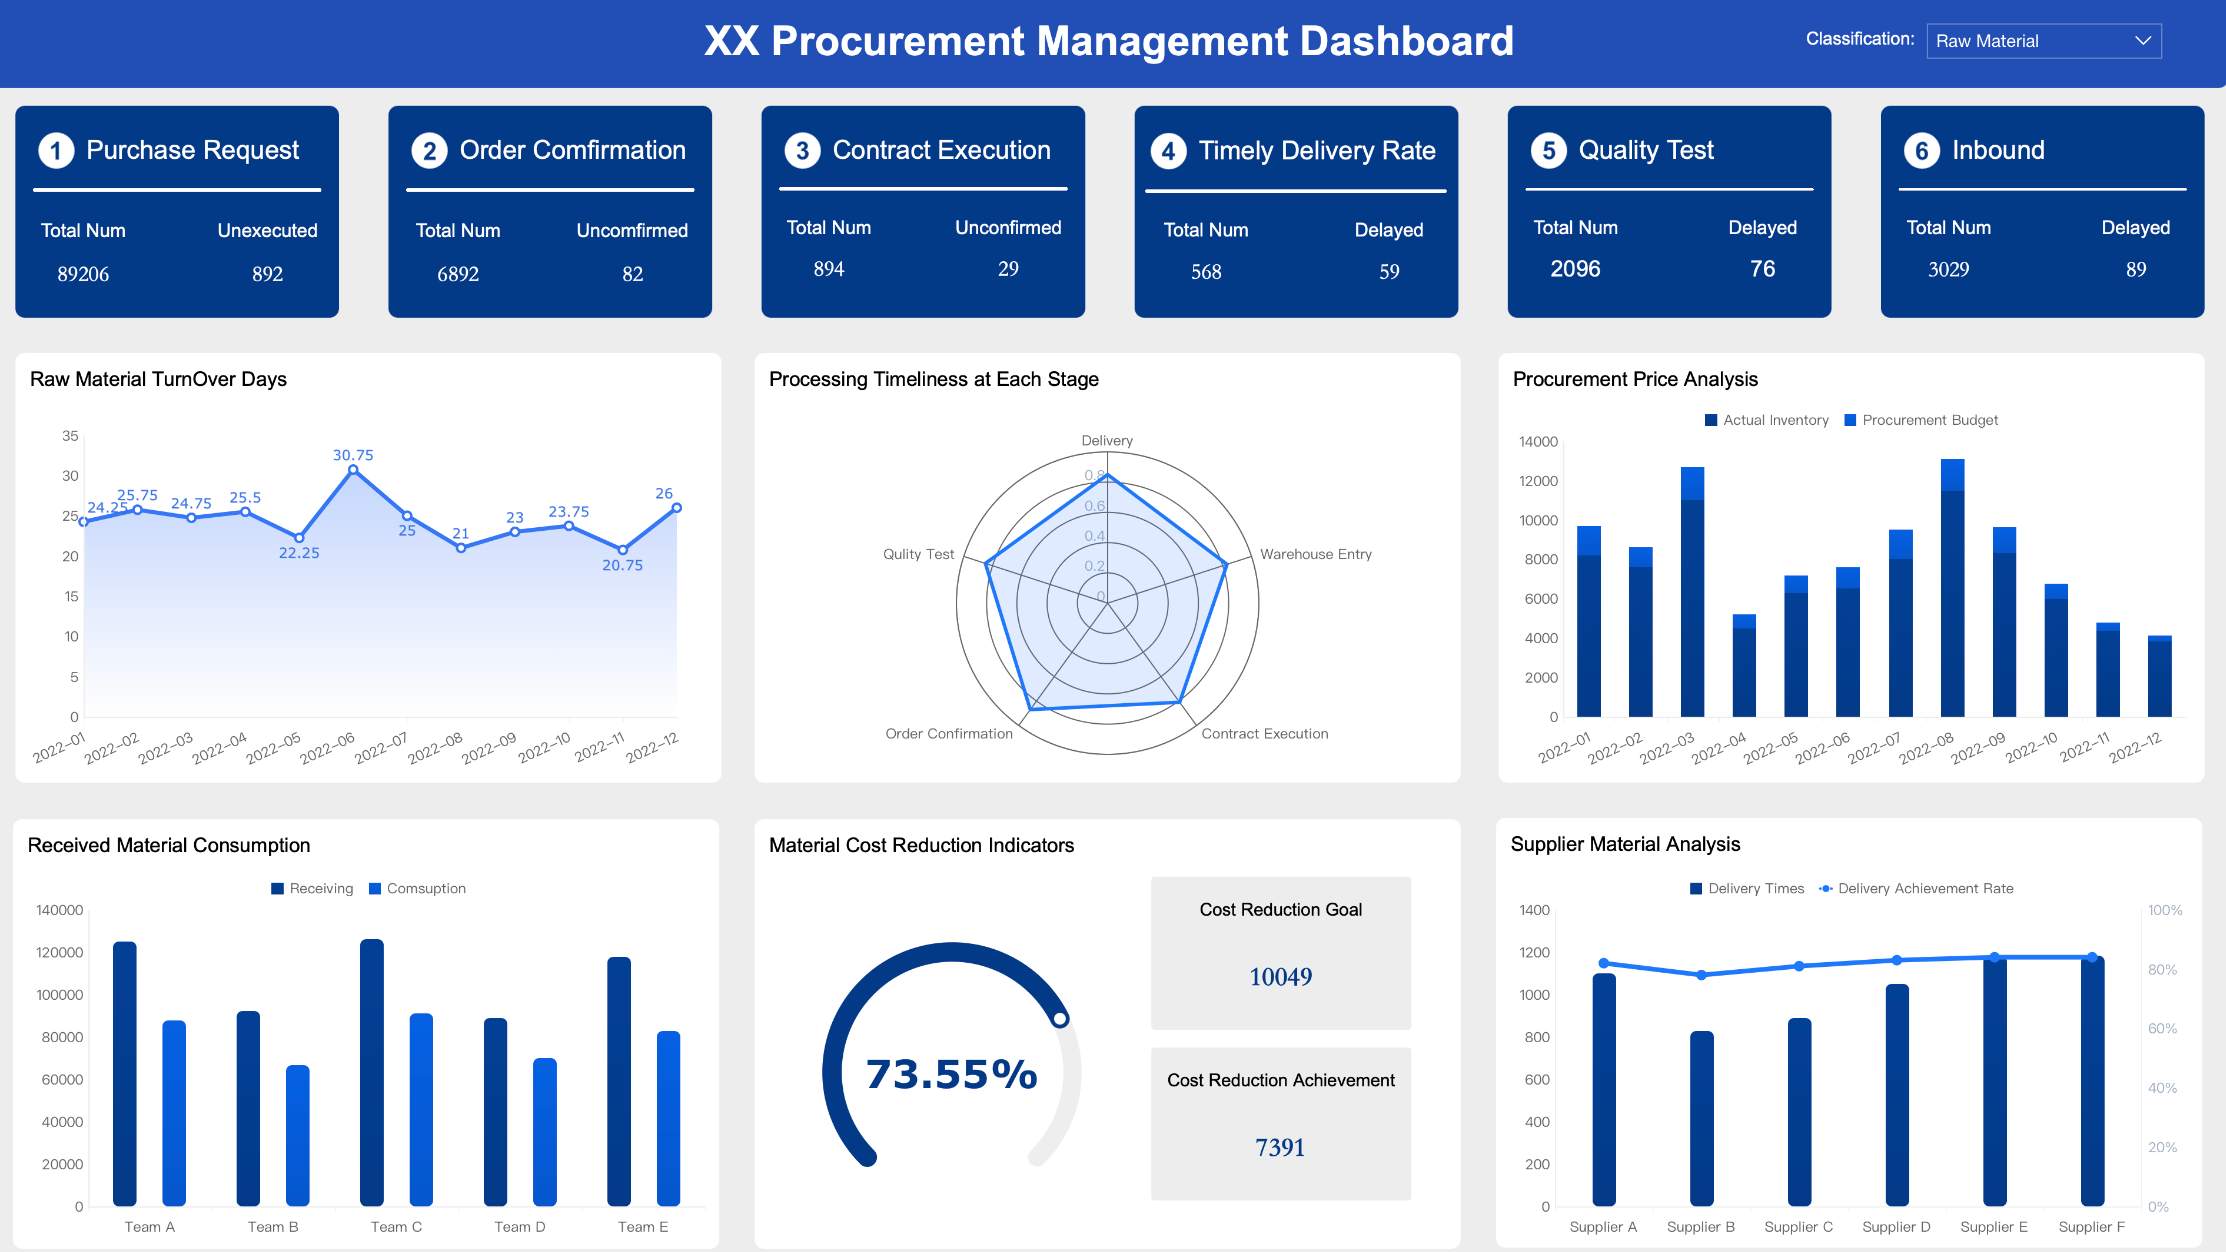
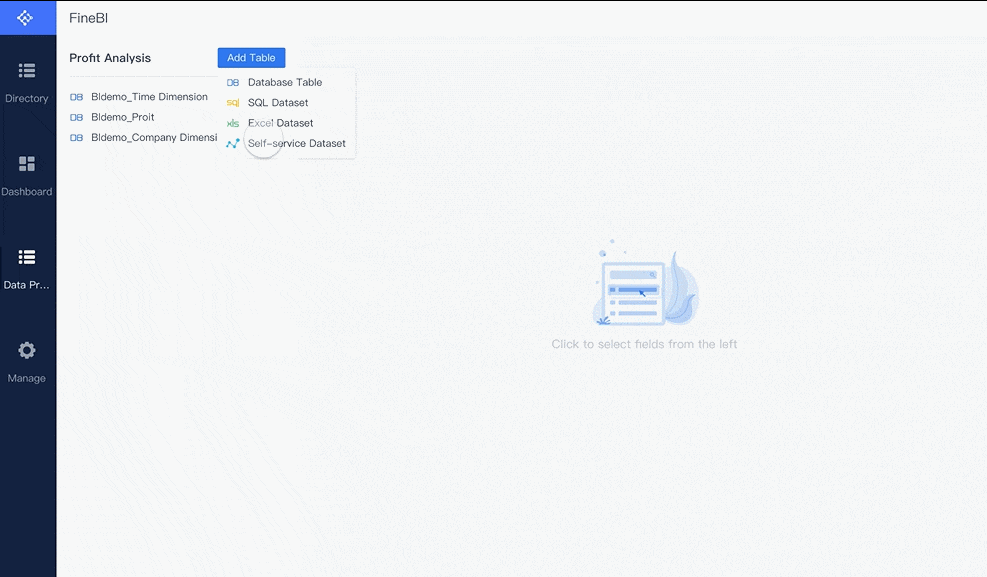
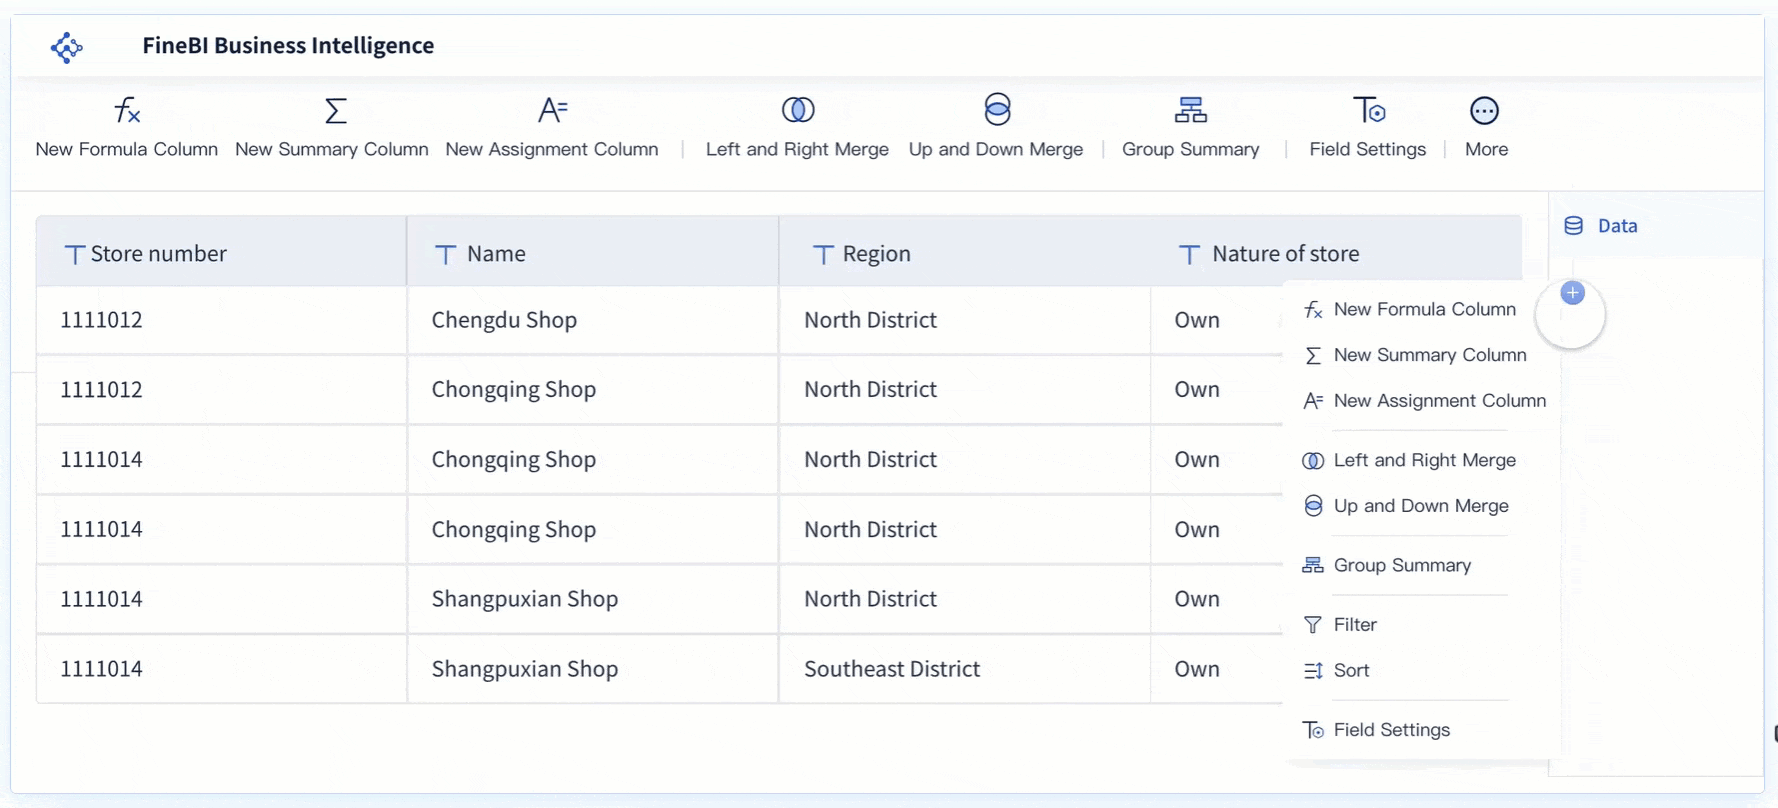
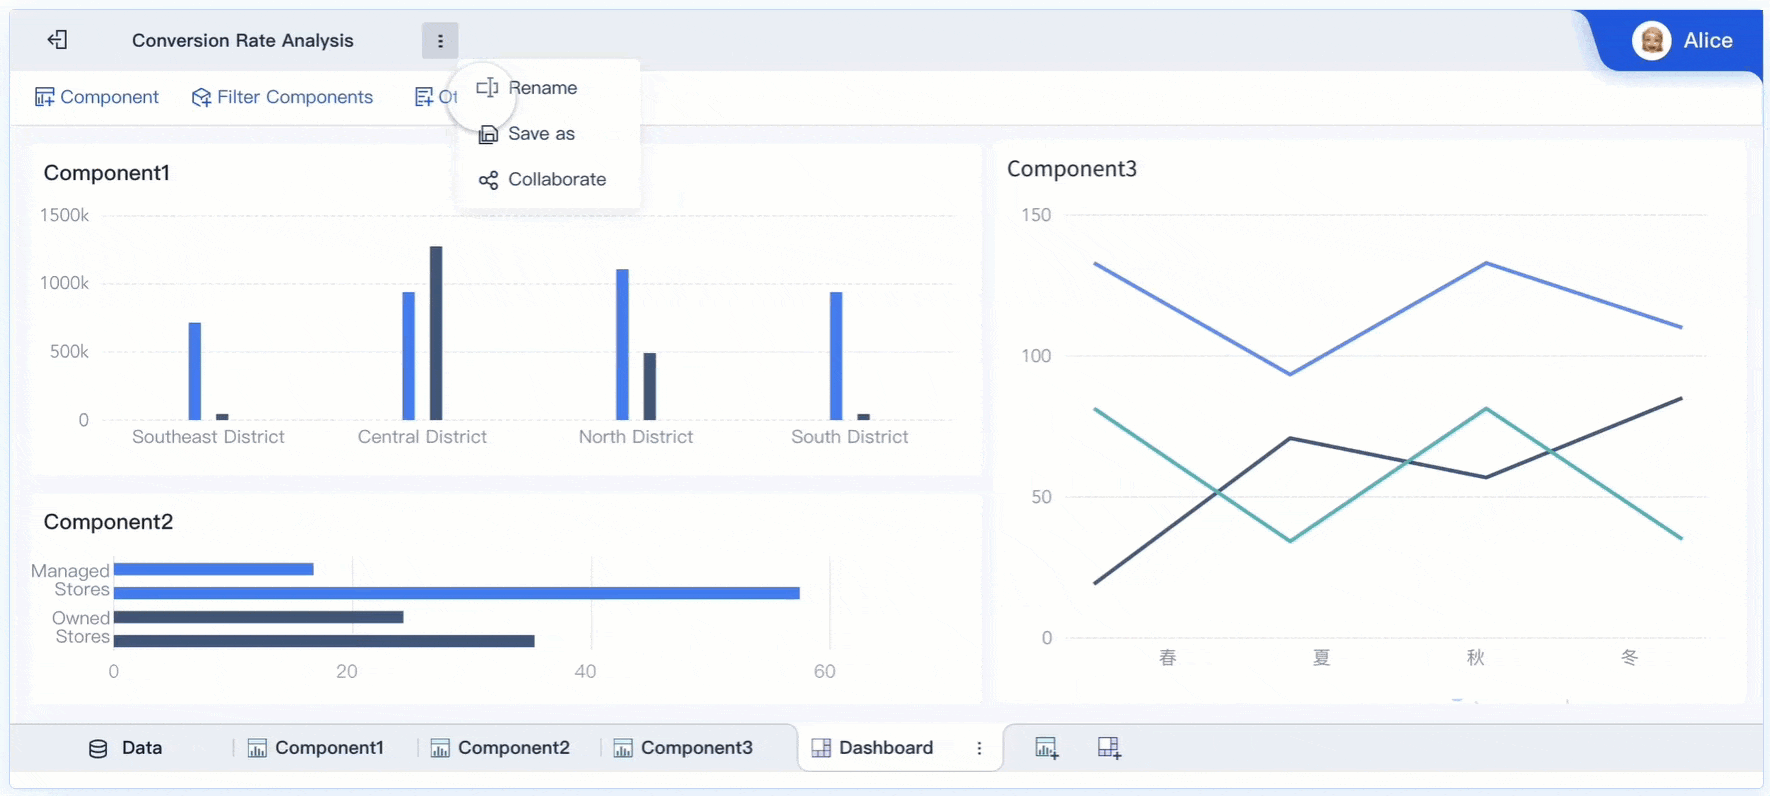
FineBI stands out among free data analysis tools. You can use FineBI to perform self-service analytics and create dashboards with ease. The platform supports strong data integration, connecting to over 30 big data platforms and SQL sources. You organize your data using folder-based classification, making it simple to manage business subjects.

FineBI gives you flexible data modeling. You can use composite keys and manual linkage for complex analysis. The self-service dataset feature lets you combine data for joint analysis without extra setup. You edit data visually and choose from recommended chart effects. Rich calculation functions, including advanced aggregation and DEF functions, support complex calculations.
Multi-dimensional analysis is automatic. FineBI recognizes dimensions and indicators, so you explore data from many angles. You build customizable dashboards with adaptive layouts and interactive filters. Data collaboration is easy, allowing you to share and review data with your team. The high-performance ELT/ETL engine keeps your data clean and ready for analysis.
Tip: FineBI is ideal for business users who want independence from IT. You can analyze data, create dashboards, and collaborate—all in one platform. Also, it is free for personal use.
| Feature/Advantage | Description |
|---|---|
| Self-service analytics | Analyze data independently without IT support. |
| Folder-based classification | Organize data by business subject for easier access. |
| Flexible data modeling | Use composite keys and manual linkage for complex analysis. |
| Self-service datasets | Combine data for joint analysis without extra setup. |
| Visual data editing | Edit data and choose recommended chart effects easily. |
| Rich calculation functions | Advanced aggregation and DEF functions for complex calculations. |
| Multi-dimensional analysis | Automatic recognition of dimensions and indicators. |
| Customizable dashboards | Create dashboards with adaptive layouts and interactive filters. |
| Data collaboration | Share and review data within teams. |
| Strong data integration | Connect to over 30 big data platforms and SQL sources. |
| Low-code data development | Cleanse and transform data with minimal coding. |
| High-performance ELT/ETL engine | Efficient data processing for clean, analysis-ready data. |
Microsoft Power BI Free
Microsoft Power BI Free is one of the most popular free data analysis tools. You can access over 70 data sources and create basic reports and dashboards. The platform is user-friendly and supports data analytics for individuals.
Power BI Free lets you publish reports to the web and export data to Excel. You can perform basic reporting and dashboard creation. However, sharing reports with others requires an upgrade to Power BI Pro or Premium. Advanced tools and handling large data volumes are only available in paid versions.
| Feature/Limitations | Power BI Free |
|---|---|
| Peer-to-peer sharing | Not available |
| App workspace creation | Not available |
| API embedding | Not available |
| Access to data sources | 70+ data sources available |
| Publish to web | Available |
| Export to Excel | Available |
| Basic reporting and dashboard | Available |
You should use Power BI Free if you want to explore the platform and perform individual analysis. The tool is best for personal projects and small-scale data analytics.
Google Data Studio
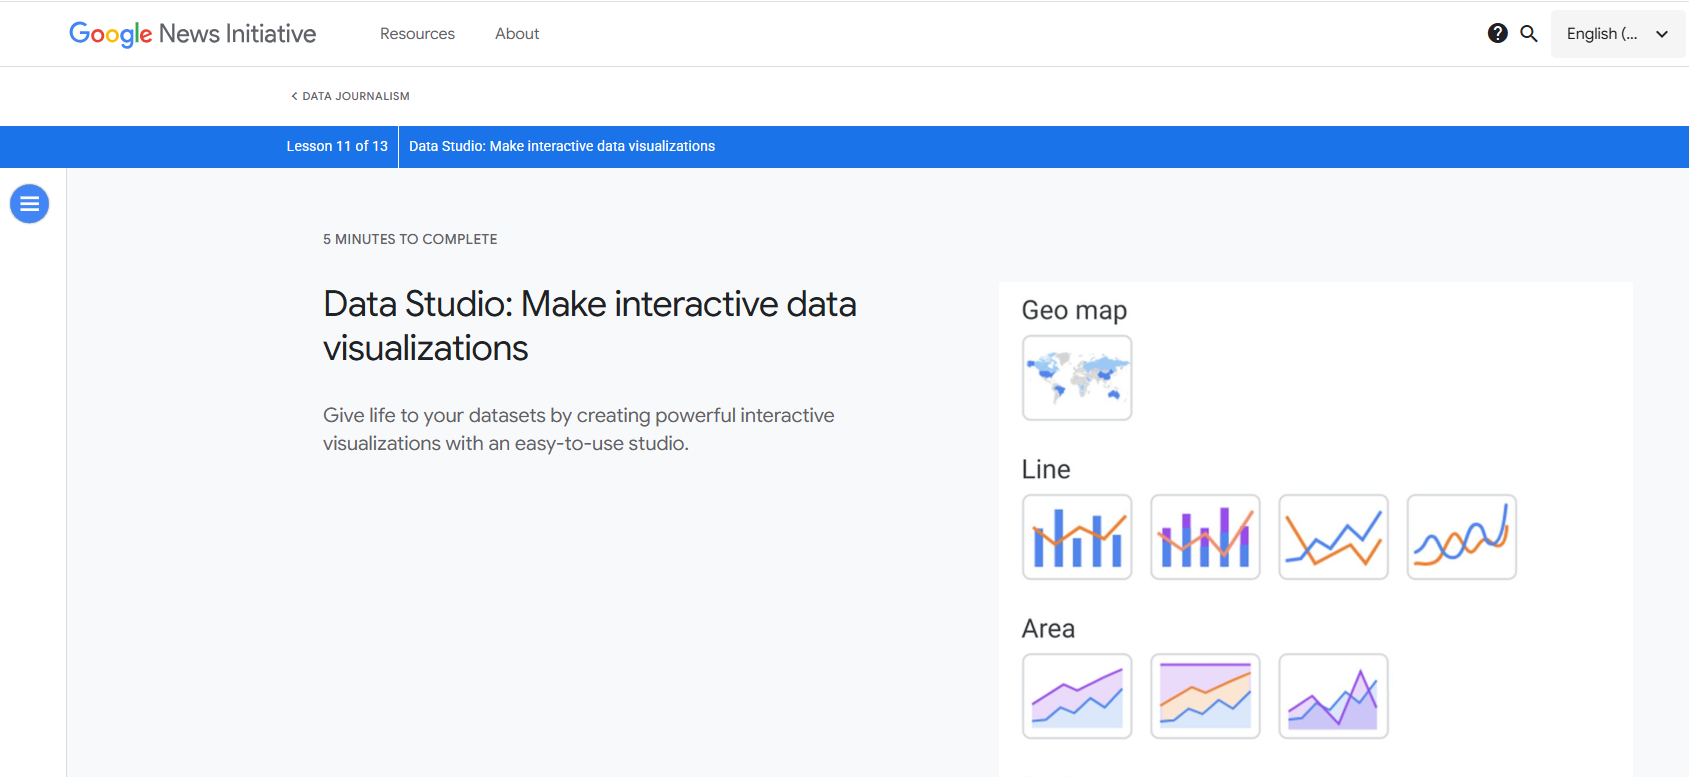
Google Data Studio is a top choice among free data analysis tools. You can connect directly to Google Analytics 4, Google Ads, Google Sheets, and BigQuery. The platform supports over 400 partner connectors, including SQL and NoSQL sources.
You create interactive dashboards and reports from various data sources. Data blending lets you build charts using multiple sources. You manage access with group workspaces and share reports with your team in real time. The Looker Studio API helps automate management and migration of resources.
| Feature | Description |
|---|---|
| Unlock the full value of your data | Create interactive dashboards and reports from various sources for better business decisions. |
| Looker Studio API | Automate management and migration of Looker Studio resources for streamlined processes. |
| Unrestricted connection with data sources | Access over 600 partner connectors for instant connection to various data types without coding. |
| Share reports with your team | Collaborate in real-time and share reports easily. |
| Customizable access management | Control access to reports and data sources at scale with group workspaces. |
| Group workspaces | Manage access and share content based on team collaboration needs. |
| Linking Looker to a Google Cloud project | Control resources via a linked Google Cloud project, ensuring operational continuity. |
| Cloud Customer Care | Access scalable support services for Looker Studio Pro users. |
Note: Google Data Studio is perfect for teams that need to visualize analytics data and collaborate on dashboards.
KNIME Analytics Platform
KNIME Analytics Platform is a powerful open-source data analytics tool. You access and blend data from many sources. The platform lets you aggregate, sort, filter, and join data. You use popular machine learning libraries for advanced analysis.
KNIME helps you create interactive visualizations and automate repetitive tasks with a genAI assistant. You can bundle workflows for reuse and integrate scripting in Python, R, and Javascript. The large community and repository of solutions support your learning and growth.
| Feature | Description |
|---|---|
| Access & Blend | Access data from various sources and blend different data types easily. |
| Transform & Analyze | Aggregate, sort, filter, and join data, with access to popular ML libraries. |
| Visualize & Explore | Create interactive visualizations and automate repetitive tasks with a genAI assistant. |
| Save & Re-Use | Bundle workflows for reuse and integrate scripting in Python, R, and Javascript. |
| Community & Learning | Join a large community, access a repository of solutions, and take courses to enhance skills. |
KNIME is ideal for users who want to perform advanced analytics and machine learning without paying for data analysis software.
Tableau Public
Tableau Public is a leading free data analysis tool for visualization. You create stunning dashboards and share them online. The platform is known for its enhanced visualization capabilities and high performance.
Tableau Public supports collaboration and scalability. You can work with large datasets and create graphics easily. The user-friendly interface helps non-technical users build visualizations. However, the tool has a steep learning curve and limited spreadsheet functionality.
| Strengths of Tableau Public | Weaknesses of Tableau Public |
|---|---|
| Enhanced visualization capabilities | Steep learning curve |
| Scalability | High costs |
| Collaboration features | Limited spreadsheet functionality |
| High performance | Lack of data entry capabilities |
Tableau Public is best for users who want to focus on data visualization and share dashboards with a wide audience.
Apache Superset
Apache Superset is a popular open-source data analytics tool. You use Superset to create fast, interactive dashboards and visualizations. The platform is scalable and flexible, making it suitable for organizations with technical resources.
Superset works well for companies with in-house data teams and businesses handling large datasets. You avoid vendor lock-in by choosing this open-source solution. Superset supports high query loads and offers customizable features.
| Type of Organization | Benefits |
|---|---|
| Organizations with technical resources | Can manage and customize the tool effectively |
| Businesses handling large datasets | Need fast, interactive visualizations |
| Organizations avoiding vendor lock-in | Prefer open-source solutions |
Superset is ideal for organizations that need scalable, flexible data analysis tools and want to customize their analytics environment.
Orange Data Mining
Orange Data Mining is a free, open-source data analytics tool. You use visual programming to explore and analyze data without coding. The platform offers user-friendly widgets and interactive data visualization.
Orange supports machine learning, NLP, and text mining extensions. You can prototype machine learning models and perform specialized analysis, such as time series or gene expression studies. The tool is perfect for educational purposes and interactive data analysis.
| Key Features | Ideal Use Cases |
|---|---|
| Open source machine learning | Data exploration and visualization |
| Visual programming (no coding needed) | Interactive data analysis |
| User-friendly widgets | Educational purposes in data science |
| Interactive data visualization | Prototyping machine learning models |
| Extensions for NLP and text mining | Specialized data analysis (e.g., time series, gene expressions) |
Orange Data Mining is best for students, educators, and professionals who want to learn and experiment with data analytics using free data analysis tools.
Tip: You can try several open-source data analytics tools to find the best fit for your workflow. Each tool offers unique features for dashboards, machine learning, and collaboration.
Why These Free Data Analysis Tools Stand Out
Free data analysis tools stand out because they help you work with data efficiently, even if you have limited resources. You can use these tools to improve your decision-making, spot trends, and boost productivity. Many users choose these solutions because they offer strong usability, scalability, and innovative features. You can handle different types of data, from simple spreadsheets to complex big data, and create dashboards that make your findings clear.
Key Features Comparison
When you compare free data analysis tools, you notice several important criteria. The table below shows what you should look for when choosing the right tool for your needs:
| Criteria | Description |
|---|---|
| Type of Data and Complexity | You can analyze structured, unstructured, or big data, depending on your project. |
| Types of Data Analysis Required | Some tools work best for machine learning, while others excel at dashboards or reports. |
| User Expertise and Technical Skills | You may prefer tools with simple interfaces if you have less technical experience. |
| Integration with Existing Systems | You should check if the tool fits with your current software and data sources. |
| Scalability and Performance | The best tools handle large data volumes and grow with your needs. |
You also see differences in how each tool works:
- Installation: Power BI gives you a desktop version, while Google Data Studio is cloud-based and needs only a Google account.
- Data Sources: Power BI connects with Microsoft and other apps. Google Data Studio links mainly to Google products. FineBI supports a wide range of big data and SQL sources.
- Data Transformation: Power BI offers strong data cleaning. Google Data Studio assumes your data is already clean.
- Ease of Use: Google Data Studio is more intuitive for beginners. Power BI has more features but a steeper learning curve.
- Sharing: Google Data Studio lets you share dashboards easily. Power BI requires a paid upgrade for sharing.
Ideal Use Cases
You can use free data analysis tools for many purposes. The table below highlights common scenarios:
| Tool | Common Use Cases |
|---|---|
| Python | ETL processes, data visualization, machine learning, web scraping |
| Microsoft Excel | Data cleaning, data manipulation, statistical analysis, pivot tables, VBA programming |
| SQL | Data querying, data aggregation, database management, security and permissions |
| ChatGPT | Natural language-based analysis, code generation for data analysis tasks |
You benefit from these tools in several ways:
- You improve your decision-making process with real-time, accurate data.
- You identify patterns and trends in your data, which helps you plan better.
- You increase efficiency and productivity by automating repetitive tasks.
- You reduce costs and risks by using insights to avoid mistakes.
Open-source data analytics tools and free data analysis software give you the flexibility to explore data analytics without high costs. You can create dashboards, perform advanced analysis, and collaborate with your team. These tools help you get the most value from your data analysis projects.
Choosing Free Data Analysis Tools
Selecting the right free data analysis tools can make your work easier and more productive. You need to consider several factors before deciding which platform fits your needs. The best data analysis tools offer features that match your skill level, integrate with your existing systems, and scale as your data grows.
Usability and Learning Curve
Ease of use is one of the most important factors when choosing free data analysis tools. If you have limited technical experience, you should look for platforms with intuitive interfaces and clear guidance. FineBI stands out for its user-friendly design, allowing you to build dashboards and perform analysis without coding. Tools like KNIME Analytics Platform also provide drag-and-drop workflows, making data analytics accessible to everyone.
| Factor | Description |
|---|---|
| Ease of Use | Assess your team's technical expertise. Some tools require coding, while others offer simple interfaces. |
Tip: Try a demo or tutorial before committing to a tool. This helps you understand the learning curve and see if the platform suits your workflow.
Features and Integration
Integration capabilities are essential for effective analysis. You should check how well free data analysis tools connect to your databases, cloud services, and business applications. FineBI supports over 100 data sources, including MySQL and Hadoop, and simplifies integration for non-technical users. Microsoft Power BI Free and KNIME Analytics Platform also offer integration options, but may require more setup or technical knowledge.
| Tool | Integration Options | Ease of Use |
|---|---|---|
| FineBI | Supports over 100 data sources, including MySQL and Hadoop. | Simplifies integration without technical expertise. |
| Microsoft Power BI | Offers integration but may require extra configuration or third-party connectors. | May require technical knowledge for setup. |
| KNIME Analytics Platform | Provides integration capabilities for data science workflows. | User-friendly interface for data manipulation. |
Note: Choose a tool that fits your current systems and future needs. Strong integration saves time and reduces errors in your analysis.
Scalability and Support
Scalability ensures your free data analysis tools can handle increasing data volumes and users. You should look for platforms with active user communities, tutorials, and discussion forums. Open-source data analytics tools like Python and R offer extensive resources and mentorship opportunities. FineBI supports enterprise-level scalability and provides customer support for business users.
- Active user communities help you solve problems quickly.
- Tutorials and guides improve your skills and confidence.
- Discussion forums connect you with mentors and collaborators.
- Continuous updates keep your data analysis software current.
Tip: Join user communities and explore available resources. This support network helps you maximize the value of your chosen data analytics platform.
FineBI: Free Data Analysis Tools
Enterprise Use Cases
You can use FineBI to solve real business problems with free bi tools. Many organizations choose FineBI when they need to move beyond spreadsheets and basic reporting. You can connect to many data sources and create dashboards that show key performance indicators. FineBI helps you manage data from sales, finance, HR, and supply chain in one place. You can use free bi tools like FineBI to build dashboards that update in real time. This means you always see the latest numbers and trends.
With FineBI, you can set up alerts for important changes in your data. You can share dashboards with your team and work together on analysis. Free bi tools like FineBI support role-based access, so you control who sees sensitive information. You can use open-source data analytics tools for some projects, but FineBI gives you enterprise-level features for free. Many companies use FineBI to improve efficiency, reduce costs, and make better decisions with data analytics.
Customer Success Story: BOE
BOE Technology Group shows how free bi tools can transform a business. BOE faced problems with data spread across many systems and unclear metrics. By using FineBI, BOE built a unified data warehouse and created dashboards for real-time monitoring. You can see how free bi tools helped BOE reduce inventory costs by 5% and increase operational efficiency by 50%. FineBI made it easy for BOE to compare performance across factories and spot risks early.
You can use free bi tools like FineBI to standardize metrics and improve communication between teams. BOE’s story proves that free data analysis tools can drive digital transformation. You can achieve measurable results, such as faster analysis, better data-driven decisions, and more effective teamwork. Free bi tools and open-source data analytics tools give you the power to unlock value from your data without extra cost.
Challenges and Tips in Free Data Analysis Tools
Common Limitations
When you use free data analysis tools, you may face several challenges. Many users report that setup can be complex, especially if you have limited experience with data analytics tools. Some platforms, like Orange Data Mining, work well for small organizations but struggle to scale for larger teams. You might notice limited functionality, which makes advanced analysis difficult. Documentation can be incomplete, so you may find it hard to solve problems on your own.
| Challenge | Description |
|---|---|
| Setup Complexity | You may find the setup process confusing or time-consuming. |
| Limitations in Functionality | Some tools do not support complex analysis or advanced features. |
| Documentation Issues | Lack of clear guides can slow down your progress. |
You should also consider security when using free ai data analytics tools. Data is a target for cybercriminals. You need to protect your data assets and maintain privacy. Encryption and access controls help keep your information safe. Businesses must invest in security measures, especially when dashboards and analysis contain sensitive data.
Tip: Always review the security features of any free ai data analytics tools before you start your analysis.
Overcoming the Learning Curve
You can overcome the learning curve with a few smart strategies. Start by improving your data literacy through training and development. Attend workshops and conferences to learn new skills. Set learning goals and include them in your performance reviews. Create a feedback environment where you and your team share lessons from recent projects.
- Foster a data-driven culture by encouraging everyone to learn about data analysis.
- Support professional development with access to courses and industry events.
- Share feedback and best practices to help each other grow.
- Use open-source data analytics tools for hands-on practice and experimentation.
You will find that many free ai data analytics tools offer tutorials and community forums. These resources help you solve problems and learn faster. Try building simple dashboards first, then move to more complex analysis. As you gain experience, you can explore ai-powered data analytics and advanced features.
Note: Start with small projects and use open-source data analytics tools to build your confidence. Practice makes analysis easier and more effective.
Quick Comparison: Free Data Analysis Tools
Feature Overview Table
You can quickly compare free data analysis tools using the table below. This overview highlights the main features, integration options, and best use cases for each platform. You will see how FineBI, Microsoft Power BI Free, Google Data Studio, KNIME Analytics Platform, Tableau Public, Apache Superset, and Orange Data Mining stack up for analysis and data visualization tools.
| Tool | Integration Options | Key Features | Best For |
|---|---|---|---|
| FineBI | 100+ sources, big data, SQL, APIs | Self-service analytics, dashboards, AI, governance | Enterprises, business teams |
| Power BI Free | 120+ connectors, Excel, cloud | User-friendly, DAX, basic dashboards | Small businesses, enterprises |
| Google Data Studio | Google apps, 600+ connectors | Real-time dashboards, easy sharing | Marketing, teams, collaboration |
| KNIME Analytics | Open-source, Python, R, SQL | Modular workflows, ML, automation | Research, advanced analytics |
| Tableau Public | CSV, Excel, cloud | Leading visualizations, public sharing | Data storytelling, education |
| Apache Superset | SQL, cloud, big data | Custom dashboards, open-source | Tech teams, large datasets |
| Orange Data Mining | CSV, Excel, add-ons | Visual programming, ML, widgets | Education, prototyping |
Best Fit by Scenario
You should choose your data analysis tools based on your goals, team size, and technical skills. Here are some common scenarios to help you decide:
- If you want to build interactive dashboards for your business, FineBI and Power BI Free offer strong options. FineBI gives you advanced governance and AI features, while Power BI Free is easy for beginners.
- For marketing teams or those who need to share dashboards quickly, Google Data Studio works well. You can connect to many sources and collaborate in real time.
- If you focus on academic research or advanced analysis, KNIME Analytics Platform and Orange Data Mining provide open-source flexibility and machine learning support.
- For large enterprises or organizations with technical resources, Apache Superset and Tableau Public deliver scalable data analytics and industry-leading data visualization tools.
Tip: Start by listing your main analysis needs. Match those needs to the tool that offers the best features and integration for your workflow.
You can unlock the full potential of data analysis and visualization by exploring FineBI and other popular data analysis tools. Start by cleaning your data, removing duplicates, and ensuring consistent formats. Use FineBI’s intuitive features for flexible data visualization and analysis. Experiment with different tools to find the best fit for your workflow and future of data analysis tools. Join user communities, access tutorials, and pursue certifications to improve your data reporting skills.
| Resource Type | Link |
|---|---|
| Help Document | Data Editing and Updating |
| Training Videos | Training |
| Learning Path | Learning path |
| Certifications | Certifications |
| Plugins | Plugins |

Continue Reading About Data Analysis Tools
How to Do Retention Analysis for Business Success
What is Pareto Chart and How Does it Work
How DuPont Analysis Helps You Understand Your Business


FAQ

The Author
Lewis
Senior Data Analyst at FanRuan
Related Articles

What Recruiters Look for in a Data Analysis Portfolio: 10 Criteria to Score Yours Fast
A $1 is not judged like a school assignment. It is judged like a hiring shortcut. Recruiters, hiring managers, and analytics leads use it to answer one question fast: Can this person solve business problems with data in
Lewis Chou
May 29, 2026

What Is Data Analytics Consulting? Beginner’s Guide to Services, Deliverables, and Business Value
$1 helps organizations turn raw data into decisions they can trust. For many business leaders, the challenge is not a lack of data. It is a lack of clarity. Reports conflict, teams track different KPIs, dashboards are un
Lewis Chou
Jun 03, 2026

Data Analyst Job Description [+2026 Guide]: Compare Responsibilities, Skills, and Salary by Industry
A strong $1 does more than list tasks. It defines how a company turns raw data into business decisions, which teams the analyst supports, and what measurable outcomes the role is expected to influence. For employers, tha
Lewis Chou
Jun 02, 2026