You use management information systems, or MIS tools, to organize your data and turn it into smart decisions. These tools help you see the big picture and respond quickly to what your business needs. Today, AI and automation change the game. The following list highlights the best mis tools for organizations seeking to see the big picture, leverage intelligent automation, and respond quickly to business needs:
You probably hear a lot about data these days. But what do you actually do with all that information? That’s where MIS tools come in. Management Information Systems (MIS) tools help you collect, organize, and use data to run your business better. These tools act like the brain of your organization, turning numbers and facts into smart actions.
Here’s how MIS tools make a difference in your daily work:
MIS tools give you the power to see what’s happening in your business and act fast.
MIS tools do more than just store data. They help you turn raw numbers into useful information. This is the heart of business intelligence. You can track sales, watch customer behavior, and spot market trends in real time. That means you can adjust your strategy before problems grow.
Here’s a quick look at how MIS tools boost business intelligence and decision-making:
| Contribution of MIS to Business Intelligence and Decision-Making | Description |
|---|---|
| Accurate and Timely Data | MIS gives you real-time updates on sales, customers, and trends so you can act fast. |
| Streamlining Operations | You connect different parts of your business, cut out extra steps, and speed up work. |
| Advanced Data Analysis | You use smart tools to find patterns and predict what might happen next. |
MIS tools also help you spot new opportunities and avoid risks. You can automate routine jobs, which frees up your time for bigger ideas. When you bring data from different sources together, you get a full picture of your business.
Tip: Use MIS tools to focus on what matters most. Let the system handle the details while you drive the big decisions.
The world of MIS keeps changing. In 2026, you’ll see even more exciting features. Flexibility will be key. You can pick the workflow that fits your team, whether you like Scrum, Kanban, or something else. Unified dashboards will let everyone—from engineers to business leaders—see the same data and make smarter choices together.
Integration will get easier, too. You’ll connect your MIS tools with platforms like GitHub or CI/CD pipelines. This means less manual work and smoother operations. Resource management will help you balance workloads and avoid burnout. You’ll also see tools that link every part of your business, making sure your daily work matches your big goals.
Stay ready for these trends. They’ll help you work smarter, not harder, and keep your business ahead of the curve.
You want a tool that makes data easy to understand. Microsoft Power BI does just that. It helps you turn raw numbers into colorful charts and dashboards. You can connect Power BI to almost any data source, from Excel files to cloud databases. The drag-and-drop interface lets you build reports without writing code. You get real-time updates, so you always see the latest numbers. Power BI also uses AI to spot trends and make predictions.
Website: https://www.microsoft.com/en-us/power-platform/products/power-b
Key features include:
You can use Power BI in many ways. Sales teams track performance and spot new opportunities. Finance departments monitor budgets and expenses. Operations managers watch supply chains and inventory. Schools and nonprofits use it to measure program results. If you need to share data with your team or clients, Power BI makes it simple.
Power BI offers a few pricing options:
You can start with the free version and upgrade as your needs grow.
Power BI stands out for its user-friendly design and deep integration with other Microsoft products. You get strong AI features and real-time data updates. The community support is huge, so you can always find help or tutorials. If you already use Microsoft tools, Power BI fits right in.
SAP BusinessObjects gives you a full suite of mis tools for reporting, analysis, and data visualization. You can connect to many data sources and create detailed reports. The platform supports both ad-hoc and scheduled reporting. You get strong security controls, so only the right people see sensitive data. SAP BusinessObjects also lets you automate report delivery and manage large volumes of information.
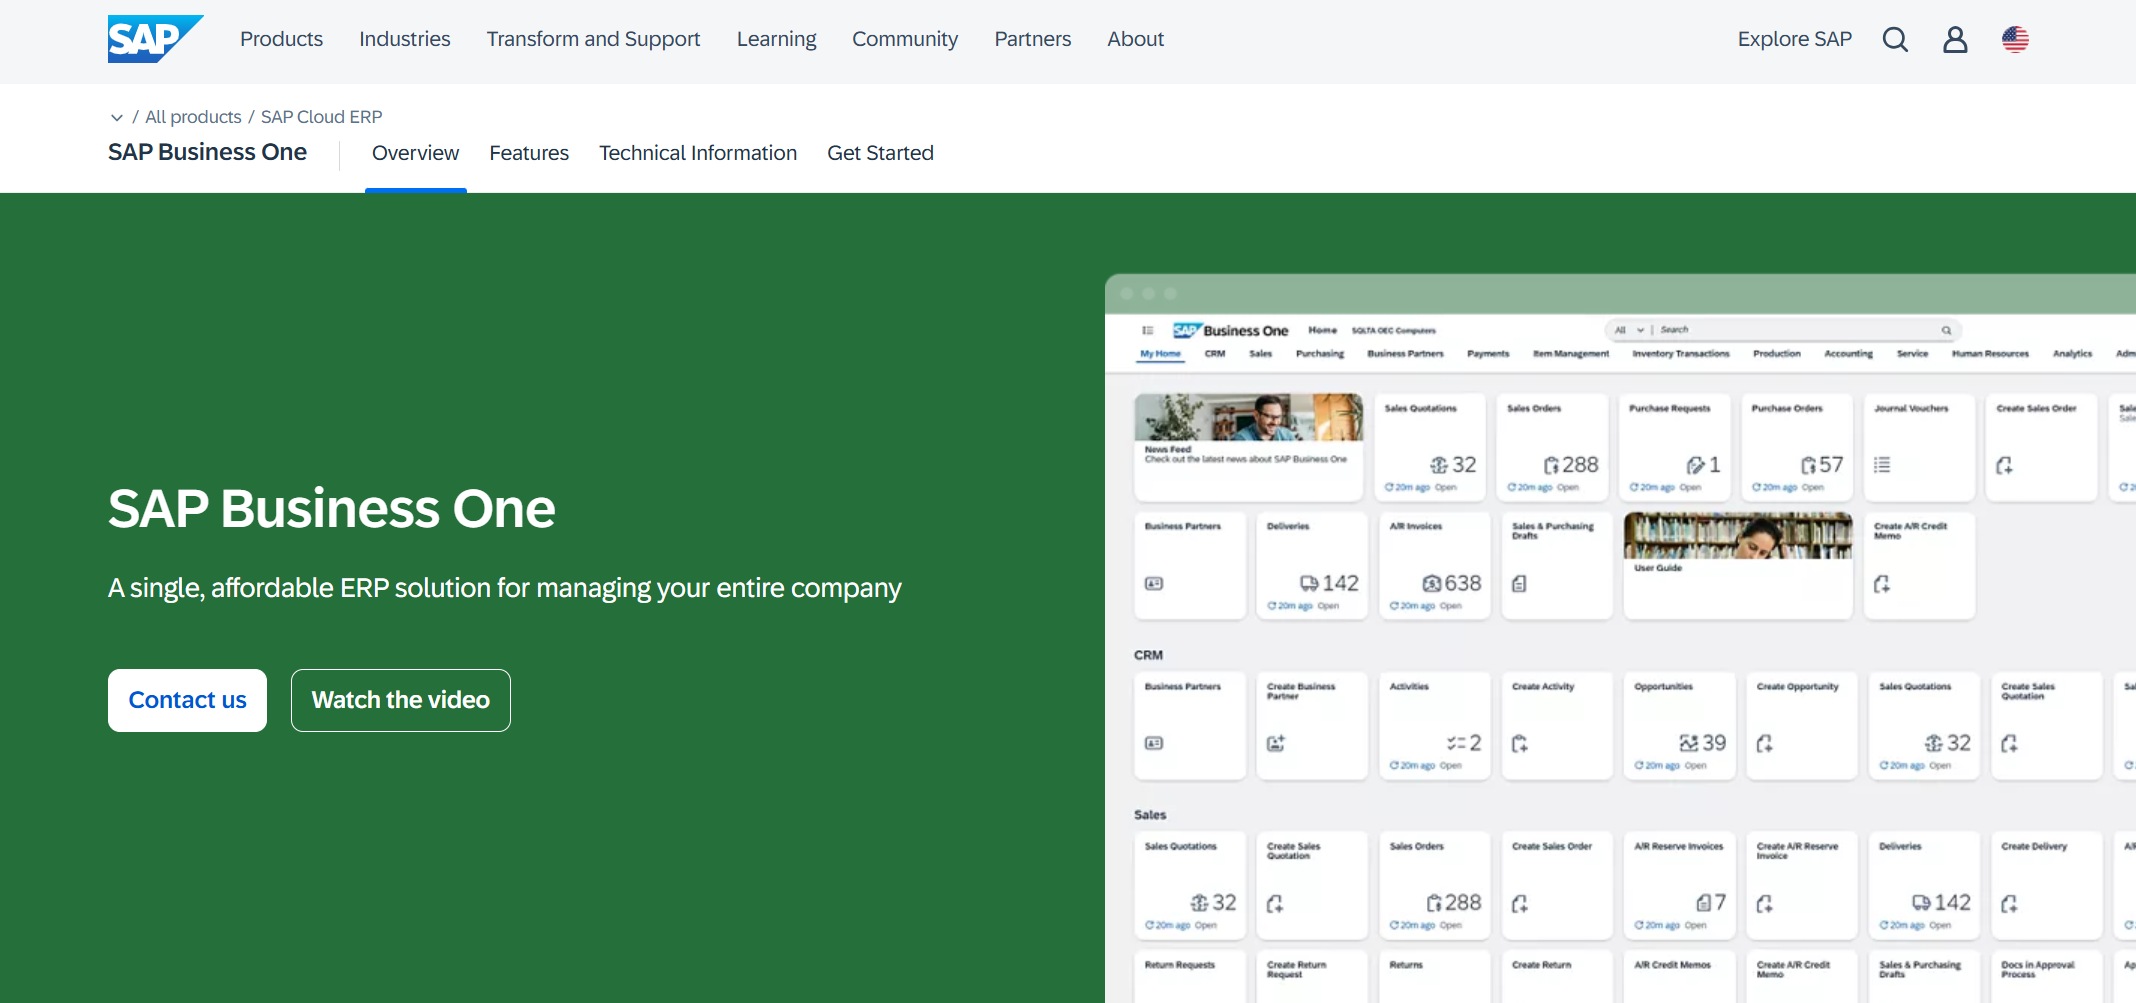
Website: https://www.sap.com/products/data-cloud/bi-platform.html
Main features include:
You see SAP BusinessObjects in action across many industries:
Companies use it to track production, manage supply chains, and analyze customer data. Financial teams rely on it for compliance and audit reports. Healthcare providers use it to improve patient care and operations.
SAP BusinessObjects uses a custom pricing model. You pay based on the number of users, features, and deployment options. You need to contact SAP or a reseller for a quote. Many organizations choose this platform for its flexibility and scalability.
SAP BusinessObjects shines when you need enterprise-level reporting and analytics. You get strong integration with SAP systems and other business platforms. The tool handles complex data and large user groups with ease. If your organization works in a regulated industry, you’ll appreciate the robust security and compliance features.
FineReport gives you a flexible and powerful suite of software development management tools for reporting and data visualization. You can create pixel-perfect reports, interactive dashboards, and dynamic documents—all with a drag-and-drop interface. FineReport connects to over 500 data sources, including databases, cloud platforms, and files. You can build reports that update in real time, so you always see the latest numbers.

Website: https://www.fanruan.com/en/finereport
Key features include:
You can customize every report to fit your business needs. FineReport supports both standard and complex reporting scenarios, making it a great fit for any organization.
You can use FineReport across many industries and departments. Manufacturers track production and quality metrics. Financial teams monitor budgets and expenses. HR manages employee data and onboarding. Sales teams analyze performance and customer trends. You get software development management tools that help you make smarter decisions every day.
Here are some real-world scenarios:
Note: FineReport’s decision-making platform lets you manage users, permissions, and data security in one place. You can share insights across your organization with confidence.
FineReport uses a flexible licensing model. You can choose between perpetual licenses or annual subscriptions. Pricing depends on the number of users, deployment type, and features you need. You can contact FanRuan for a custom quote. Many organizations find FineReport cost-effective because it covers a wide range of software development management tools in one platform.

FineReport stands out for its user-friendly design and deep customization. You can create complex reports without coding. The drag-and-drop interface makes report building fast and easy. FineReport supports real-time data integration, so you always work with the latest information. The platform’s 3D dashboards and mobile BI features keep you connected anywhere.
You also get:
FineReport has earned recognition from Gartner and Forbes, and serves over 45,000 clients worldwide. Companies like BOE, Red Bull, and Omron use FineReport to drive digital transformation and boost efficiency. You get a trusted partner for your software development management tools needs.
Tip: FineReport helps you turn data into action. You can empower your team to make informed decisions and stay ahead in a fast-changing world.
Learn more about FineReport and explore its features on the official website.
Oracle NetSuite is more than just a reporting tool. It’s a full cloud-based business management suite. You get mis tools for accounting, CRM, inventory, and more—all in one place. NetSuite’s dashboards show you real-time data from every part of your business. You can customize reports and automate workflows. The platform supports global operations, with multi-currency and multi-language features.
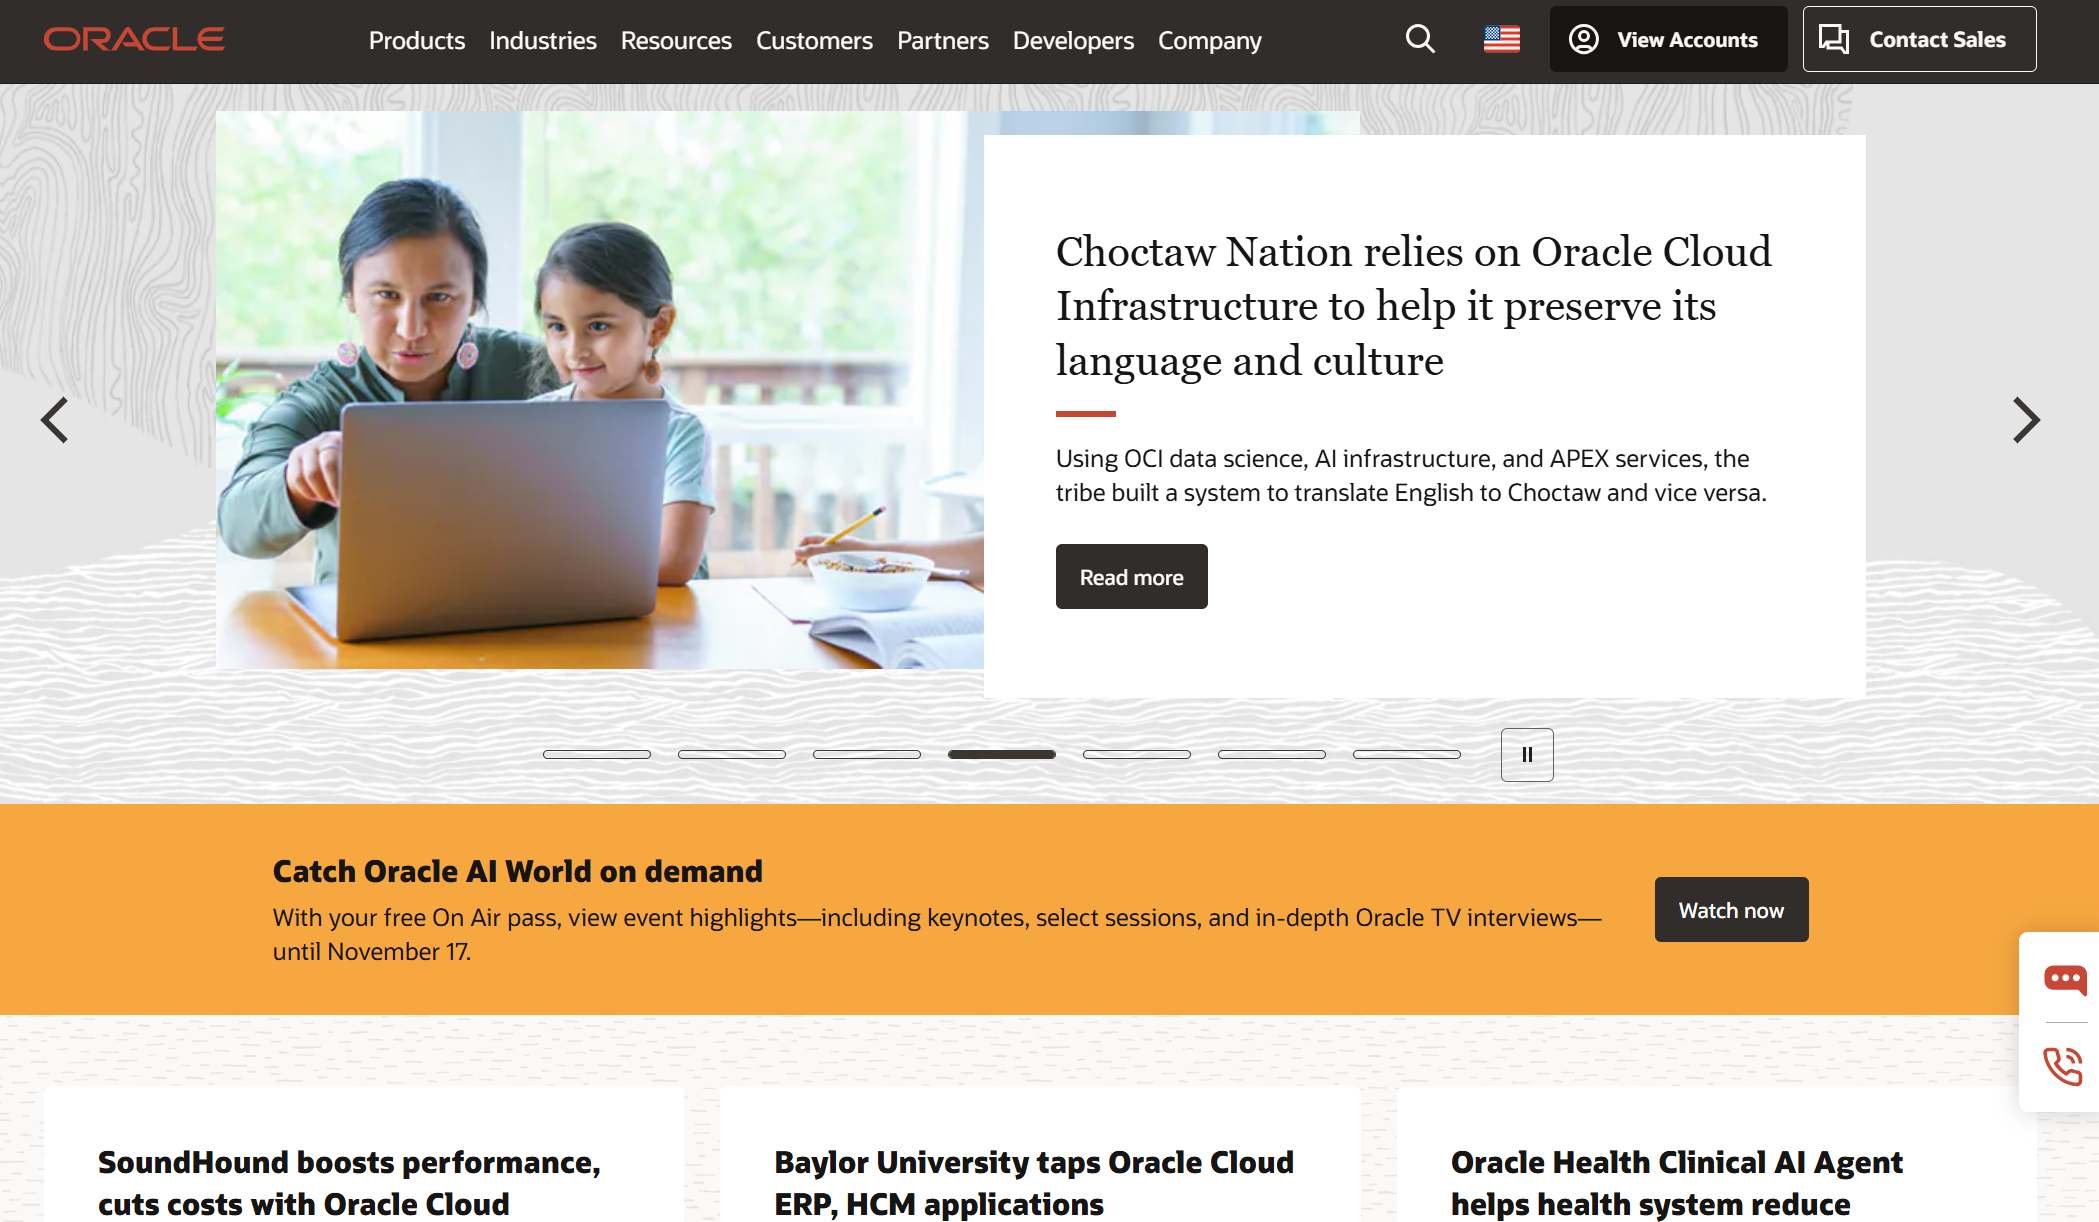
Website: https://www.netsuite.com.sg/portal/sg/home.shtml
Top features include:
You can use Oracle NetSuite if you run a fast-growing business. Retailers track sales and inventory in real time. Service companies manage projects and billing. Manufacturers monitor production and supply chains. Finance teams handle accounting and compliance. NetSuite adapts as your business changes.
Oracle NetSuite uses a subscription model. Pricing depends on the modules you choose, number of users, and company size. You need to request a custom quote from Oracle. Many businesses find the investment worthwhile because they get a complete solution.
NetSuite stands out for its all-in-one approach. You don’t need separate mis tools for each department. Everything connects in the cloud, so you get a single source of truth. The platform grows with you, making it a smart choice for companies planning to expand.
Tip: When you compare mis tools, think about how well they fit your current needs and future plans. The right tool can save you time and help your business grow.
You want to see your data come alive. Tableau helps you do just that. This tool lets you turn numbers into colorful charts and interactive dashboards. You can drag and drop data to build reports in minutes. Tableau connects to almost any data source, from spreadsheets to cloud databases. You get real-time updates, so your team always sees the latest information.

Website: https://www.tableau.com/
Key features include:
You do not need to be a data expert to use Tableau. The interface feels simple and friendly. You can share dashboards with your team or publish them online.
Tableau fits many departments and industries. You can use it for almost any business question. Here’s a quick look at how different teams use Tableau every day:
| Department | Common Use Cases |
|---|---|
| IT | Asset inventory, helpdesk call volume, resource allocation, security patch compliance |
| Finance | Budget planning, accounts payable, travel expenses |
| Marketing | Campaign engagement, web engagement, lead tracking |
| Human Resources | Turnover rate, open headcount, new hire retention, employee satisfaction |
| Sales | Sales tracking, pipeline coverage, average deal size, win/loss rate |
| Facilities Operations | Physical locations, call center workload, work request volume and resolution time |
You can also find Tableau in action at companies like REI, Coca-Cola Bottling Company, and Chipotle. For example, REI uses Tableau to track membership and boost customer satisfaction. Coca-Cola Bottling Company automates reports to save time. Chipotle gets a unified view of restaurant operations, which speeds up reporting. Even schools like Des Moines Public Schools use Tableau to spot at-risk students and help them early.
Tip: You can use Tableau to answer almost any business question. Just connect your data and start exploring.
Tableau offers several pricing options:
You can choose a plan based on your needs. There is also a free trial if you want to test it first.
Tableau stands out for its easy-to-use interface and powerful visualizations. You can build dashboards quickly and share them with anyone. The tool works well for both small teams and large organizations. You get real-time data, AI-powered insights, and strong support for mobile devices. Tableau helps you see your business clearly and make smarter decisions.
You want a tool that makes data analysis simple and fast. Zoho Analytics does just that. You can connect to many data sources, including cloud apps, databases, and spreadsheets. The drag-and-drop interface lets you build reports and dashboards without coding. Zoho Analytics supports real-time data processing, so you always see the latest numbers.

Website: https://www.zoho.com/analytics/
Key features include:
You can set up dashboards that refresh automatically. Your team always sees up-to-date KPIs as new data comes in.
Zoho Analytics works for many types of organizations. You can use it to track sales, monitor marketing campaigns, or manage inventory. Teams use it to analyze customer feedback, measure employee performance, and watch financial trends. The tool fits both small businesses and large enterprises.
Here are some ways you might use Zoho Analytics:
Note: Zoho Analytics helps you stay on top of your business by showing you what’s happening right now.
Zoho Analytics offers flexible pricing:
You can try Zoho Analytics for free before you decide.
Zoho Analytics stands out for its real-time data processing. You get dashboards that update automatically, so you never miss a change. The tool connects to many data sources and supports AI-powered analysis. You can blend data from different places and see everything in one view. Zoho Analytics makes it easy to track your business and act fast.
IBM Cognos Analytics gives you a complete platform for reporting, analysis, and dashboard creation. You can connect to many data sources and use AI to get smart recommendations. The web-based tools let you build reports and dashboards from anywhere. You can collaborate with your team and share insights easily.
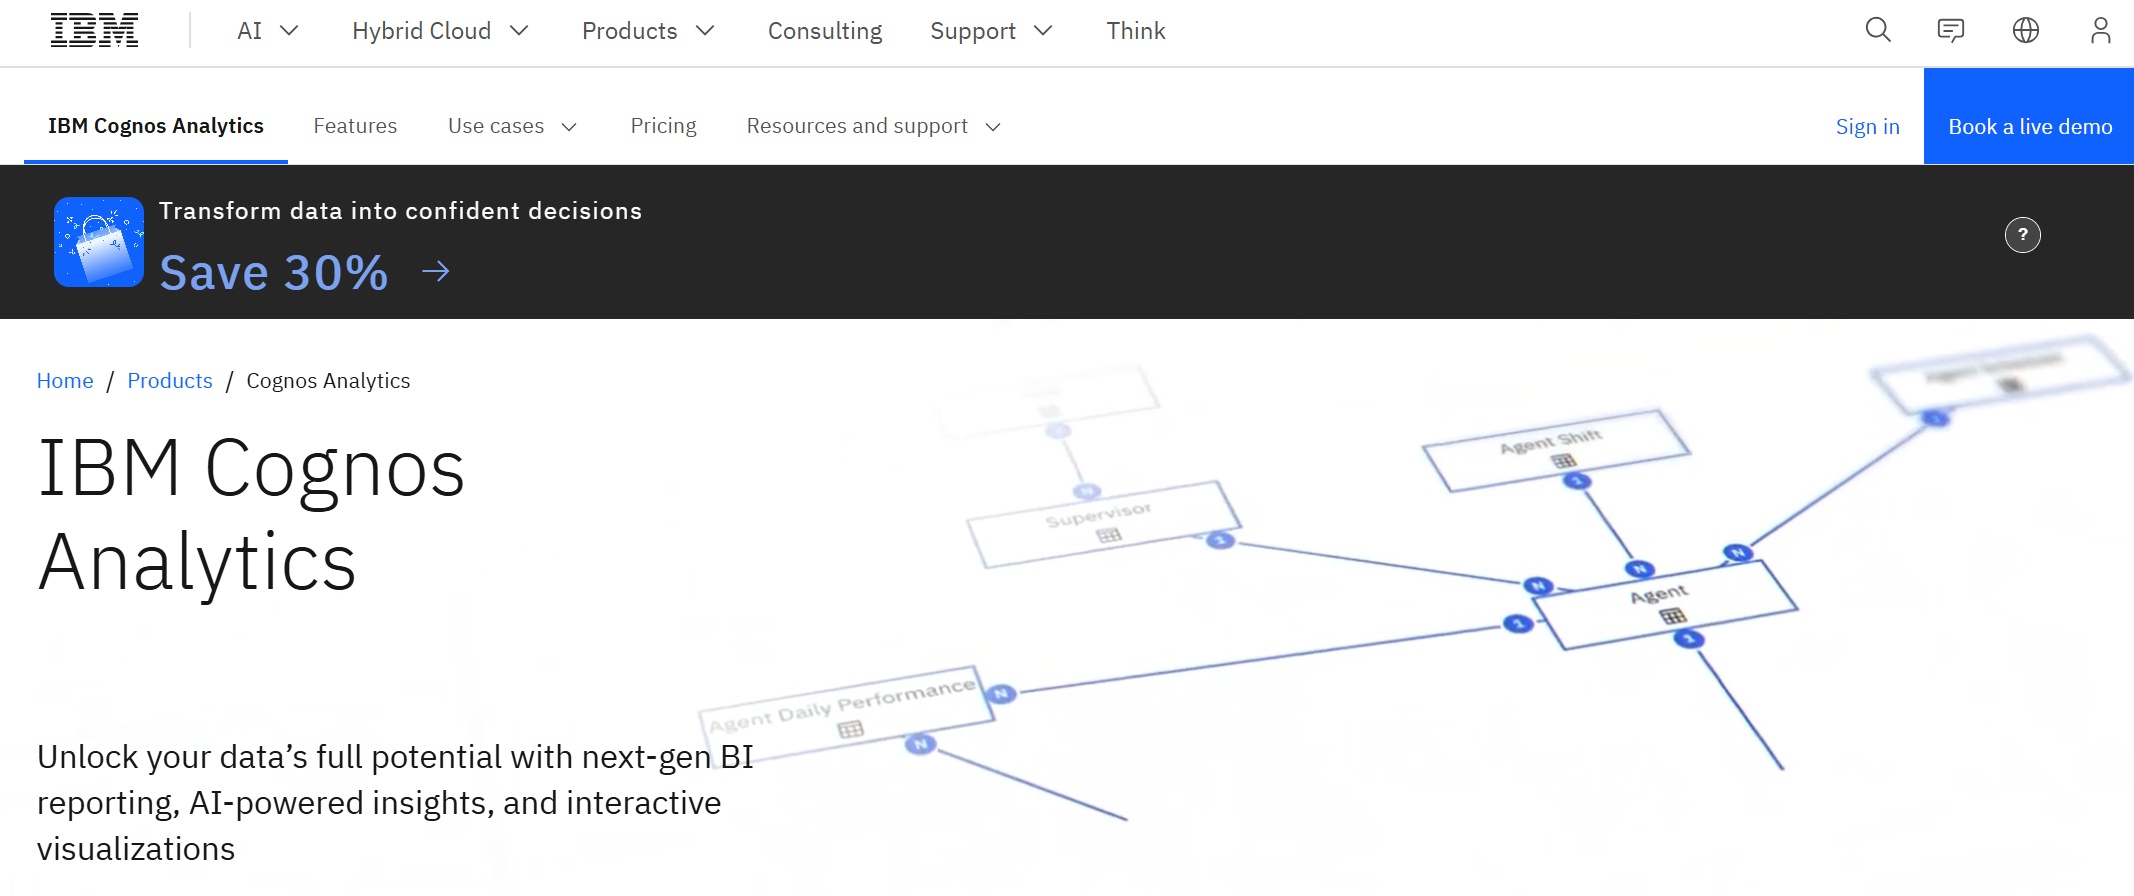
Website: https://www.ibm.com/products/cognos-analytics
Key features include:
You can use Cognos Analytics even if you are not a data expert. The platform guides you with smart suggestions and easy-to-use tools.
IBM Cognos Analytics works well for small and mid-sized firms, especially in IT and education. You can use it to handle large amounts of data and create detailed reports. Teams use it to track performance, manage resources, and support decision-making.
Common use cases include:
You can collaborate with your team on dashboards and share reports across your organization.
IBM Cognos Analytics offers several pricing options:
You can contact IBM for a custom quote or start with a free trial.
IBM Cognos Analytics stands out for its collaboration features and AI-powered recommendations. You can work with your team on dashboards and reports. The platform supports small and mid-sized organizations, making it flexible for different needs. You get comprehensive web-based tools, strong data handling, and support for growth. Cognos Analytics helps you improve ROI and scale best practices as your business grows.
| Key Differentiator | IBM Cognos Analytics | Other Tools (e.g., Strategy One) |
|---|---|---|
| Target Audience | Small to mid-sized firms, especially IT and education | Varies, often larger enterprises |
| Operational Alignment | Robust data handling for smaller operations | May not be as flexible |
| Collaboration Features | User collaboration on dashboards and reports | Features may vary |
| Data Visualization and Analysis | Comprehensive web-based tools with AI recommendations | May lack advanced analytics |
| ROI and Growth Support | Helps improve ROI and scale best practices for growth | Focus may differ |
Tip: If you want a tool that grows with your business and supports teamwork, IBM Cognos Analytics is a strong choice.
You want your data to work smarter for you. Salesforce Einstein Analytics brings artificial intelligence right into your business dashboards. This tool uses advanced algorithms to sift through huge amounts of data. It uncovers patterns and gives you insights you might miss on your own. You get predictions about sales trends, customer behavior, and more—all inside your Salesforce platform.
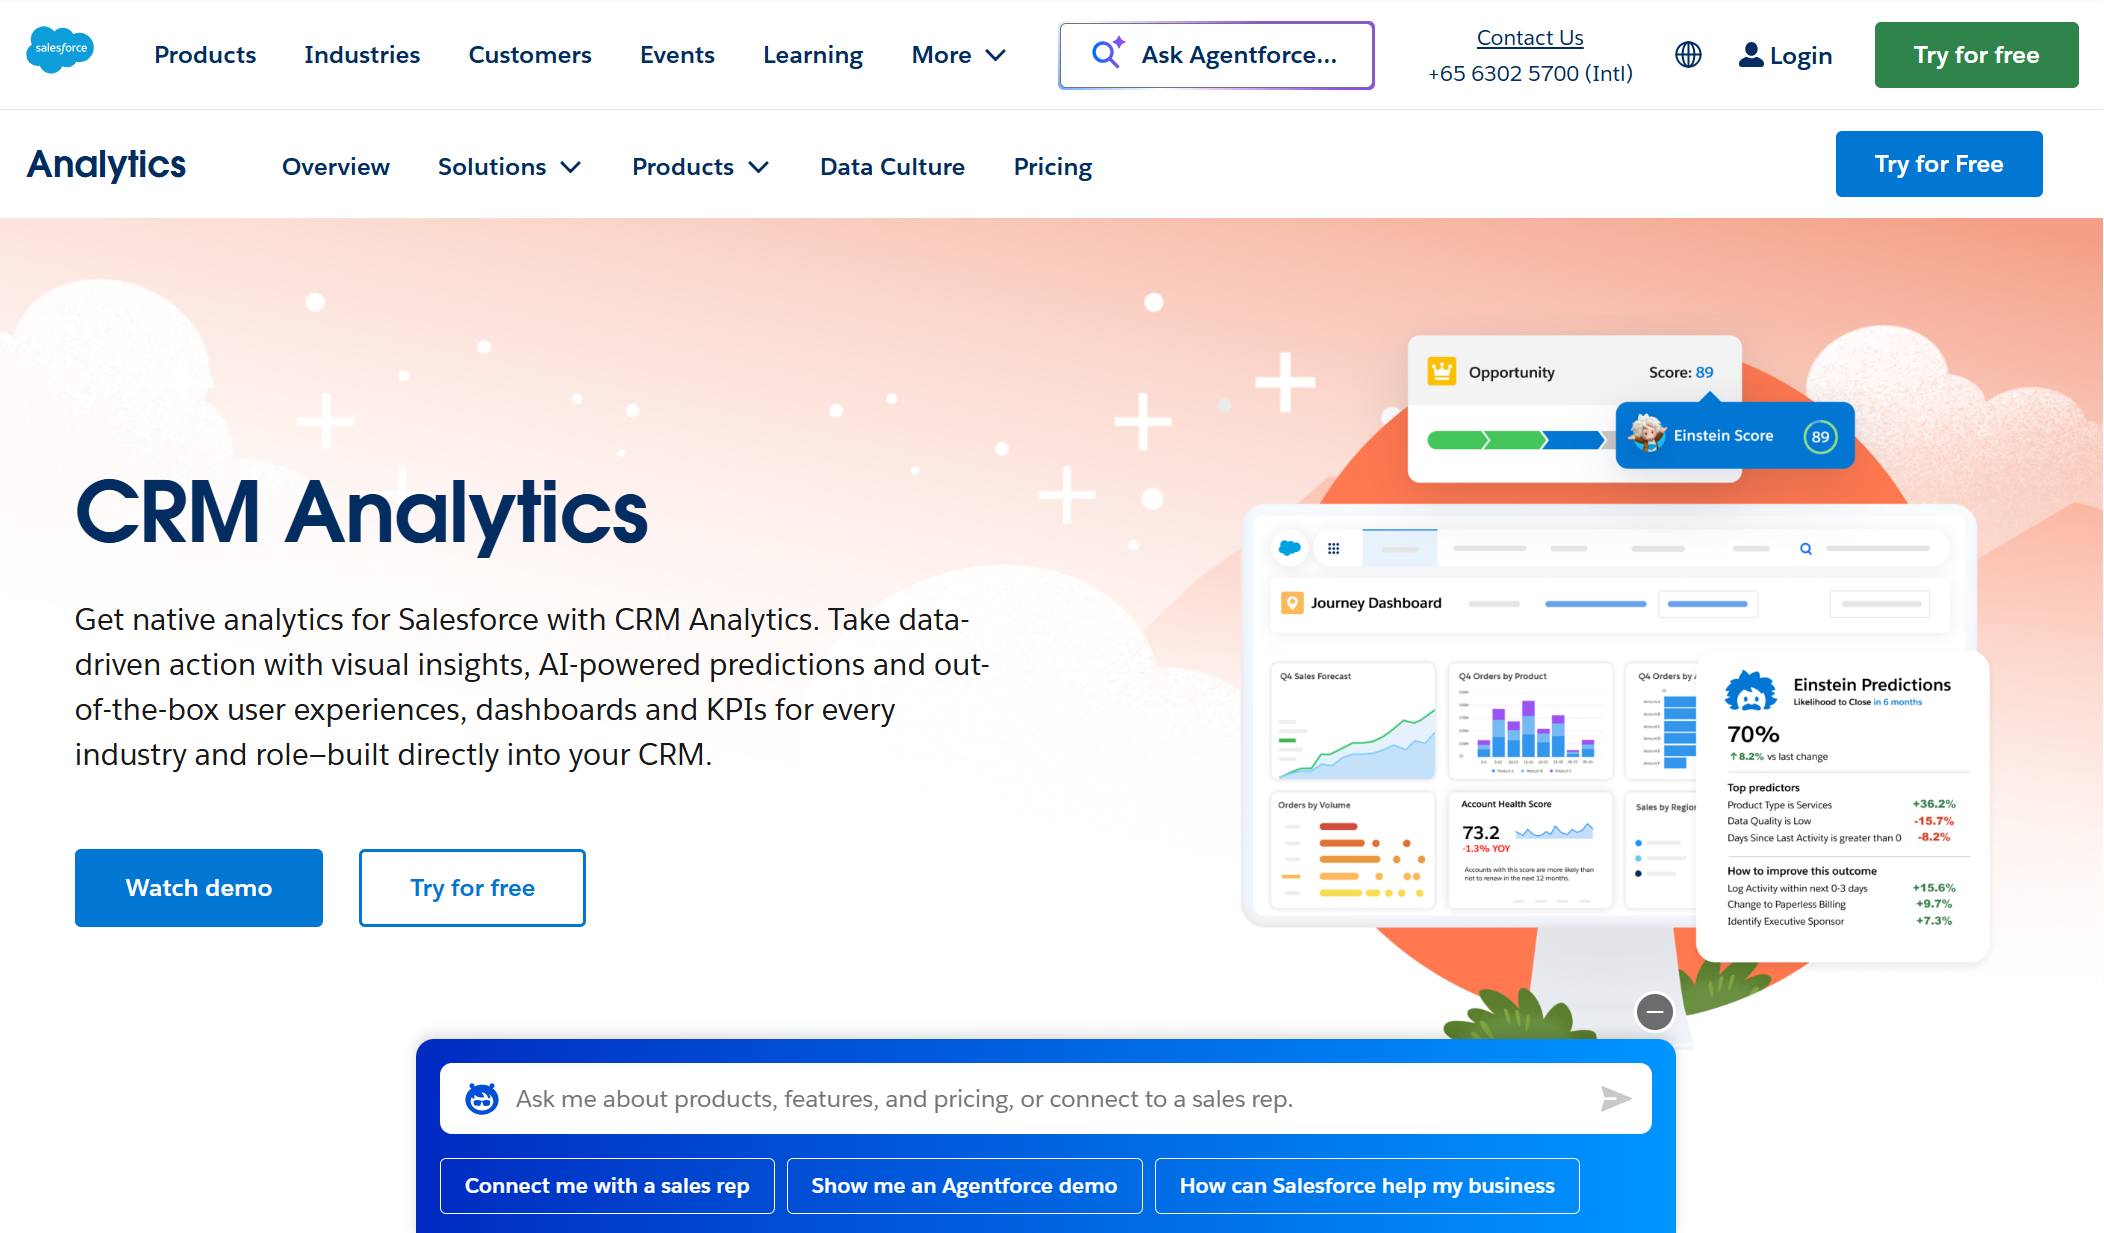
Website: https://www.salesforce.com/ap/analytics/crm/
Here’s what you can do with Einstein Analytics:
Einstein Analytics helps you make decisions based on facts, not just guesses.
You can use Salesforce Einstein Analytics in many ways:
If you already use Salesforce, Einstein Analytics fits right in. You don’t need to jump between tools. Everything you need is in one place.
Tip: Let Einstein Analytics handle the heavy lifting. You get the insights, and you make the moves.
Salesforce Einstein Analytics offers flexible pricing. You pay per user, per month. The cost depends on the features you need and the size of your team. Plans usually start around $75 per user per month for basic analytics. Advanced AI and predictive features may cost more. You can contact Salesforce for a custom quote that fits your business.
Einstein Analytics stands out because it puts AI at your fingertips. You don’t need to be a data scientist. The tool analyzes data fast, finds hidden patterns, and gives you clear, actionable insights. You get predictions that help you plan ahead. The platform tailors insights to your business, making your strategies more effective. If you want to boost your decision-making with smart technology, Einstein Analytics is a top choice.
Qlik Sense gives you the power to explore your data from every angle. You can create interactive dashboards and reports with simple drag-and-drop actions. The tool connects to many data sources, so you see all your information in one place. Qlik’s unique associative engine lets you search and filter data instantly, revealing connections you might not notice otherwise.

Website: https://www.qlik.com/us/products/qlik-sense
Key features include:
You don’t need to write code or rely on IT for every report. Qlik Sense makes analytics easy and flexible.
You can use Qlik Sense in almost any industry:
Qlik Sense adapts to your needs, whether you run a small business or a global company.
Qlik Sense uses a subscription model. You pay per user, per month. Pricing starts at about $30 per user per month for the Business plan. Enterprise plans offer more features and support, with custom pricing based on your organization’s size and needs. You can try Qlik Sense with a free trial before you commit.
Qlik Sense shines when your business needs to grow. The platform scales with you, handling more users and data as you expand. Here’s a quick look at its scalability features:
| Scalability Feature | Description |
|---|---|
| Elastic scalability based on demand | Qlik Sense can scale resources dynamically based on user demand. |
| Multi-node deployment capabilities | Supports deployment across multiple nodes for better resource management. |
| Load balancing for optimal performance | Distributes user load evenly to maintain performance. |
| High availability configurations | Ensures system uptime and reliability. |
| Integration with existing infrastructure | Can be integrated seamlessly with current systems. |
You get reliable performance, even as your team grows. Qlik Sense keeps your analytics running smoothly, no matter how big your business gets.
Domo brings all your data together in one place. You can connect to thousands of data sources—cloud apps, databases, spreadsheets, and more. The platform handles data integration and ETL (Extract, Transform, Load) for you. With Domo’s drag-and-drop Magic ETL tool, you can clean and prepare your data without writing code. If you’re more technical, you’ll find advanced features to customize your workflows.
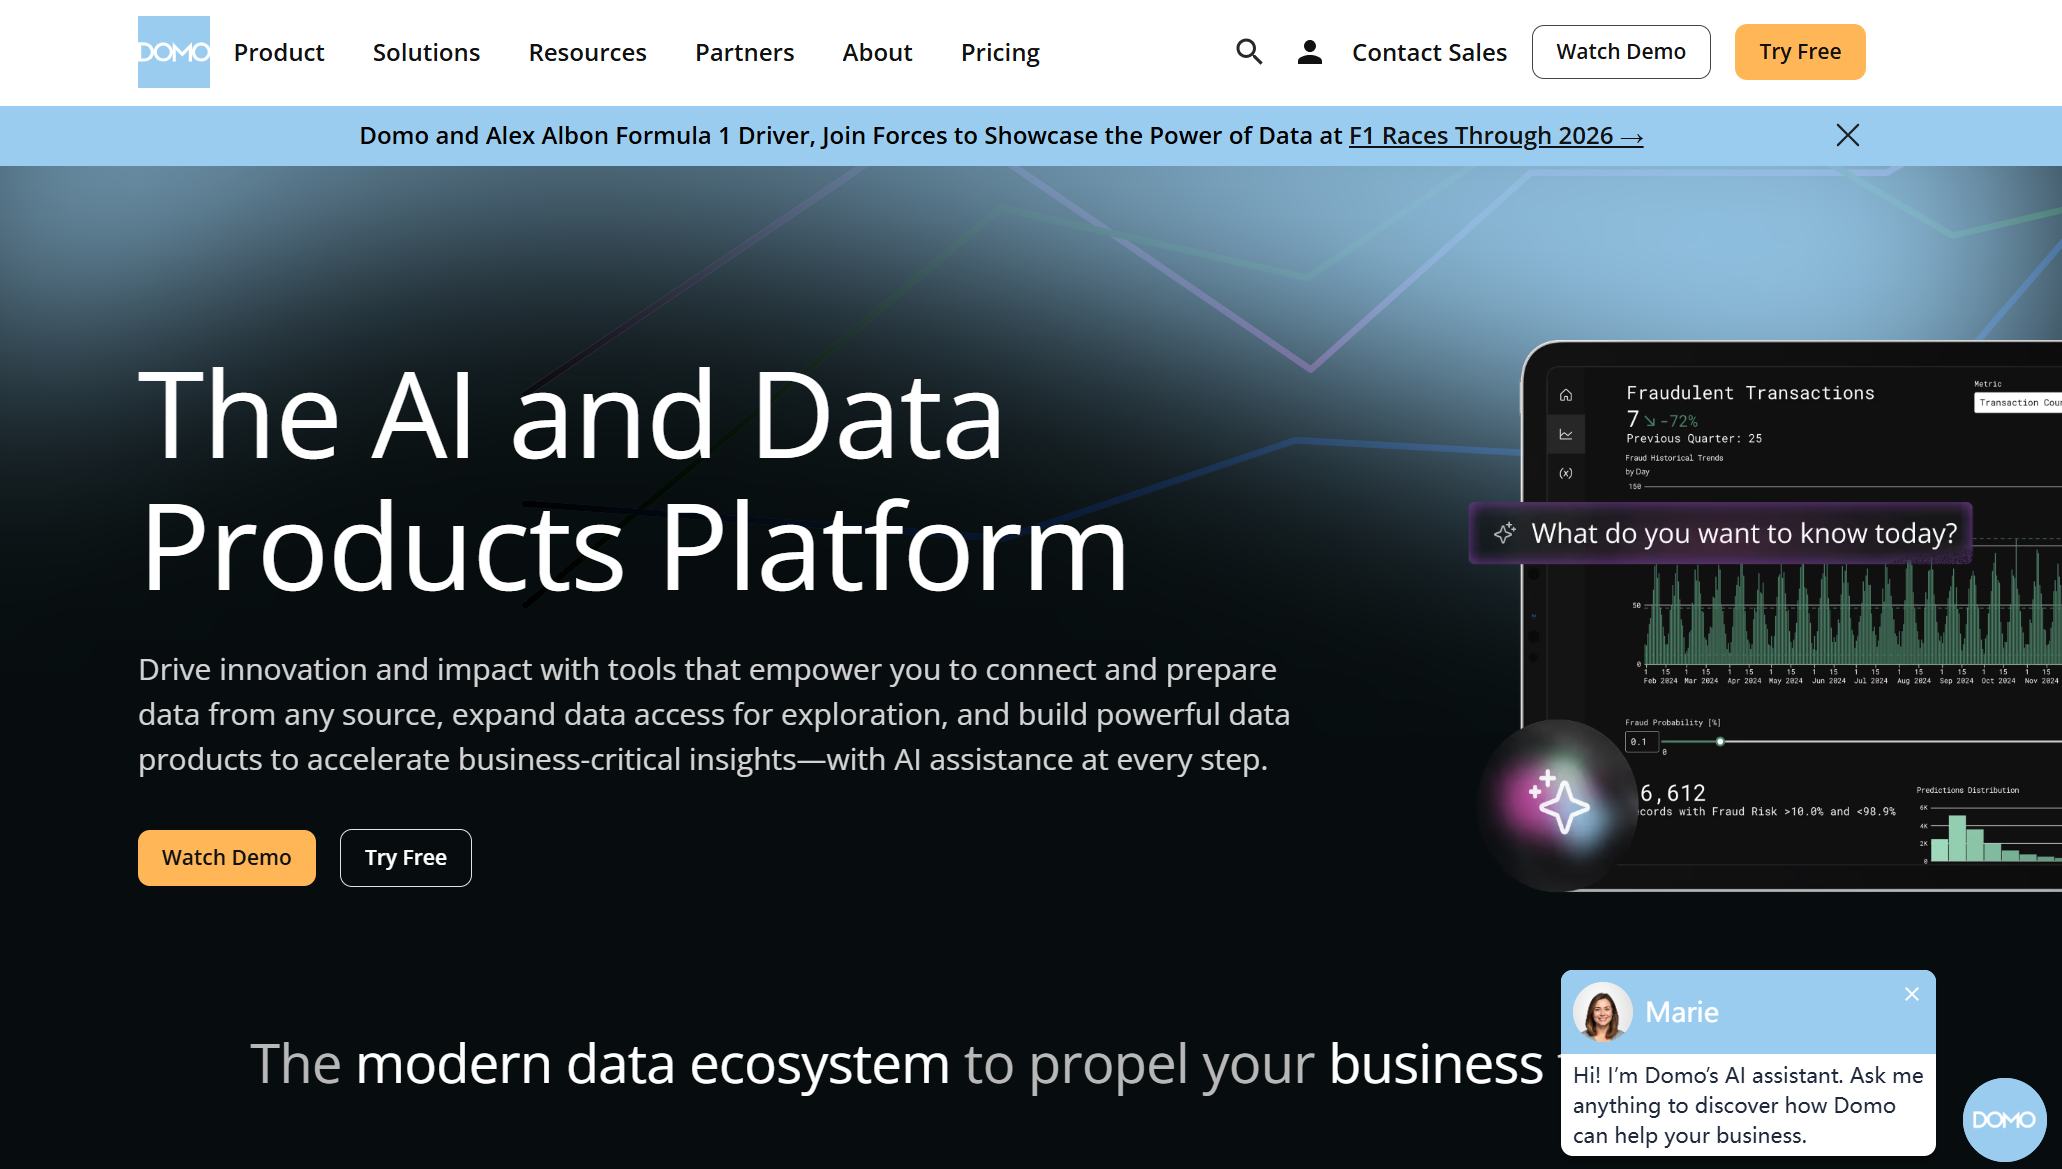
Website: https://www.domo.com/
Here’s what you get with Domo:
Domo makes it simple for everyone—from beginners to experts—to work with data.
You can use Domo across your whole organization:
Domo helps you break down data silos and see the full picture.
Note: Domo’s user-friendly interface means you spend less time wrangling data and more time making decisions.
Domo offers custom pricing based on your needs. You pay for the number of users, data sources, and features you require. There’s no one-size-fits-all plan, so you’ll need to contact Domo for a personalized quote. You can also request a demo or trial to see how it fits your business.
Domo stands out for its easy data integration and ETL process. You don’t need to be a tech expert to connect your data and start analyzing. The platform’s Magic ETL tool lets you drag and drop your way to clean, organized data. Domo supports both simple and complex workflows, making it a great fit for teams of all skill levels. If you want a tool that grows with you and makes data easy, Domo is worth a look.
You want a tool that lets you dig deep into your data. Sisense gives you that power. You can connect to almost any data source—cloud, on-premises, or hybrid. Sisense uses a unique in-chip technology that speeds up data processing. You get fast answers, even with huge datasets.
Sisense offers a drag-and-drop interface. You can build dashboards and reports without writing code. The platform supports advanced analytics, including AI and machine learning. You can embed analytics into your own apps or websites. Sisense also lets you customize dashboards for different users.

Website: https://www.sisense.com/
Key features include:
You can use Sisense in many industries. Retailers track sales and inventory trends. Healthcare teams monitor patient outcomes. Manufacturers analyze production data. Finance teams manage risk and compliance. You can even embed Sisense dashboards into your customer-facing apps.
Here are some ways you might use Sisense:
Tip: Sisense works well for both technical and non-technical users. You can start simple and grow into advanced analytics as your needs change.
Sisense uses a custom pricing model. You pay based on the number of users, data volume, and features you need. You’ll need to contact Sisense for a personalized quote. They offer demos and trials so you can see if it fits your business.
Sisense stands out for its speed and flexibility. The in-chip technology means you get answers fast, even with big data. You can embed analytics anywhere—inside your apps, websites, or portals. Sisense supports both self-service and advanced analytics, so everyone on your team can find value. If you want a tool that grows with you and adapts to your needs, Sisense is a smart choice.
SAP S/4HANA is a next-generation ERP suite. You get real-time analytics, streamlined processes, and a unified platform for your business. The system runs on SAP’s high-speed HANA database, so you see instant results. You can manage finance, supply chain, manufacturing, and more—all in one place.
SAP S/4HANA uses AI and automation to boost productivity. You can automate routine tasks and focus on strategy. The platform supports cloud, on-premises, or hybrid deployments. You can scale as your business grows.
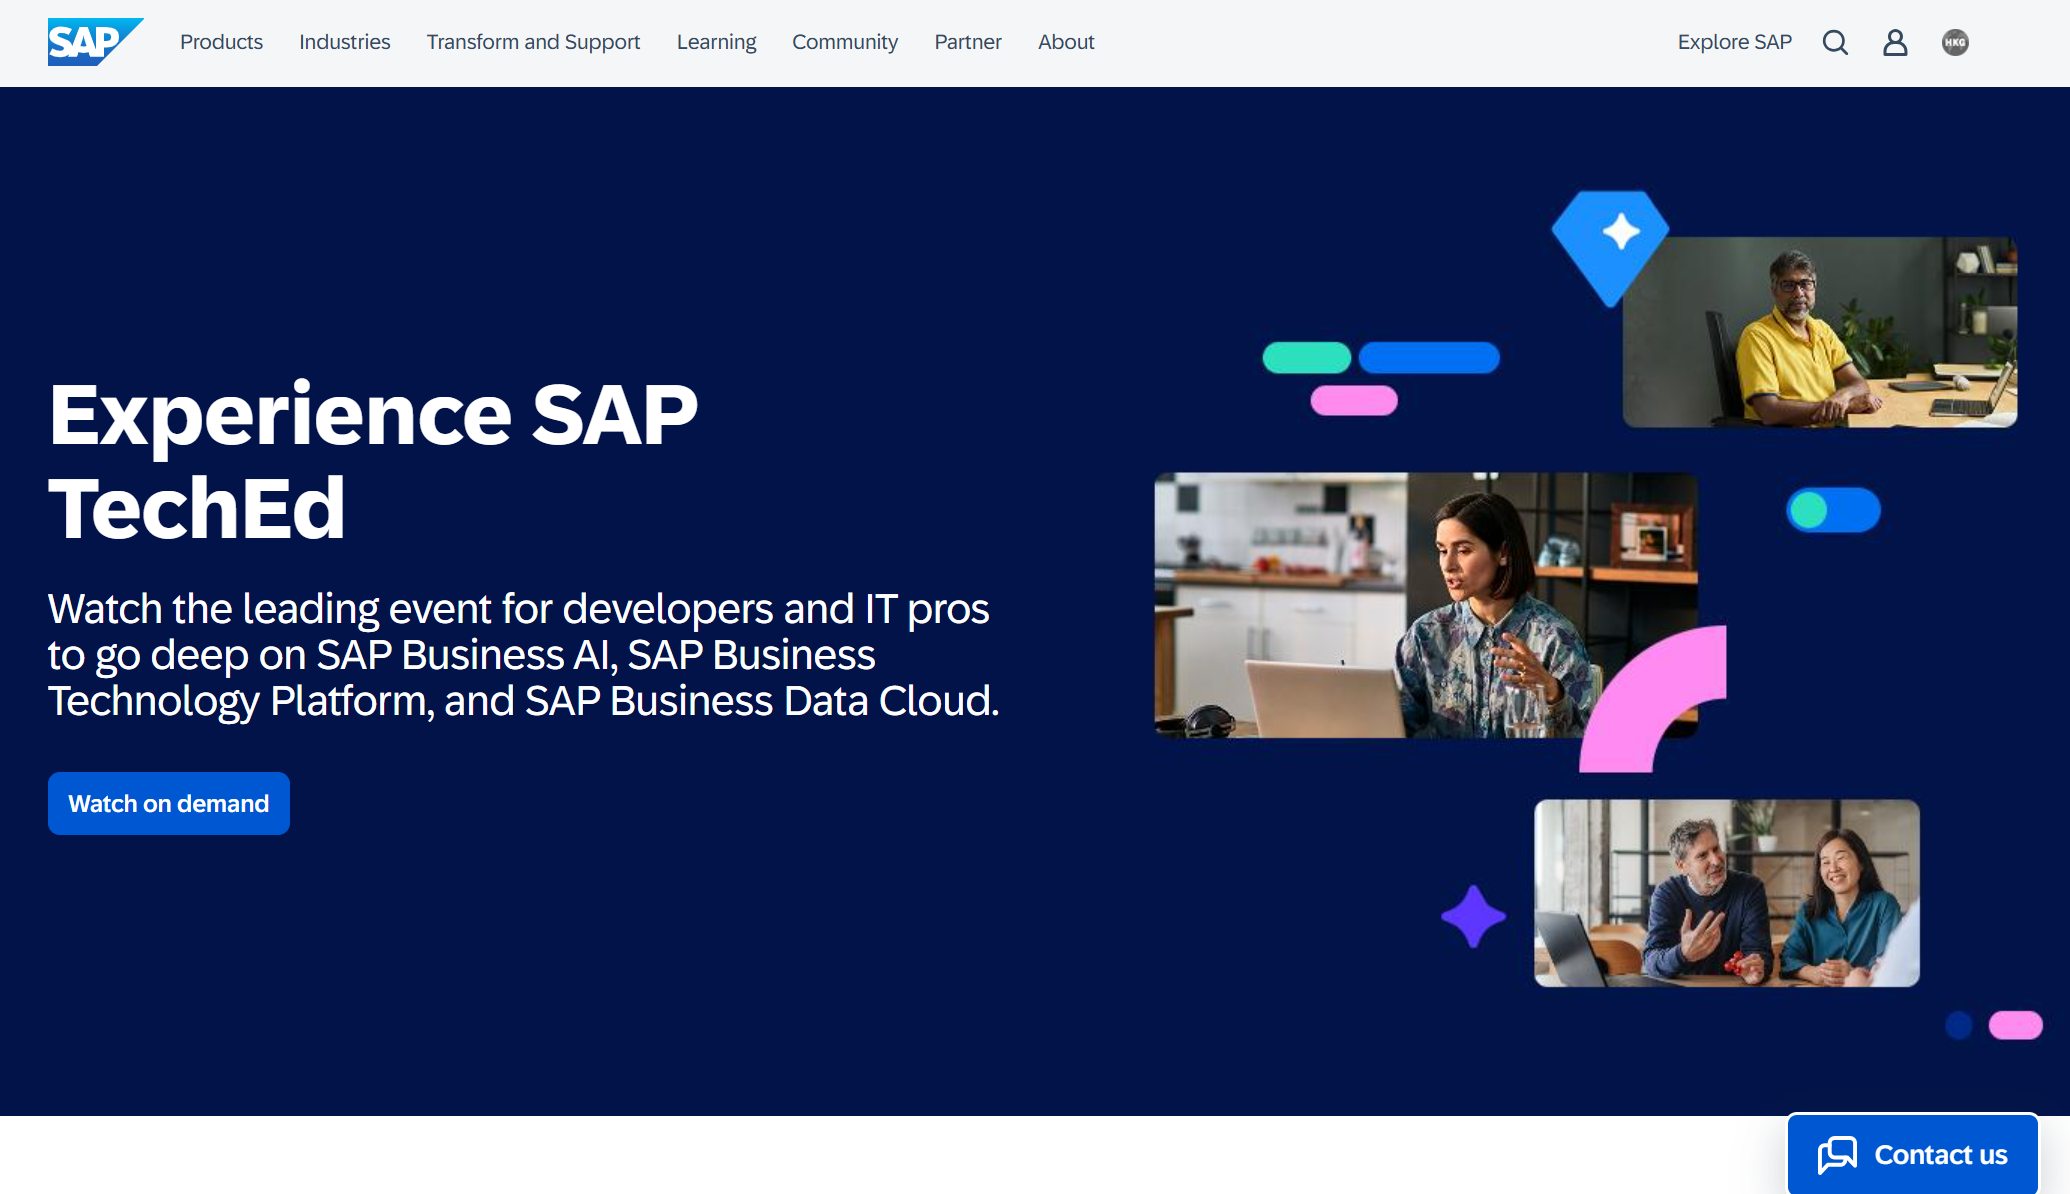
Website: https://www.sap.com/products/erp.html
Key features include:
You can use SAP S/4HANA in many industries. Manufacturers streamline production and inventory. Retailers manage supply chains and sales. Finance teams handle accounting and compliance. Public sector organizations track budgets and resources.
Common use cases:
Note: SAP S/4HANA helps you connect every part of your business, so you always have the full picture.
SAP S/4HANA uses a subscription or perpetual license model. Pricing depends on the modules, deployment type, and number of users. You’ll need to contact SAP or a certified partner for a custom quote. Many organizations choose SAP S/4HANA for its scalability and enterprise-grade features.
You get more than just an ERP with SAP S/4HANA. The platform integrates compliance and security, helping you meet regulatory requirements while boosting efficiency. This integration turns compliance into a strategic advantage, especially when you face complex regulations. SAP S/4HANA uses best practices for security—like access controls, continuous monitoring, and regular audits. You can meet standards such as GDPR and ISO/IEC 27001:2022. The system gives you actionable insights, so you can align your security with compliance needs. If you want a secure, future-ready ERP, SAP S/4HANA delivers.
Google Looker is a modern data platform that helps you explore, analyze, and share real-time business insights. You can connect Looker to almost any data source. The platform uses LookML, a modeling language, to create a single source of truth for your data. You get interactive dashboards, custom reports, and advanced analytics—all in one place.
Looker works in the cloud, so you can scale up as your business grows. You can collaborate with your team and share insights instantly. The platform supports embedded analytics, letting you add dashboards to your own apps or websites.
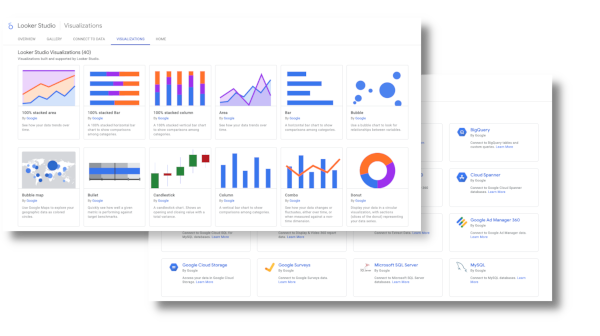
Website: https://lookerstudio.google.com/navigation/reporting
Key features include:
You can use Looker in marketing, sales, operations, and more. Marketing teams track campaign performance. Sales teams monitor pipelines and forecasts. Operations teams watch inventory and logistics. You can blend data from different sources and see everything in one view.
Some ways you might use Looker:
Tip: Looker makes it easy to turn raw data into clear, actionable insights for your whole team.
Google Looker uses a custom pricing model. You pay based on the number of users, data volume, and features you need. You’ll need to contact Google Cloud sales for a personalized quote. Looker offers demos and trials so you can test the platform before you decide.
Looker stands out for its flexible integration options. You can connect to a wide range of data sources using built-in, partner, and community connectors. Here’s a quick look:
| Connector Type | Examples |
|---|---|
| Google connectors | BigQuery, Google Ads, Google Analytics, Google Sheets |
| Partner connectors | Meta Ads, LinkedIn, HubSpot, Supermetrics, Funnel.io |
| Community connectors | User-created connectors for other data sources |
You can also connect Looker to platforms like Github, Salesforce, Zendesk, and Snowflake. Integrating Looker with Google Cloud gives you near-real-time analytics and instant queries on large datasets. The unified data modeling ensures everyone works from the same numbers. If you want a scalable, flexible analytics platform, Looker is a top pick.
Infor CloudSuite gives you a complete set of software development management tools designed for modern industries. You get cloud-based applications that cover everything from finance to supply chain to project management. The platform uses AI to automate routine tasks and deliver smart recommendations. You can connect data from different departments and see your business in one place. Infor CloudSuite supports real-time analytics, so you always know what’s happening.
Website: https://www.infor.com/en-sg/products/cloud-strategy
Key features include:
You can customize dashboards and reports to fit your needs. The platform grows with your business, making it a strong choice for companies that want to scale.
You can use Infor CloudSuite in many industries. Manufacturers track production and manage inventory. Healthcare providers improve patient care and streamline operations. Distributors monitor supply chains and optimize logistics. Service companies manage projects and resources. You get software development management tools that fit your workflow, whether you run a small business or a global enterprise.
Here are some common scenarios:
Tip: Infor CloudSuite helps you break down silos and connect every part of your business.
Infor CloudSuite uses a subscription pricing model. You pay based on the modules you choose, the number of users, and your deployment type. You need to contact Infor or a certified partner for a custom quote. Many organizations find the investment worthwhile because they get a full suite of software development management tools tailored to their industry.
Infor CloudSuite stands out for its industry focus and flexibility. You get solutions built for your sector, not just generic tools. The platform’s AI-driven automation saves you time and reduces errors. You can scale up as your business grows, adding new modules or users when needed. Infor CloudSuite also offers strong security and compliance features, which is important if you work in regulated industries.
TIBCO Spotfire gives you powerful software development management tools for advanced analytics and business intelligence. You can create interactive dashboards that make data exploration easy. The platform supports ad-hoc analysis, so you can answer questions on the fly. Spotfire’s predictive analytics use machine learning to help you spot trends and act before problems arise.

Website:https://www.spotfire.com/
Here’s a quick look at what you get:
You don’t need to be a data scientist to use Spotfire. The interface feels friendly, and you can drag and drop your way to insights.
You can use TIBCO Spotfire in many ways. Manufacturers predict equipment failures before they happen. Retailers analyze customer behavior and optimize inventory. Healthcare teams monitor patient outcomes and improve care. Financial analysts forecast market trends and manage risk. You get software development management tools that adapt to your industry and your team.
Some common use cases:
Note: Spotfire’s machine learning features give you a strategic edge. You can act on insights before your competitors do.
TIBCO Spotfire uses a subscription model. Pricing depends on the number of users, features, and deployment options. You can choose cloud, on-premises, or hybrid setups. You need to contact TIBCO for a personalized quote. Many businesses start with a trial to see how Spotfire fits their needs.
Spotfire stands out for its advanced analytics and user-friendly design. You get predictive analytics, real-time event processing, and collaborative tools all in one platform. The software development management tools help you move from data to action quickly. Spotfire’s machine learning algorithms give you insights that drive smarter decisions. If you want a tool that combines power and simplicity, Spotfire delivers.
Here’s a table that highlights Spotfire’s top analytics features:
| Feature | Description |
|---|---|
| Predictive Analytics | Anticipate trends and risks with machine learning models |
| Real-time Event Processing | Get instant insights from live data streams |
| Collaborative Decision-Making | Share dashboards and insights for better teamwork |
| Interactive Dashboards | Explore data visually with easy-to-use dashboards |
| Ad-hoc Analysis | Answer questions on the fly without predefined queries |
| Data Discovery | Uncover insights through exploration and visualization |
| Statistical Analysis Tools | Use advanced tools for deep statistical analysis |
| Machine Learning Algorithms | Enhance predictions with AI-driven insights |
Choosing the right MIS tool can feel overwhelming. You want to see the differences quickly. This section gives you a clear side-by-side look at features, use cases, and pricing. Let’s break it down so you can pick the best fit for your business.
You probably want to know which tool does what. Here’s a handy table that shows the main features of each MIS tool. You can spot what matters most to you—like real-time dashboards, AI analytics, or mobile access.
| Tool | Real-Time Dashboards | AI/Automation | Data Integration | Mobile BI | Custom Reports | Security Controls |
|---|---|---|---|---|---|---|
| Microsoft Power BI | ✔️ | ✔️ | ✔️ | ✔️ | ✔️ | ✔️ |
| SAP BusinessObjects | ✔️ | ✔️ | ✔️ | ✔️ | ✔️ | ✔️ |
| Oracle NetSuite | ✔️ | ✔️ | ✔️ | ✔️ | ✔️ | ✔️ |
| Tableau | ✔️ | ✔️ | ✔️ | ✔️ | ✔️ | ✔️ |
| Zoho Analytics | ✔️ | ✔️ | ✔️ | ✔️ | ✔️ | ✔️ |
| IBM Cognos | ✔️ | ✔️ | ✔️ | ✔️ | ✔️ | ✔️ |
| Salesforce Einstein | ✔️ | ✔️ | ✔️ | ✔️ | ✔️ | ✔️ |
| Qlik Sense | ✔️ | ✔️ | ✔️ | ✔️ | ✔️ | ✔️ |
| Domo | ✔️ | ✔️ | ✔️ | ✔️ | ✔️ | ✔️ |
| Sisense | ✔️ | ✔️ | ✔️ | ✔️ | ✔️ | ✔️ |
| SAP S/4HANA | ✔️ | ✔️ | ✔️ | ✔️ | ✔️ | ✔️ |
| Google Looker | ✔️ | ✔️ | ✔️ | ✔️ | ✔️ | ✔️ |
| Infor CloudSuite | ✔️ | ✔️ | ✔️ | ✔️ | ✔️ | ✔️ |
| TIBCO Spotfire | ✔️ | ✔️ | ✔️ | ✔️ | ✔️ | ✔️ |
| FineReport | ✔️ | ✔️ | ✔️ | ✔️ | ✔️ | ✔️ |
Tip: Most top MIS tools cover the basics. Look for special features like 3D dashboards, advanced automation, or easy data entry if you want something extra.
Not every tool fits every job. Here’s a quick matrix to help you match tools to your needs. You can see which tools shine for different teams or industries.
| Tool | Best For | Common Industries |
|---|---|---|
| Power BI | Self-service BI, Microsoft shops | All, especially enterprise |
| SAP BusinessObjects | Enterprise reporting | Manufacturing, finance |
| Oracle NetSuite | All-in-one ERP | Retail, services, finance |
| Tableau | Visual analytics | Marketing, sales, education |
| Zoho Analytics | SMBs, fast setup | Retail, startups |
| IBM Cognos | Collaboration, compliance | IT, education, government |
| Salesforce Einstein | CRM analytics | Sales, service, marketing |
| Qlik Sense | Scalable analytics | Healthcare, retail, finance |
| Domo | Data integration, ETL | Operations, logistics |
| Sisense | Embedded analytics | SaaS, tech, healthcare |
| SAP S/4HANA | ERP, compliance | Manufacturing, public sector |
| Google Looker | Cloud analytics | Tech, e-commerce |
| Infor CloudSuite | Industry-specific solutions | Manufacturing, healthcare |
| TIBCO Spotfire | Predictive analytics | Energy, pharma, finance |
| FineReport | Custom reporting, dashboards | Manufacturing, finance, HR |
Note: If you need flexible reporting and easy integration, FineReport is a strong choice for many industries.
MIS tools use different pricing models. You might pay per user each month, pick a package based on features, or buy a license once and own it forever. Here’s a quick look at common pricing models:
| Pricing Model | Description |
|---|---|
| Per-User, Per-Month (SaaS) | You pay a recurring fee for each user. This gives you a low upfront cost and clear budgeting. |
| Tiered Subscription (Feature-Based) | You choose a package with the features you need. You pay a fixed price for each tier. |
| Per-Asset Pricing | You pay based on the number of assets managed. This often includes unlimited users. |
| Perpetual License | You pay once and own the software forever. This counts as a capital expense for your business. |
Most vendors offer free trials or demos. You can test before you commit. Always check for extra costs like support, training, or upgrades.
Tip: Think about your team size and how fast you plan to grow. The right pricing model can save you money as your needs change.
You want your data to flow smoothly from every corner of your business. That’s why data integration and ETL (Extract, Transform, Load) matter so much in any MIS tool. You need a system that brings together information from different sources—like databases, spreadsheets, and cloud apps—without a headache.
When you look for a data integration feature, keep these points in mind:
You also want your MIS tool to fit with your current systems. Compatibility, scalability, and strong performance keep your business running smoothly as you grow. A user-friendly interface and good vendor support make your life easier, especially when you run into questions.
You need to see your data in a way that makes sense. A great data visualization tool turns raw numbers into clear stories. With interactive dashboards, you can explore your business from every angle. You don’t just get static charts—you get tools that let you click, filter, and dig deeper.
Here’s why reporting and visualization features matter:
A good data visualization tool empowers everyone in your company. You don’t need to be a data scientist to find answers. You just need the right interactive dashboards to guide you.
Tip: Use interactive dashboards to keep your team informed and ready to act. The right visuals can turn confusion into clarity.
You want to save time and avoid mistakes. Automation and AI features in MIS tools help you do just that. You can set up workflows that run on their own, so you don’t have to repeat the same steps every day. AI can spot patterns in your data and even predict what might happen next.
With automation, you can:
AI features take things further. They help you find trends, forecast results, and make smarter choices. When you combine automation with interactive dashboards, you get a system that works for you—even when you’re not watching.
Note: Automation and AI free up your time for bigger ideas. Let your MIS tool handle the routine work while you focus on growth.
You want your business data to stay safe. Security and compliance features in MIS tools help you protect sensitive information and follow the rules. You can’t afford to ignore these areas. Data breaches and compliance failures can cost you money and trust.
Let’s break down what you should look for:
Note: Security isn’t just about technology. You need clear policies and regular training for your team. The best MIS tools make this easy.
Here’s a quick table to help you compare security features:
| Feature | Why It Matters |
|---|---|
| Access Controls | Only the right people see your data |
| Encryption | Keeps data safe from hackers |
| Audit Logs | Tracks changes and actions |
| Compliance Tools | Helps you follow the law |
| Backup & Recovery | Protects you from data loss |
You want peace of mind. Choose an MIS tool that puts security and compliance first.
Your business will grow. You need an MIS tool that grows with you. Scalability means the system can handle more users, more data, and more complex tasks as your needs change.
Here’s what to look for:
Tip: Start with what you need now, but think about where you want to be in two or five years. The right MIS tool will support your journey.
You don’t want to switch systems every time you grow. A scalable MIS tool saves you time, money, and headaches. You can focus on your business, not your software.
If you choose a tool like FineReport, you get both security and scalability. You can manage permissions, protect your data, and add new users or reports as your company grows. That’s how you stay ready for anything.

You want your data to work harder for you. AI-driven analytics in MIS tools make that happen. These systems use machine learning to spot patterns and trends you might miss. You get more than just numbers—you get smart suggestions that help you act fast.
You don’t need to be a data scientist. The system does the heavy lifting. You just focus on what matters most.
Tip: Use real-time analytics to stay ahead of the competition. Let AI handle the details while you make the big moves.
Imagine knowing what will happen next in your business. Predictive modeling in MIS tools gives you that power. You can use past data to forecast future events. This helps you plan better and avoid surprises.
You don’t have to guess anymore. The system shows you what’s likely to happen. You can act with confidence.
Note: Real-time analytics and predictive modeling work together. You get a clear view of today and a smart look at tomorrow.
You want to save time and cut down on mistakes. Automation in MIS tools helps you do both. You can set up workflows that run on their own. The system handles routine tasks while you focus on bigger goals.
Automation keeps your business running smoothly. You spend less time on manual work and more time on strategy.
Tip: Use real-time analytics and automation together. You get instant updates and smart actions, all in one place.
You want answers fast. Real-time data processing in MIS tools gives you that speed. You don’t have to wait for yesterday’s numbers or last week’s reports. With AI, your system grabs fresh data, analyzes it instantly, and shows you what’s happening right now.
Imagine you run a store. You see sales numbers update as customers check out. You spot trends as they happen. If inventory drops, you get an alert. You can react before you run out of stock. That’s the power of real-time data.
AI makes this even smarter. It doesn’t just collect data—it learns from it. Your MIS tool can spot unusual patterns, flag risks, and suggest actions. You get insights while events unfold, not after the fact.
Here’s how real-time data processing helps you:
Tip: Use real-time dashboards to keep your team in sync. Everyone sees the same numbers and can respond together.
Let’s look at some common scenarios:
| Scenario | Real-Time Benefit |
|---|---|
| Retail Sales | Spot bestsellers and adjust promotions |
| Manufacturing | Monitor equipment and prevent downtime |
| Finance | Track transactions and catch fraud early |
| Customer Service | Respond to feedback as it arrives |
You don’t need to be a tech expert. Modern MIS tools make real-time data easy. You set up dashboards, choose what to track, and let AI handle the heavy lifting.
Here are a few ways to get started:
🚀 Real-time data processing keeps your business agile. You stay ahead of problems and grab chances as soon as they appear.
Note: If you use a tool like FineReport, you get real-time dashboards, instant alerts, and seamless integration with your data sources. You empower your team to make smart moves every day.
You want to pick the right MIS tool, but where do you start? Begin by looking at what your business really needs. Every company is different. You might need a tool that grows with you, or maybe you want something simple and easy to use right now. Take a close look at your goals, your team, and your budget.
Here’s a handy table to help you think through the main criteria:
| Criteria | Description |
|---|---|
| Scalability | The system should accommodate future growth to avoid costly migrations later. |
| Budget Constraints | Determines whether to opt for enterprise-level solutions or open-source alternatives. |
| User-Friendliness | Affects employee adoption and the amount of training required. |
| Integration Capabilities | Ensures compatibility with existing systems to prevent data silos and workflow disruptions. |
| Needs Analysis | A thorough analysis helps identify the best-suited solution for the organization’s specific needs. |
Ask yourself a few questions. Do you plan to add more users soon? Will your data grow fast? If so, you need a tool that scales. Think about your budget. Some tools cost more up front, but others use a subscription model. User-friendliness matters, too. If your team finds the tool hard to use, they might avoid it. Make sure the tool works with your current systems. You don’t want to create new data silos. Finally, do a needs analysis. Write down what you want the tool to do. This step helps you find the best fit.
Tip: Involve your team in the decision. They know what works and what doesn’t in daily tasks.
Not every MIS tool fits every industry. You want a tool that understands your world. If you work in healthcare, you need strong privacy controls. If you’re in manufacturing, you want real-time tracking and inventory management. Retailers look for sales dashboards and customer insights. Financial services need compliance and audit features.
Many top MIS tools offer industry-specific modules. These modules come with templates, reports, and dashboards built for your field. You save time because you don’t have to build everything from scratch. You also get features that match your daily challenges.
Make a list of your industry’s must-haves. Check if the tool supports those needs out of the box. If you see your industry listed in the tool’s case studies or customer stories, that’s a good sign.
You want your MIS tool to match how your team works. Maybe your company uses Agile, Scrum, or Kanban. Some teams like strict processes, while others want flexibility. The best MIS tools let you customize workflows. You can set up dashboards, reports, and alerts that fit your style.
Think about your daily routines. Do you need automated reports every morning? Do you want alerts for key metrics? Pick a tool that adapts to your workflow, not the other way around.
Note: Test the tool with a small team first. See if it fits your methods before rolling it out to everyone.
Choosing the right MIS tool means looking at your needs, your industry, and your workflow. Take your time. The right choice will help your business grow and make your team’s job easier.
You want your MIS tool to do more than just work—it should help your business grow. That’s where vendor support and a strong ecosystem come in. When you pick a tool, you’re not just buying software. You’re joining a community and getting access to resources that can make your journey smoother.
Why does vendor support matter?
You might run into questions or need help with setup. Good support means you get answers fast. You can avoid long downtimes and keep your team moving. Some vendors offer 24/7 help, while others have online forums or detailed guides.
Here’s what to look for in vendor support:
Tip: Ask for a demo or trial. Test the support team before you buy. See how fast they respond and how helpful they are.
The power of an ecosystem
A strong ecosystem means you get more value from your MIS tool. You can connect with partners, add plugins, or use third-party apps. This flexibility helps you customize the tool for your business.
Here’s a quick table to help you compare ecosystems:
| Feature | Why It Matters |
|---|---|
| Integration Partners | Connect with other tools you use |
| Marketplace Add-ons | Add features without custom coding |
| User Community | Learn from others and share ideas |
| Developer Resources | Build custom solutions if you need to |
| Events & Webinars | Stay updated and network |
You want a tool that fits into your workflow. A rich ecosystem means you can grow without switching systems. You can add new features as your needs change.
FanRuan’s Ecosystem Example
If you choose FineReport, you join a global network. FanRuan offers strong support, detailed guides, and a vibrant user community. You get regular updates and access to new features. The platform connects with hundreds of data sources and supports integration with other FanRuan products like FineBI and FineDataLink. You can find case studies, webinars, and expert advice to help you succeed.
Note: Don’t just look at the tool. Check the support and ecosystem behind it. The right partner helps you get the most from your investment.

When you choose a management information system, you want to know your data is safe and your business stays on the right side of the law. Let’s break down what you need to know about security, compliance, and moving your data to a new system.
You handle a lot of sensitive information every day. Protecting that data is not just smart—it’s required by law in many industries. You need enterprise-grade security to keep customer details, financial records, and business secrets safe. Look for tools that offer strong encryption, user access controls, and regular security updates.
Tip: Always check if your MIS tool helps you meet rules like GDPR, HIPAA, or SOX. These laws protect your customers and your business.
Here’s a quick table to help you spot key privacy features:
| Feature | Why It Matters |
|---|---|
| Data Encryption | Keeps information private |
| Access Controls | Limits who can see what |
| Audit Logs | Tracks every action |
| Compliance Certifications | Shows the tool meets standards |
You want a system that makes following the rules easy. Enterprise-grade security should come built-in, not as an afterthought.
Switching to a new MIS tool can feel overwhelming. You don’t want to lose data or slow down your business. A good migration plan helps you move smoothly from your old system to your new one.
Here’s how you can make migration easier:
Note: Back up your data before you start. If something goes wrong, you can restore it quickly.
After you switch systems, you want help when you need it. Good support keeps your business running and your data protected. Look for vendors who offer 24/7 help, clear guides, and regular updates.
You should also join user communities or forums. Other users can share tips and help you solve problems faster. Regular training sessions keep your team sharp and ready for new features.
Remember, enterprise-grade security is not a one-time thing. You need updates, patches, and support to stay ahead of new threats. Pick a vendor who stands by you for the long haul.
Callout: The right MIS tool gives you peace of mind. You can focus on growing your business, knowing your data is safe and your systems are up to date.
Choosing the right MIS tool sets you up for success. You want advanced reporting and automation that makes your work easier. With data-driven decision-making, you can spot trends and act fast. FineReport and other top tools give you advanced reporting and automation for every department. You get data-driven decision-making that helps you grow. Try a demo or talk to an expert. Stay curious about new MIS and AI trends.
Remember, advanced reporting and automation and data-driven decision-making keep your business ahead.

The Author
Lewis Chou
Senior Data Analyst at FanRuan
Related Articles

10 Best Dashboard Reporting Tools for 2026 Compared: Power BI, Tableau, Looker Studio, and More
Dashboard reporting tools are software platforms that turn business data into interactive dashboards, scheduled reports, and decision ready insights.
Lewis Chou
Apr 27, 2026
How to create an HTML report from scratch in 2026
Build an html report from scratch in 2026 with easy steps, tools, and tips for customization, sharing, and making your data clear and interactive.
Lewis Chou
Mar 23, 2026
What Are the Main Types of Financial Statements and Their Examples
See the main types of financial statements with examples: balance sheet, income statement, cash flow, and equity statement.
Lewis Chou
Mar 23, 2026


