
Data Pulse
Data Analytics Statistics 2025: Market Size, Adoption, ROI, and Future Trends
Most organizations already collect more data than they can comfortably use. The real question in 2025 is no longer whether data matters, but how quickly teams can turn it into decisions.
That shift is reshaping the analytics market. Business intelligence platforms are moving to the cloud, AI-powered analytics is entering production, and more business teams are using dashboards, reports, and self-service tools to answer questions without waiting days for a new report.
This industry report summarizes the latest data analytics statistics across BI market growth, cloud analytics adoption, AI-powered analytics, workforce demand, ROI benchmarks, platform choices, industry use cases, and long-term market trends.

Executive summary
The analytics market is entering a more mature phase. Companies are no longer investing in BI only to create dashboards. They are using analytics to improve planning, reduce reporting delays, monitor operations, and support faster business decisions.
Several trends define the market in 2025:
-
BI spending continues to rise. MarketsandMarkets forecast the business intelligence market to reach USD 33.3 billion by 2025, while Mordor Intelligence estimates the market at USD 41.16 billion in 2026.
-
Cloud has become the main deployment direction for analytics. Mordor Intelligence reports that cloud deployment accounted for 65.87% of BI market revenue in 2025.
-
AI-powered analytics is moving from experimentation into production. Strategy's 2025 AI+BI survey found that 43% of organizations are using AI-powered analytics in production.
-
Analytics ROI remains a strong business case. Nucleus Research found that analytics returned USD 13.01 for every USD 1 spent across reviewed deployments.
-
Analytics talent remains in short supply. The U.S. Bureau of Labor Statistics reports that data scientist employment is projected to grow 34% from 2024 to 2034.
-
Data visualization continues to grow because decision-makers need information they can act on quickly. 360iResearch data listed by Global Information estimates the data visualization tools market at USD 9.29 billion in 2025.
Key findings
-
Analytics is becoming operational infrastructure. Teams are using analytics not only for retrospective reporting, but also for planning, forecasting, monitoring, and daily decision-making.
-
Cloud deployment is now the center of gravity. As enterprise data moves to cloud environments, analytics platforms are following the same path.
-
AI is changing the user experience of analytics. Instead of only building static dashboards, teams are starting to use AI to summarize changes, surface anomalies, and support natural language questions.
-
Self-service BI is expanding access. Business users increasingly expect to explore metrics, filter dashboards, and answer recurring questions without relying on IT for every request.
-
ROI depends on workflow fit. Analytics produces stronger returns when it is connected to decisions such as pricing, staffing, inventory, sales forecasting, customer retention, or campaign allocation.
-
Tool choice is becoming more specialized. Companies need to distinguish between analysis tools, reporting tools, visualization tools, data warehouses, and AI platforms instead of treating all analytics software as the same category.
For deeper context, these related guides explain the main concepts behind the statistics:
- Data analytics tools
- Business intelligence
- Business intelligence tools
- Business intelligence dashboards
- Self-service analytics
- Analytics dashboards
Data analytics market overview
The analytics market is broad, and market size varies by definition. Some reports measure business intelligence. Others measure business analytics, data analytics, AI analytics, or data visualization software.
For enterprise buyers, the BI market is a useful benchmark because it covers the tools companies use for dashboards, reporting, metrics, data exploration, and decision support.
-
MarketsandMarkets forecast the business intelligence market to grow from USD 23.1 billion in 2020 to USD 33.3 billion by 2025, at a 7.6% CAGR.
-
Mordor Intelligence estimates the BI market at USD 41.16 billion in 2026 and projects it to reach USD 62.38 billion by 2031, at an 8.67% CAGR.
-
Software and platforms captured 68.73% of BI market size in 2025, while services are expanding at a 9.23% CAGR through 2031, according to Mordor Intelligence.
-
Subscription and SaaS licensing generated 60.13% of BI revenue in 2025, showing that analytics buying continues to move away from perpetual licenses and toward recurring software models.
-
Banking, financial services, and insurance represented 22.74% of BI revenue in 2025, while retail and e-commerce are projected to grow at a 10.21% CAGR through 2031.
The market signal is clear: companies are buying faster access to trusted data. Traditional monthly reporting is not enough for teams that need to monitor customers, inventory, revenue, campaign ROI, and operational risk while the business is still moving.
AI and cloud analytics adoption
Cloud changed where business data lives. AI is changing who can use it.
Cloud analytics gives companies a flexible way to store, process, and share data across teams. AI-powered analytics adds another layer by helping users spot patterns, explain anomalies, ask questions in natural language, and summarize performance changes faster.
-
Forrester reports that enterprise data and analytics decision-makers stored an average of 62% of their organization's data in the cloud in 2025.
-
Cloud deployment accounted for 65.87% of BI revenue in 2025, according to Mordor Intelligence.
-
Strategy's 2025 AI+BI survey found that 43% of organizations are using AI-powered analytics in production.
-
The same survey found that 56% of organizations cite improved decision-making as their top goal for AI-powered analytics.
-
Only 8% of employees in most firms currently use advanced analytics tools, but 24% of organizations plan to triple that number within 12 months, according to Strategy's survey.
The takeaway: analytics is becoming less dependent on specialist teams. With self-service analytics, business users can explore metrics, build dashboards, and answer recurring questions without waiting for every report to come from IT.
Regional data analytics trends
Regional analytics adoption depends on cloud maturity, digital infrastructure, regulation, talent availability, and industry mix. A bank in Europe, a retailer in North America, and a manufacturer in Asia-Pacific may all need analytics, but they will not roll it out in exactly the same way.
-
North America remains the largest BI market. Mordor Intelligence reports that North America captured 39.85% of BI revenue in 2025.
-
Asia-Pacific is expected to grow the fastest, with Mordor Intelligence projecting a 10.12% CAGR through 2031.
-
Europe continues to invest in analytics with a strong focus on privacy, governance, compliance, and trusted reporting.
-
The Middle East and Africa are gaining momentum through smart-city programs, telecom modernization, and public-sector digital transformation.
-
Latin America is seeing more analytics adoption in finance, retail, logistics, and digital services, though infrastructure differences and currency volatility can slow large-scale projects.
The regional implication is that analytics demand is global, but implementation remains local. Data residency, language, privacy rules, cloud availability, and local partners all affect how BI programs scale.
Data analytics workforce statistics
Analytics growth depends on people as much as software. Companies need data scientists, BI analysts, analytics engineers, data engineers, dashboard designers, governance owners, and business users who know how to interpret metrics correctly.
-
The U.S. Bureau of Labor Statistics reports that data scientists earned a USD 112,590 median annual wage in 2024.
-
BLS projects data scientist employment to grow 34% from 2024 to 2034, much faster than the average for all occupations.
-
BLS reports that data scientists held about 245,900 jobs in 2024.
-
BLS projects about 23,400 openings for data scientists each year, on average, over the 2024 to 2034 decade.
For enterprises, the workforce challenge is not only hiring more data experts. It is also helping non-technical teams ask better questions, define trustworthy metrics, and turn analysis into action. This is why many organizations are investing in KPI dashboards, governed data models, and data literacy programs.
Data visualization and dashboard trends
Dashboards and visualization tools turn data into something people can use. A database can store the truth, but a good dashboard helps a manager see what changed, where to look next, and what needs attention.
-
360iResearch data listed by Global Information estimates the data visualization tools market at USD 9.29 billion in 2025.
-
The same source forecasts the market to reach USD 17.04 billion by 2032, at an 8.98% CAGR.
-
Visualization tools are shifting from static charts to interactive, AI-assisted, real-time, and embedded analytics experiences.
-
Business teams increasingly expect dashboards to include filters, drill-downs, alerts, natural language search, and mobile access.
-
Effective dashboard design matters because a poorly structured dashboard can hide the most important signals even when the data is accurate.
In practice, visualization is not decoration. It is part of the decision system. Teams can use dashboard examples to plan executive dashboards, sales dashboards, finance dashboards, operations dashboards, and customer analytics dashboards before they build.
Data analytics ROI and business impact
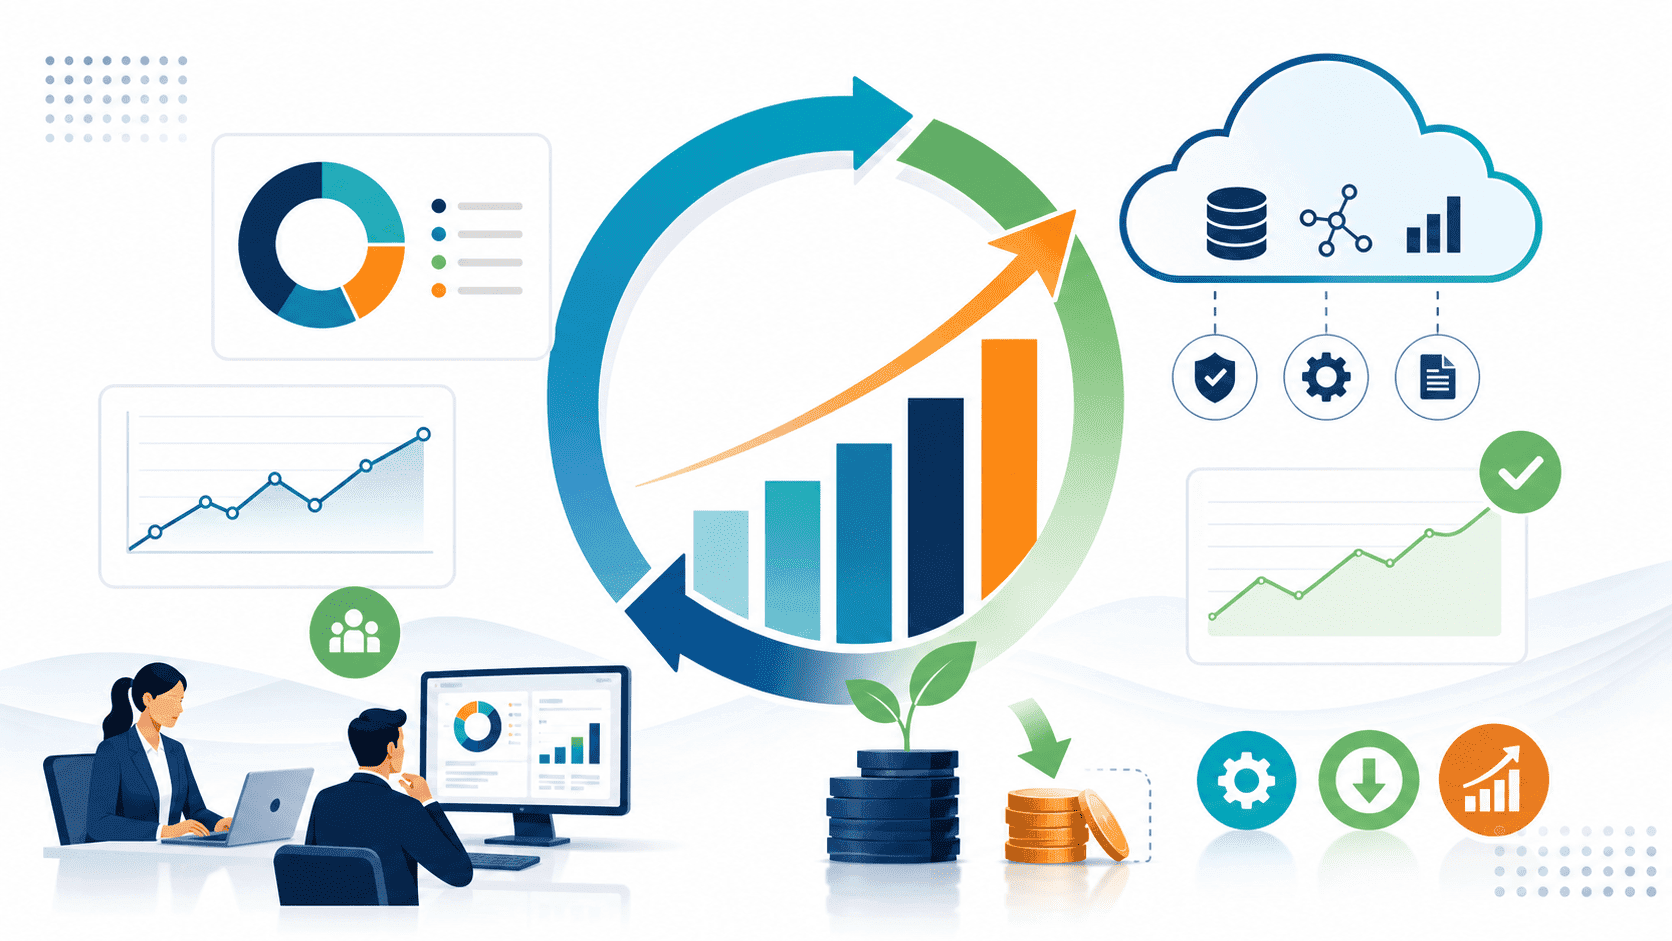
Analytics ROI usually comes from four places: faster decisions, less manual reporting, better revenue allocation, and lower operational waste.
-
Nucleus Research found that analytics returned USD 13.01 for every USD 1 spent across reviewed deployments.
-
Nucleus attributed this return to more usable analytics solutions, cloud deployment, collaboration, security, mobility, and demand for faster decision-making.
-
BI platforms can reduce manual reporting work by replacing spreadsheet consolidation with governed dashboards and scheduled report distribution.
-
Revenue impact can come from better segmentation, pricing analysis, churn prediction, campaign attribution, and sales pipeline visibility.
-
Cost impact can come from supply chain optimization, inventory control, process monitoring, fraud detection, and lower report maintenance.
The business implication is straightforward: analytics creates the most value when it is tied to a decision. A dashboard that only tracks metrics may improve visibility. A dashboard that changes pricing, staffing, inventory, or campaign allocation can create measurable financial return.
Platform and tool comparison
There is no single best analytics tool for every company. The right choice depends on use case, data maturity, governance needs, deployment model, and the systems a team already uses.
If your team mainly tracks website traffic, campaign performance, and digital conversion, Google Analytics is usually the starting point.
If your company already runs on Microsoft 365, Azure, Excel, and Fabric, Microsoft Power BI is often the easiest BI platform to adopt.
If your team cares most about visual exploration and interactive dashboards, Tableau remains one of the strongest options.
If consistent metric definitions matter across departments, Looker is a strong fit because of its governed semantic modeling approach.
If users need flexible discovery across connected data sources, Qlik is useful for associative analytics and exploration.
If the priority is scalable cloud data storage, Snowflake is often used as the data foundation behind analytics workloads.
If the priority is data engineering, AI, machine learning, and lakehouse workloads, Databricks is a strong fit.
If the organization needs advanced analytics and statistical modeling in a regulated environment, SAS remains common in finance, healthcare, government, and other complex modeling contexts.
Where FanRuan fits:
FanRuan is strongest when companies need more than one analytics layer. FineBI supports self-service analysis, FineReport handles enterprise reporting and scheduled distribution, and FineVis helps teams build large-screen dashboards and visual command centers.
Teams comparing tools should separate three needs: analysis, reporting, and presentation. Data analysis tools help users explore and model data. Reporting tools help teams distribute governed information. Data visualization tools help teams communicate trends, outliers, and performance changes clearly.
For teams evaluating Microsoft and Tableau specifically, this Power BI vs Tableau comparison can help frame the tradeoffs.
Industry use cases
Analytics creates value differently across industries. The best analytics programs do not start with a generic dashboard. They start with a business decision that happens again and again.
-
Manufacturing teams use analytics for production monitoring, quality control, downtime analysis, capacity planning, and supply chain analytics.
-
Finance teams use analytics for revenue reporting, cost control, cash flow visibility, risk monitoring, and finance dashboards.
-
Healthcare organizations use analytics for patient flow, resource utilization, care quality, compliance reporting, and healthcare dashboards.
-
Retail companies use analytics for sales performance, inventory movement, promotion planning, customer segmentation, and retail dashboards.
-
Marketing teams use analytics for campaign attribution, lead quality, conversion rate, customer lifecycle reporting, and marketing dashboards.
-
Sales teams use analytics for pipeline visibility, forecast accuracy, territory performance, rep activity, and sales dashboards.
The common pattern is that analytics becomes valuable when it fits a repeatable workflow, such as a weekly sales review, a daily operations standup, a monthly finance close, a campaign optimization cycle, or an executive performance review.
Future trends from 2026 to 2035

The next phase of analytics will be shaped by AI, cloud economics, governance, real-time decision-making, and privacy-preserving data collaboration.
-
Precedence Research forecasts the global data analytics market to grow from USD 83.79 billion in 2026 to USD 785.62 billion by 2035, at a 28.35% CAGR.
-
AI-augmented analytics will increasingly become a standard BI capability, helping users generate charts, explain anomalies, ask natural language questions, and summarize performance changes.
-
Real-time analytics will matter more in industries where delayed insight creates financial or operational risk, including retail, finance, manufacturing, logistics, and digital services.
-
Data governance will become more important as companies use analytics outputs in AI models, executive decisions, regulatory reporting, and customer-facing products.
-
Privacy-preserving analytics, data clean rooms, and federated learning will become more relevant as companies seek insight without moving sensitive raw data unnecessarily.
-
Sustainability analytics will become a recurring dashboard category as companies track energy use, carbon emissions, resource efficiency, and ESG reporting requirements.
The long-term outlook is not simply about having more data. The next stage of analytics is about faster access, stronger governance, and more people across the business being able to use data safely.
How to calculate analytics ROI
Analytics ROI can be estimated with a simple formula:
Analytics ROI (%) = (Financial gain from analytics - Analytics investment cost) / Analytics investment cost x 100
For example, if a company invests USD 100,000 in analytics and generates USD 1,301,000 in measurable value, the calculation is:
Analytics ROI = (1,301,000 - 100,000) / 100,000 x 100
Analytics ROI = 1,201%
This means the company generated USD 12.01 in net return for every USD 1 invested, or USD 13.01 in gross return for every USD 1 invested.
When calculating analytics ROI, include both direct and indirect gains:
- Direct revenue gains from better conversion, pricing, retention, upsell, or sales forecasting.
- Direct cost savings from automation, reduced manual reporting, lower tool duplication, and process improvement.
- Risk reduction from fraud detection, compliance monitoring, inventory alerts, and anomaly detection.
- Productivity gains from faster reporting cycles, fewer ad hoc requests, and less time spent reconciling spreadsheets.
Methodology
This article consolidates public market research pages, analyst report summaries, workforce data, and vendor-neutral research notes available at the time of writing. Because market definitions vary, this article separates business intelligence, data analytics, data visualization, cloud analytics, and AI-powered analytics where possible.
The figures should be read as directional benchmarks, not as a single unified market model. For procurement, investor research, or board reporting, use the original linked reports and confirm whether each source defines the market as BI, business analytics, data analytics, AI analytics, or visualization software.
Sources
The sources below were used for market sizing, adoption benchmarks, workforce data, and ROI references. Market definitions vary by source, so figures should be read as directional benchmarks rather than a single unified market model.
- MarketsandMarkets via PRNewswire - Business Intelligence Market worth USD 33.3 billion by 2025
- Mordor Intelligence - Business Intelligence Market Size and Share Analysis, 2026 to 2031
- Forrester - More Than Half Of Enterprise Data Is In The Cloud
- Forrester - The State Of Data And Analytics, 2025
- Gartner - Magic Quadrant for Analytics and Business Intelligence Platforms, 2025
- IDC MarketScape excerpt - Worldwide Business Intelligence and Analytics Platforms 2025 Vendor Assessment
- Strategy - The State of AI+BI Analytics Global 2025 Report
- Nucleus Research - Analytics pays back USD 13.01 for every dollar spent
- U.S. Bureau of Labor Statistics - Data Scientists Occupational Outlook Handbook
- Global Information / 360iResearch - Data Visualization Tools Market, 2025 to 2032
- Precedence Research via GlobeNewswire - Data Analytics Market Forecasted to Reach USD 785.62 Billion by 2035
Got questions? Ping me on Linkedin.

Article by
Louie Sun
Data Trend Strategist & Writer
Louie Sun is a data trend strategist and writer focused on how emerging signals in search, social behavior, and product adoption reveal where markets are moving next. Her work helps founders, marketers, and product teams separate short-lived hype from meaningful shifts in demand.
