

What is a Report?
Why Are Reports Important?
In today's data-driven environment, businesses generate enormous amounts of information every day. Without effective reporting systems, valuable insights remain hidden in spreadsheets, databases, and disconnected applications.
Modern reporting solutions help organizations:
- Gain real-time visibility into business performance
- Reduce manual reporting workloads
- Improve operational efficiency
- Increase reporting accuracy and consistency
- Accelerate strategic decision-making
- Ensure regulatory and compliance reporting requirements
Dashboards vs. Reports
Dashboards and reports are complementary, not interchangeable. Understanding their differences ensures you use the right tool for each business need.
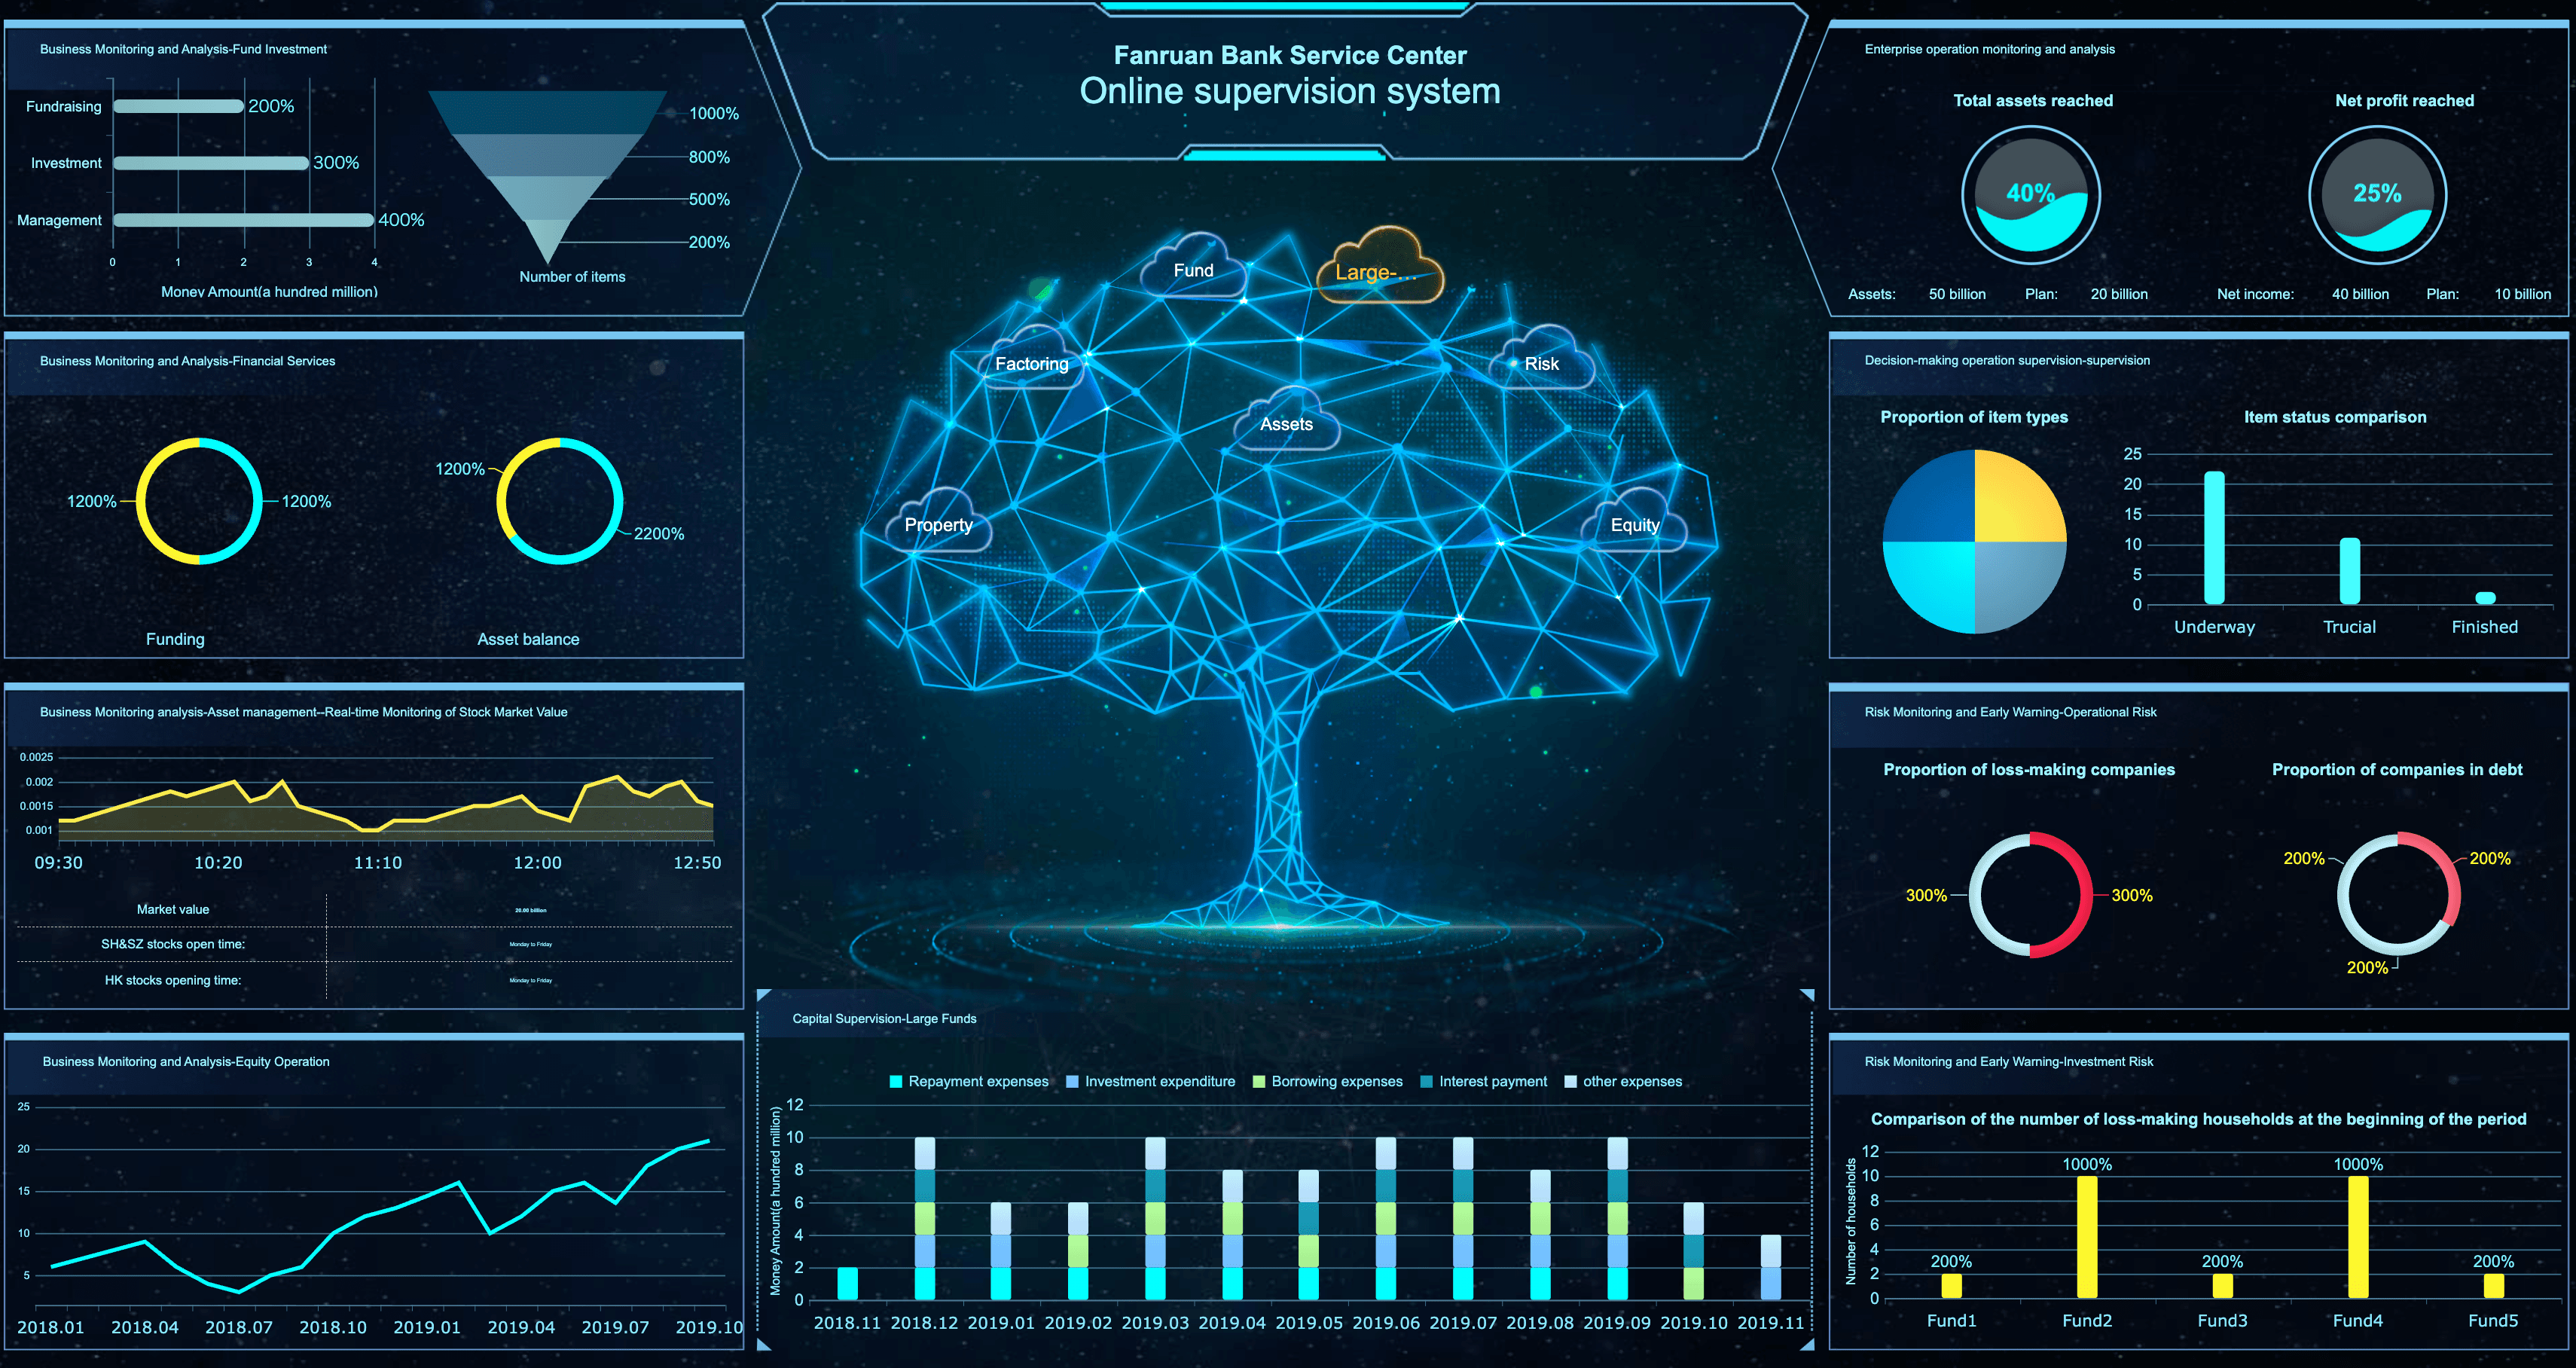
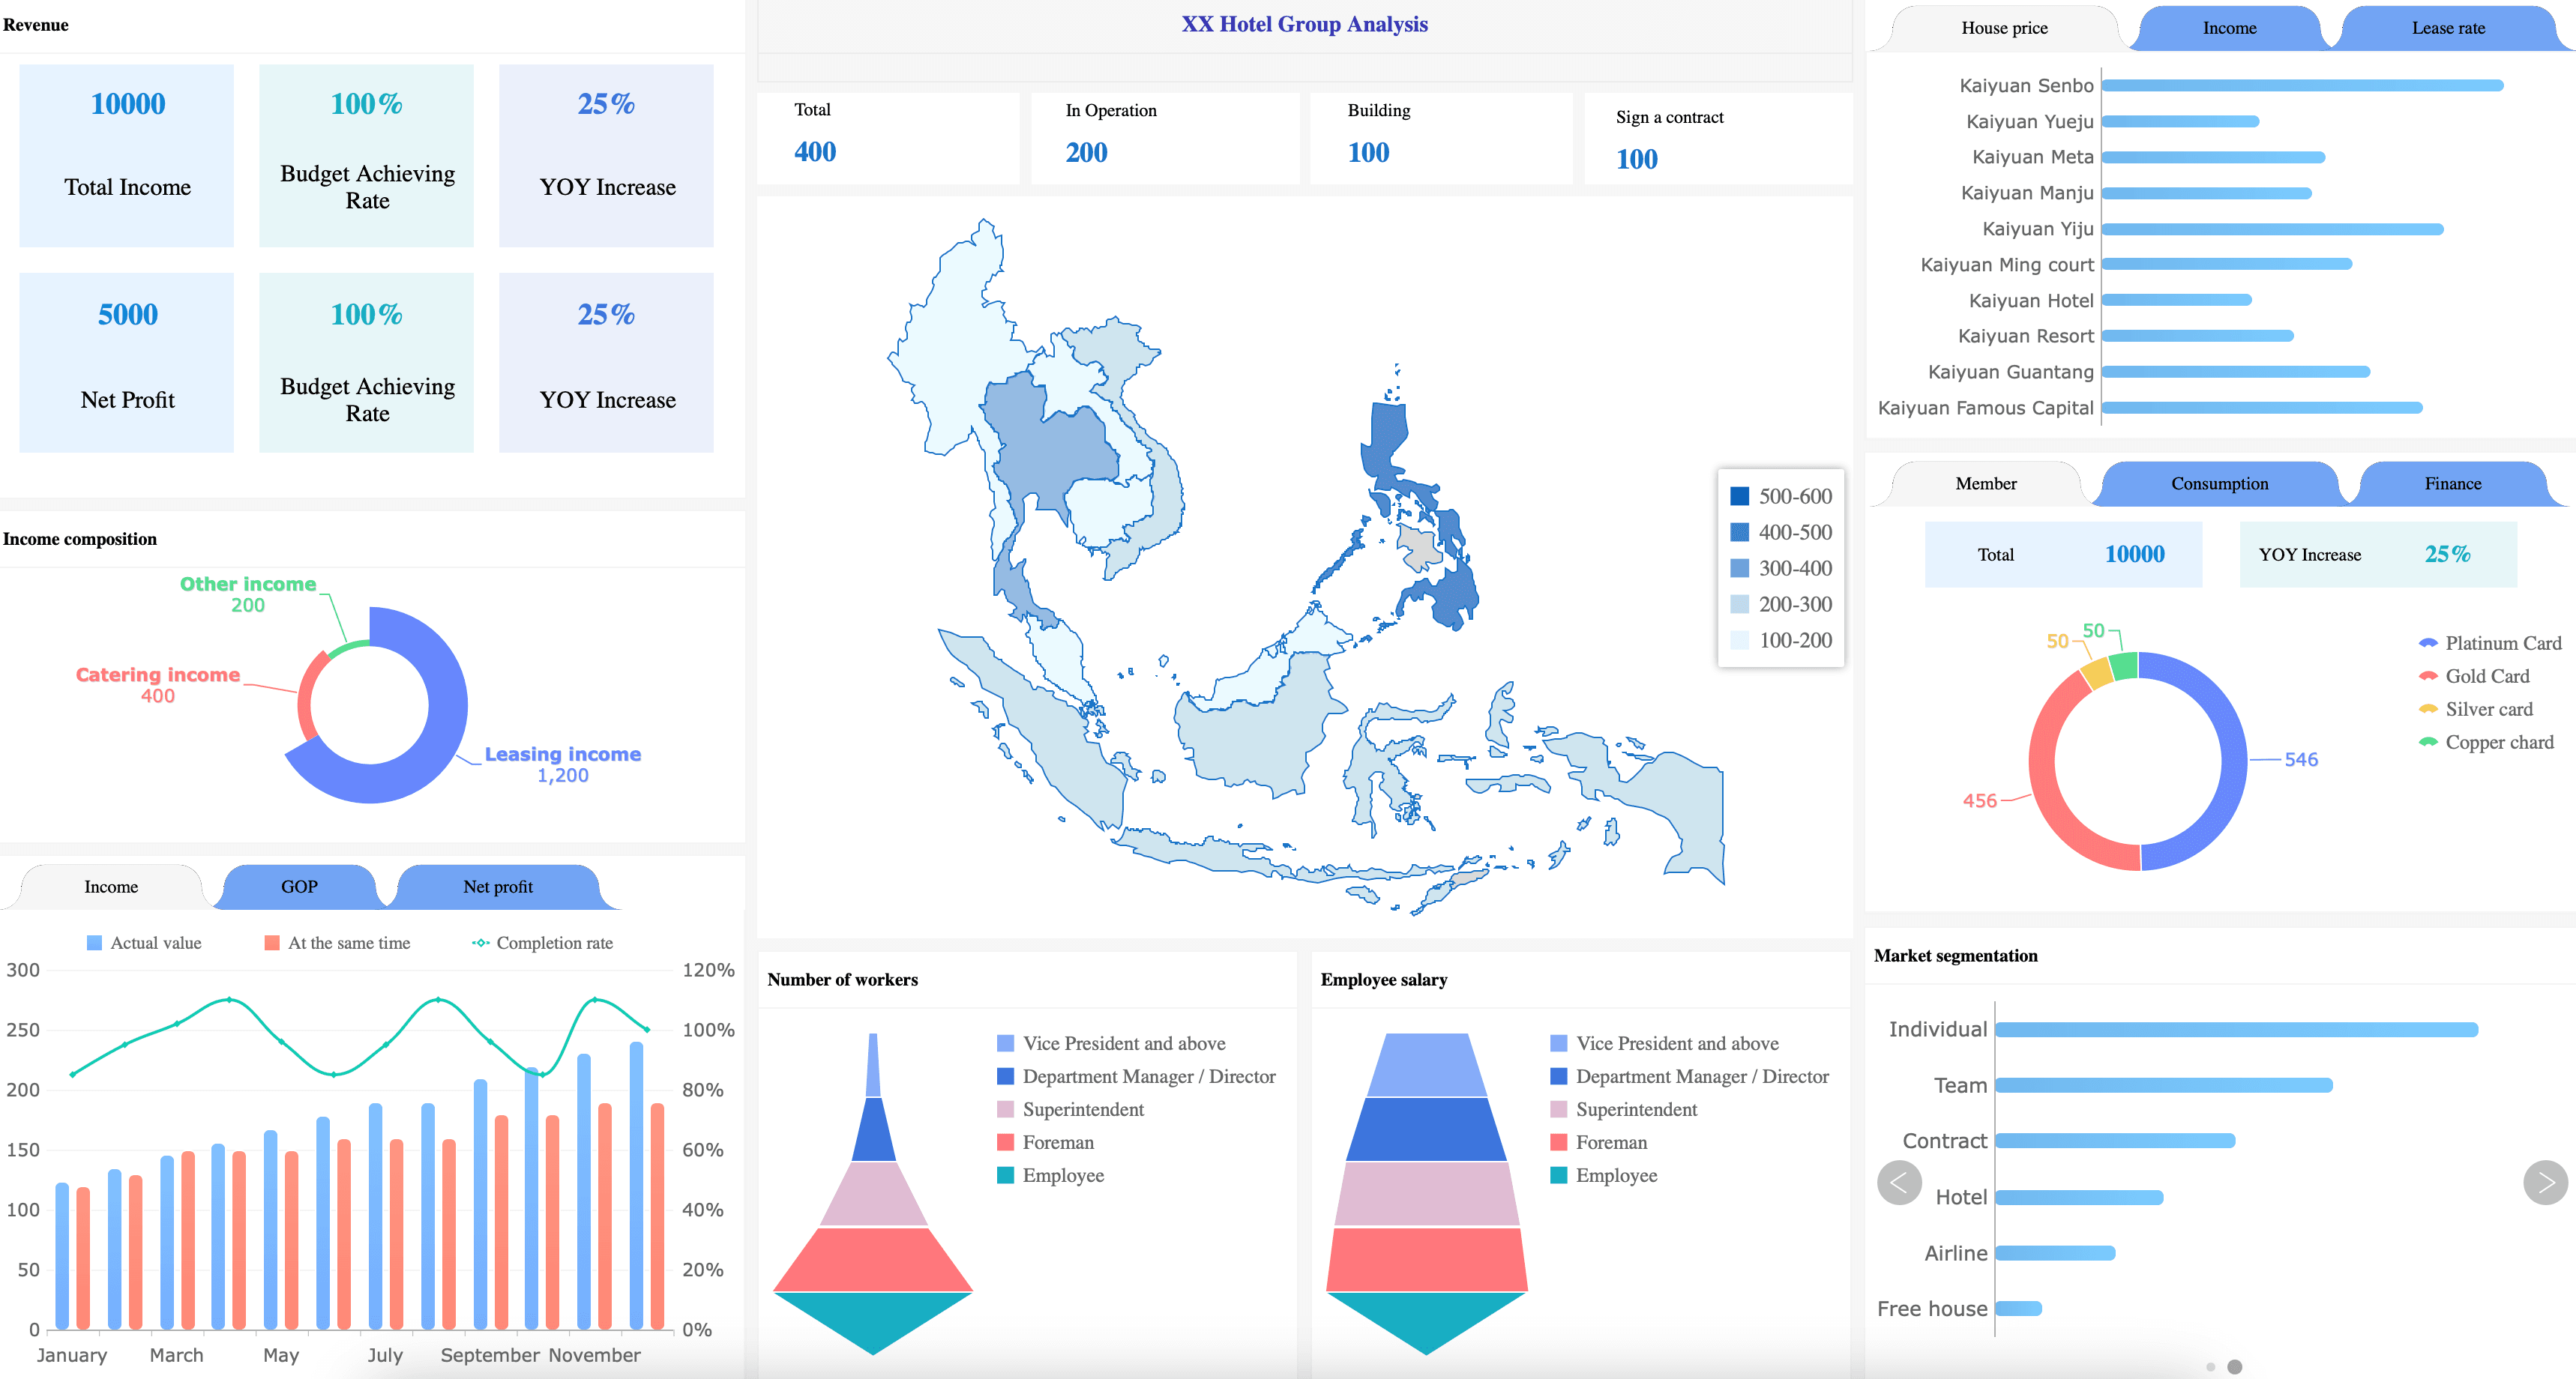
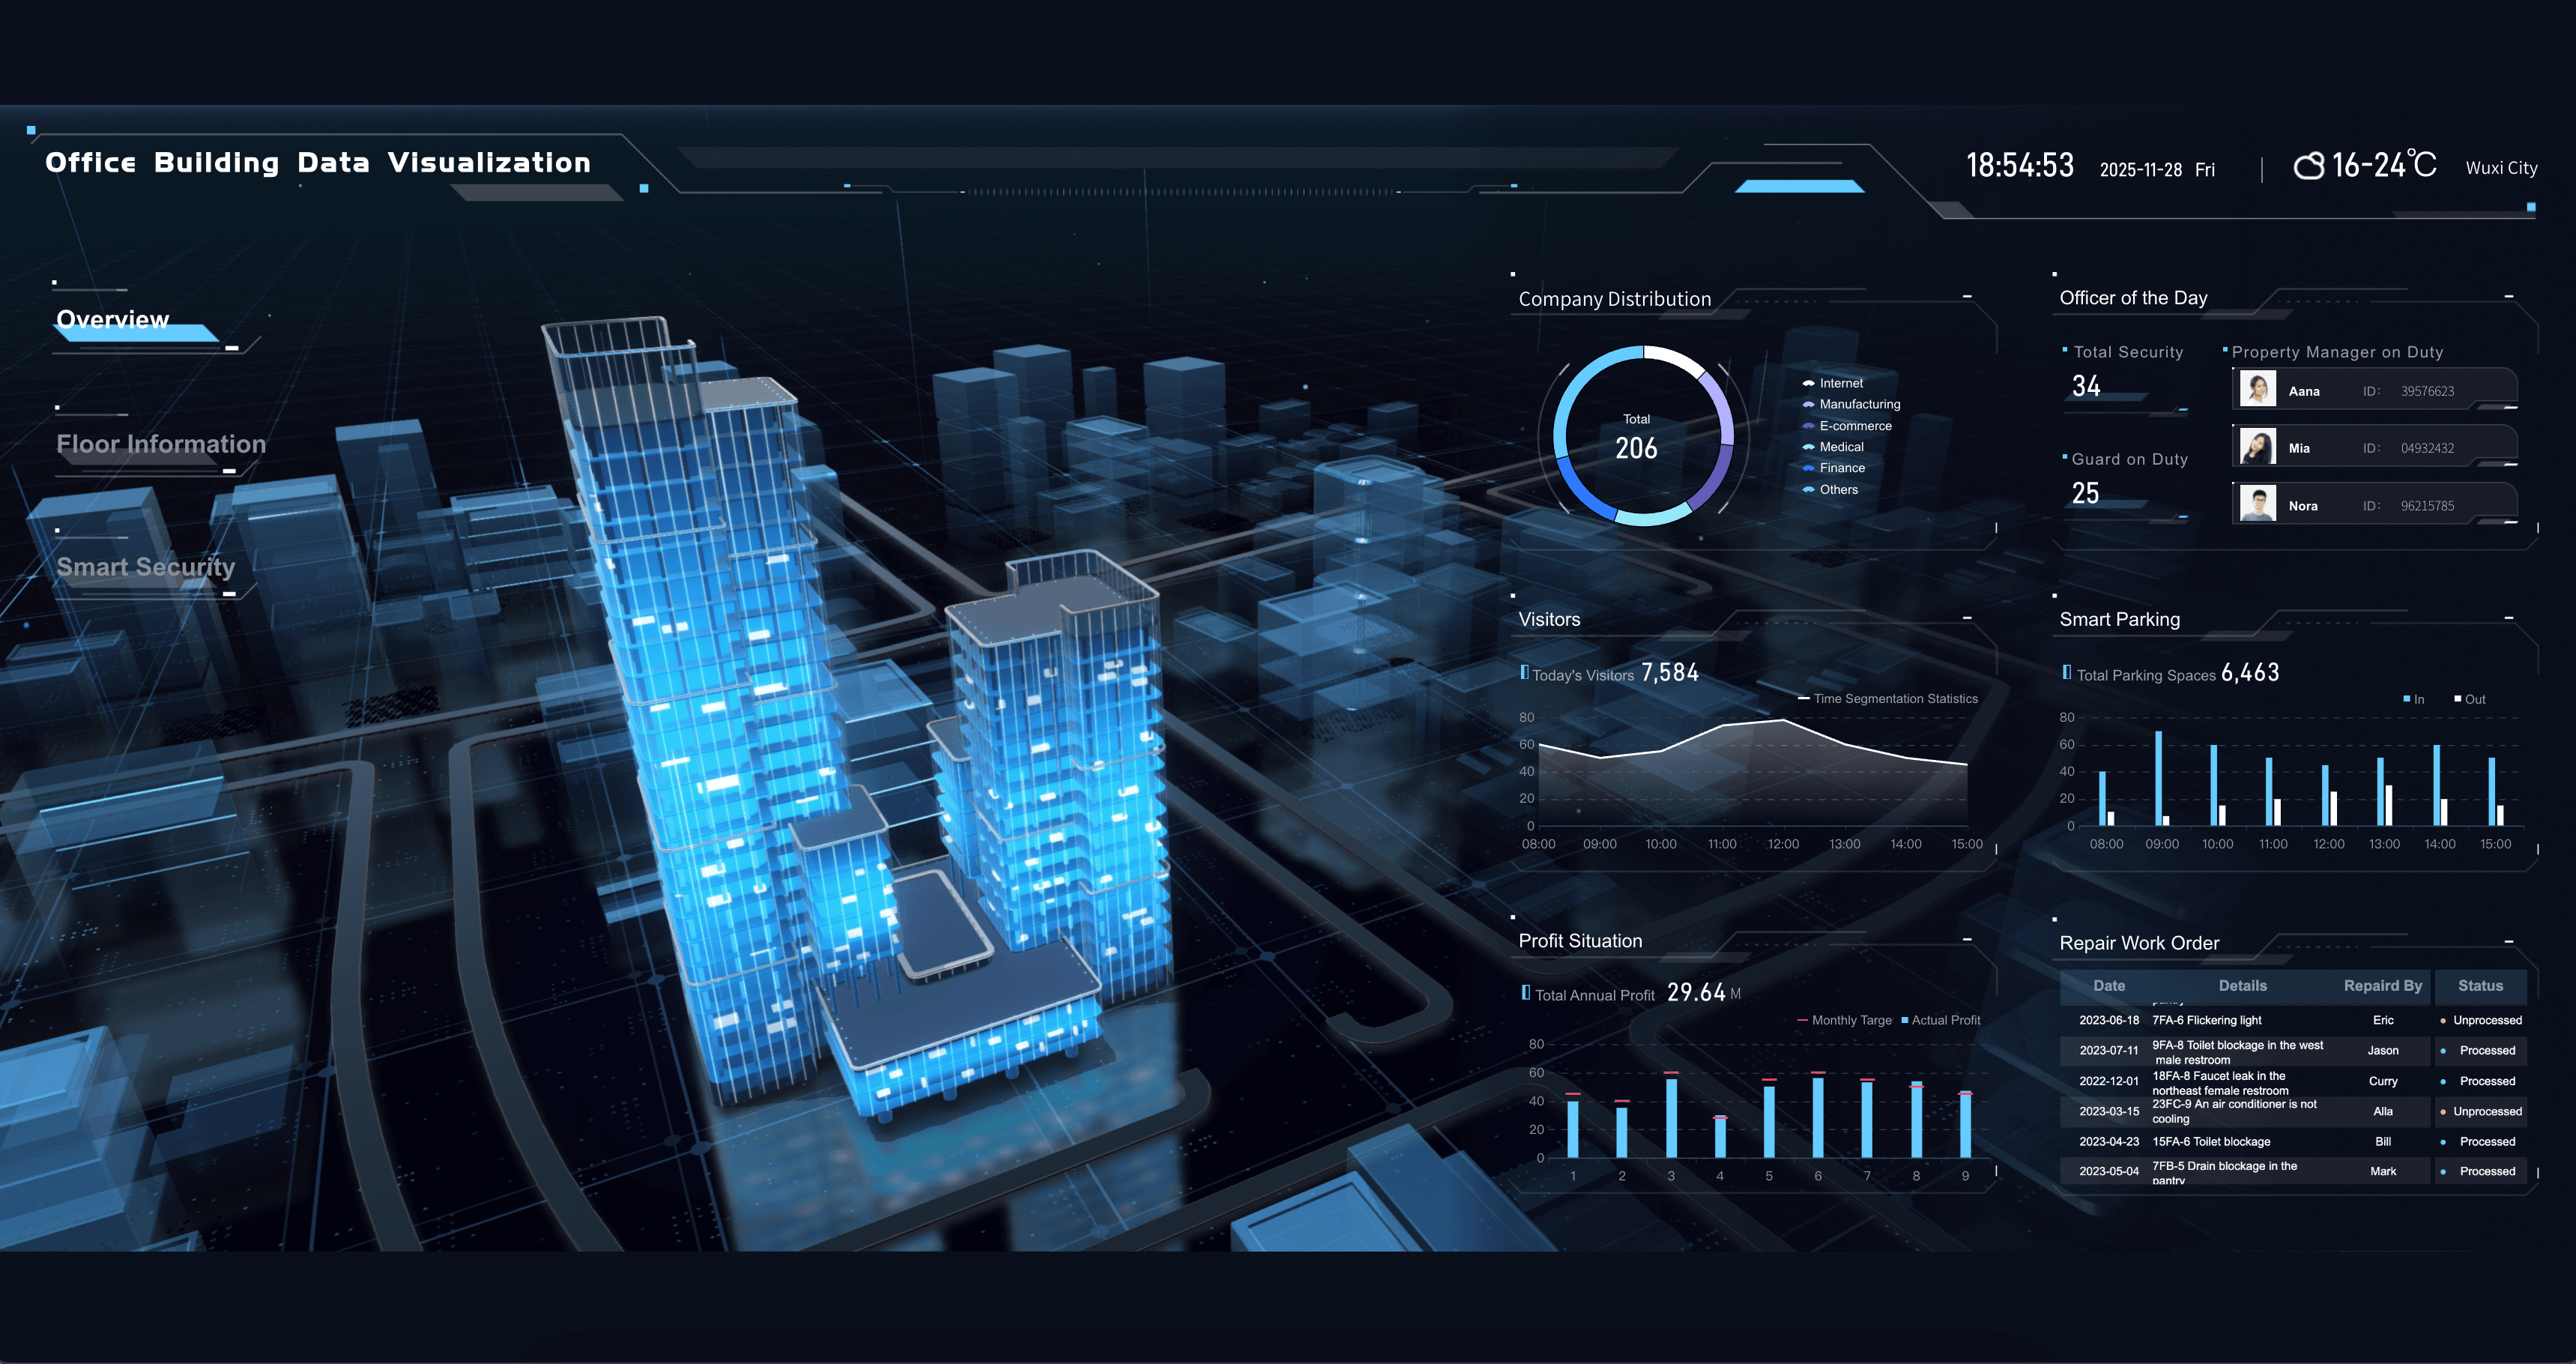
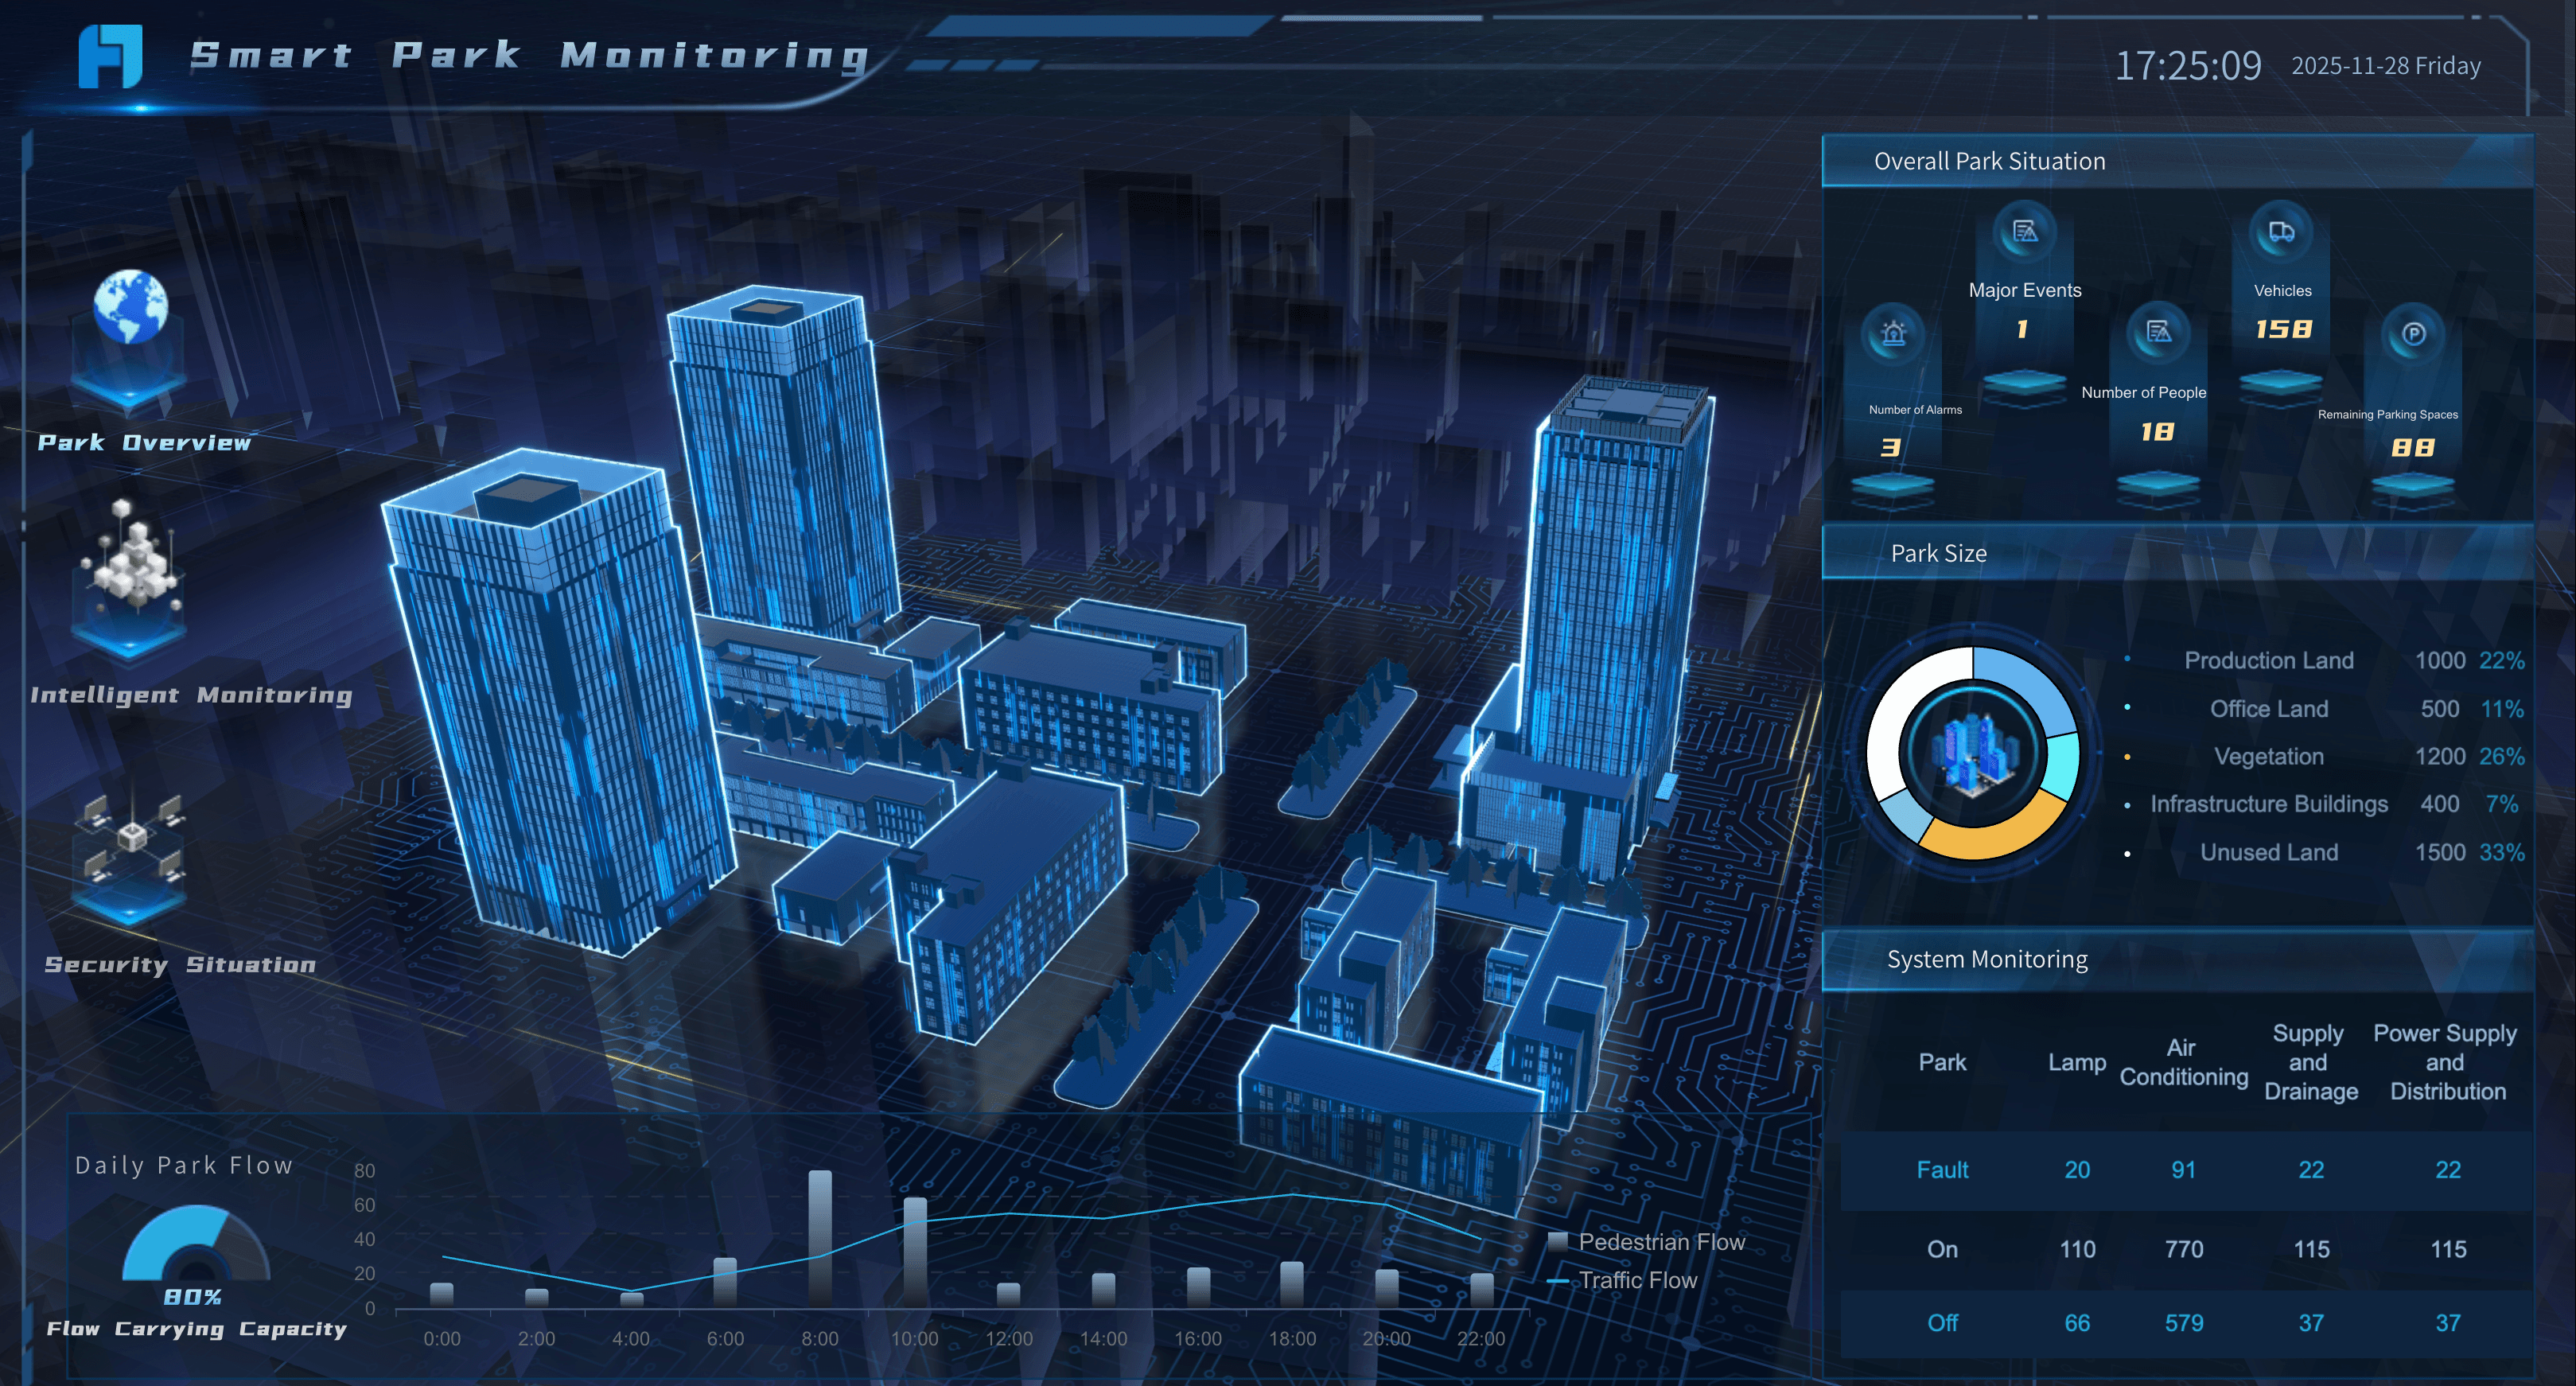
Dashboards are dynamic, visual interfaces designed for real-time monitoring, enabling users to track live KPIs, spot anomalies instantly, and make immediate operational decisions through interactive filters and drill-downs.
Reports are structured, point-in-time documents built for historical analysis, providing the detailed breakdowns, narrative context, and auditable records needed for periodic reviews, compliance filings, and strategic planning.
In short: dashboards show you what is happening now; reports explain what happened, why it matters, and what to do next. Most organizations require both to maintain operational agility while ensuring accountability and long-term insight.
More resources:
- Dive deeper on the question, "What is a financial report?"
- Download interactive report templates
Don't just collect data. Visualize what matters.
Get a deeper exploration to master:
- End-to-end report design from data connection to automated scheduling
- Advanced layout techniques for pixel-perfect, print-ready enterprise reports
- Built-in formulas, parameters, and drill-downs to build interactive reports without code

Difference Between BI and Reporting
Business Intelligence (BI) and reporting overlap but serve distinct roles in the data ecosystem.
- Reporting is the output layer. It answers predefined questions with structured, repeatable deliverables. Reporting focuses on accuracy, consistency, and distribution—ensuring the right people receive the right information at the right time. Examples include scheduled P&L statements, compliance filings, and operational scorecards.
- Business Intelligence (BI) is the entire system. It encompasses data integration, warehousing, analytical modeling, self-service exploration, dashboards, and reporting. BI enables users to ask new questions, discover hidden patterns, and build their own analyses without IT dependency. Think of it this way: reporting is a subset of BI. A mature BI platform includes robust reporting capabilities, but also provides ad-hoc analysis, data preparation, predictive modeling, and collaborative features that go far beyond static documents.
Types of Reports
Business reports vary by purpose, audience, and frequency. Here are the most common types:
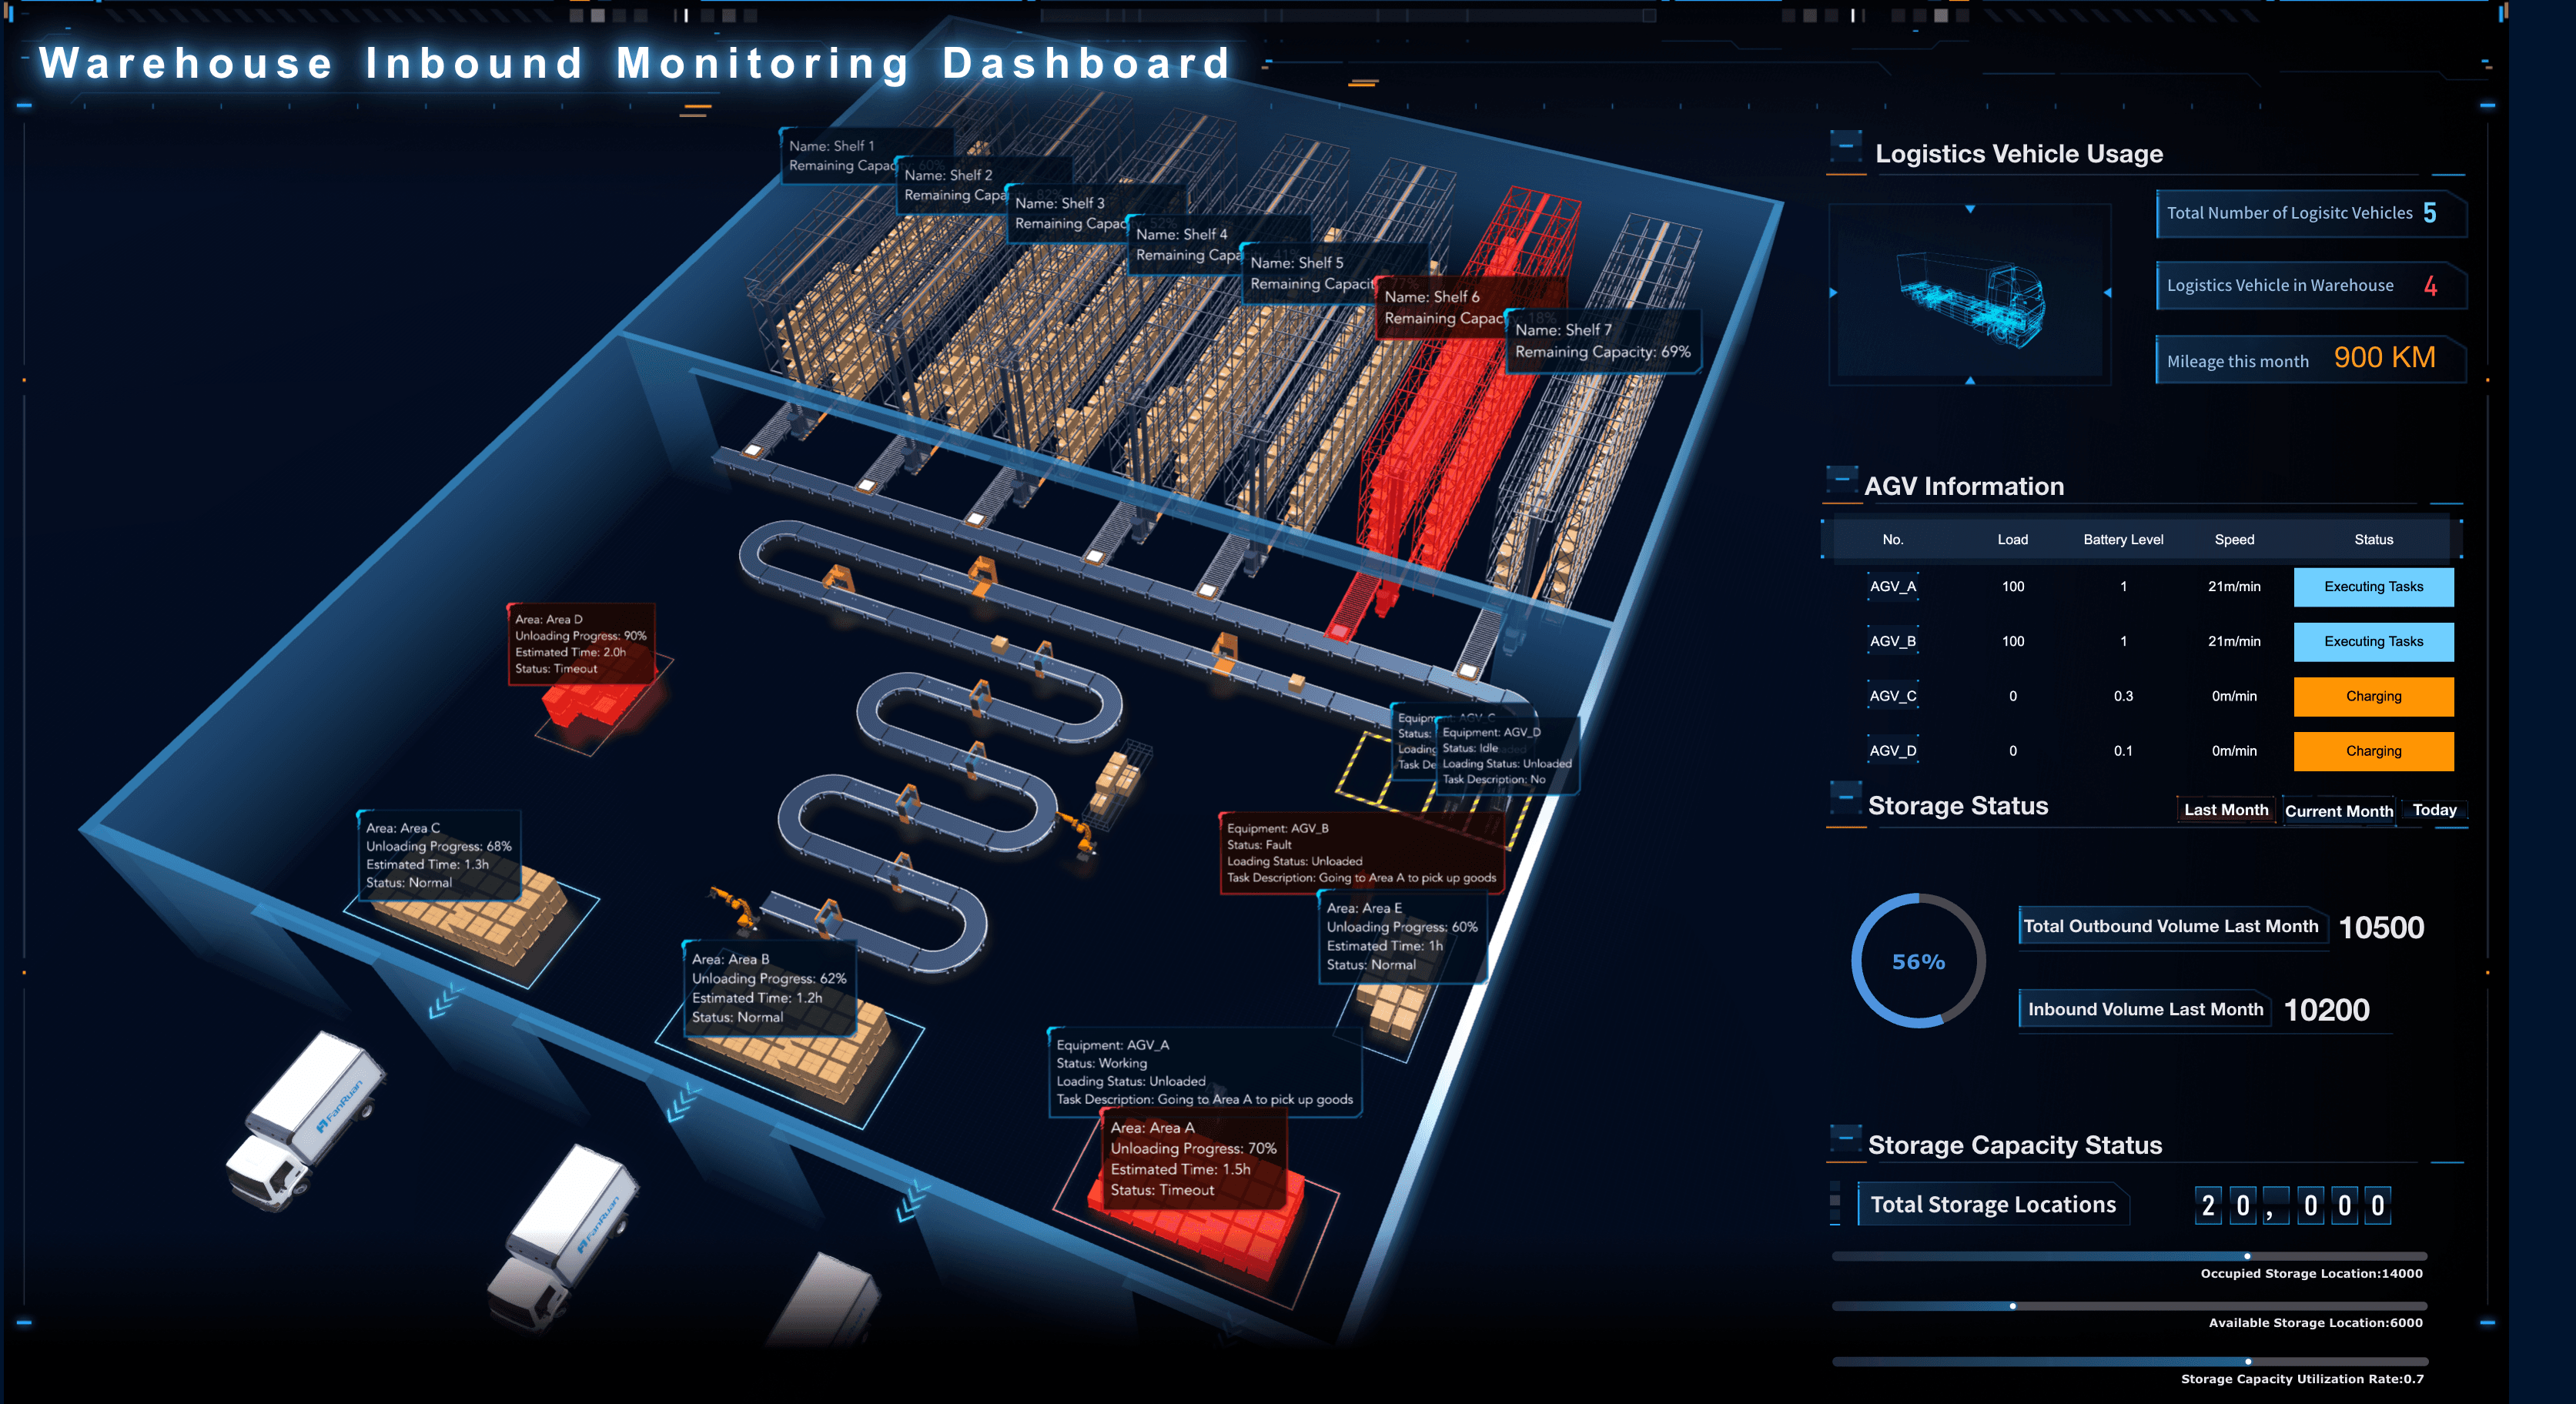
Operational Reports track day-to-day business activities.
Examples:
- Production reports
- Inventory reports
- Customer service reports
- Logistics reports
Benefits
- Improve operational efficiency
- Monitor business processes
- Identify performance bottlenecks
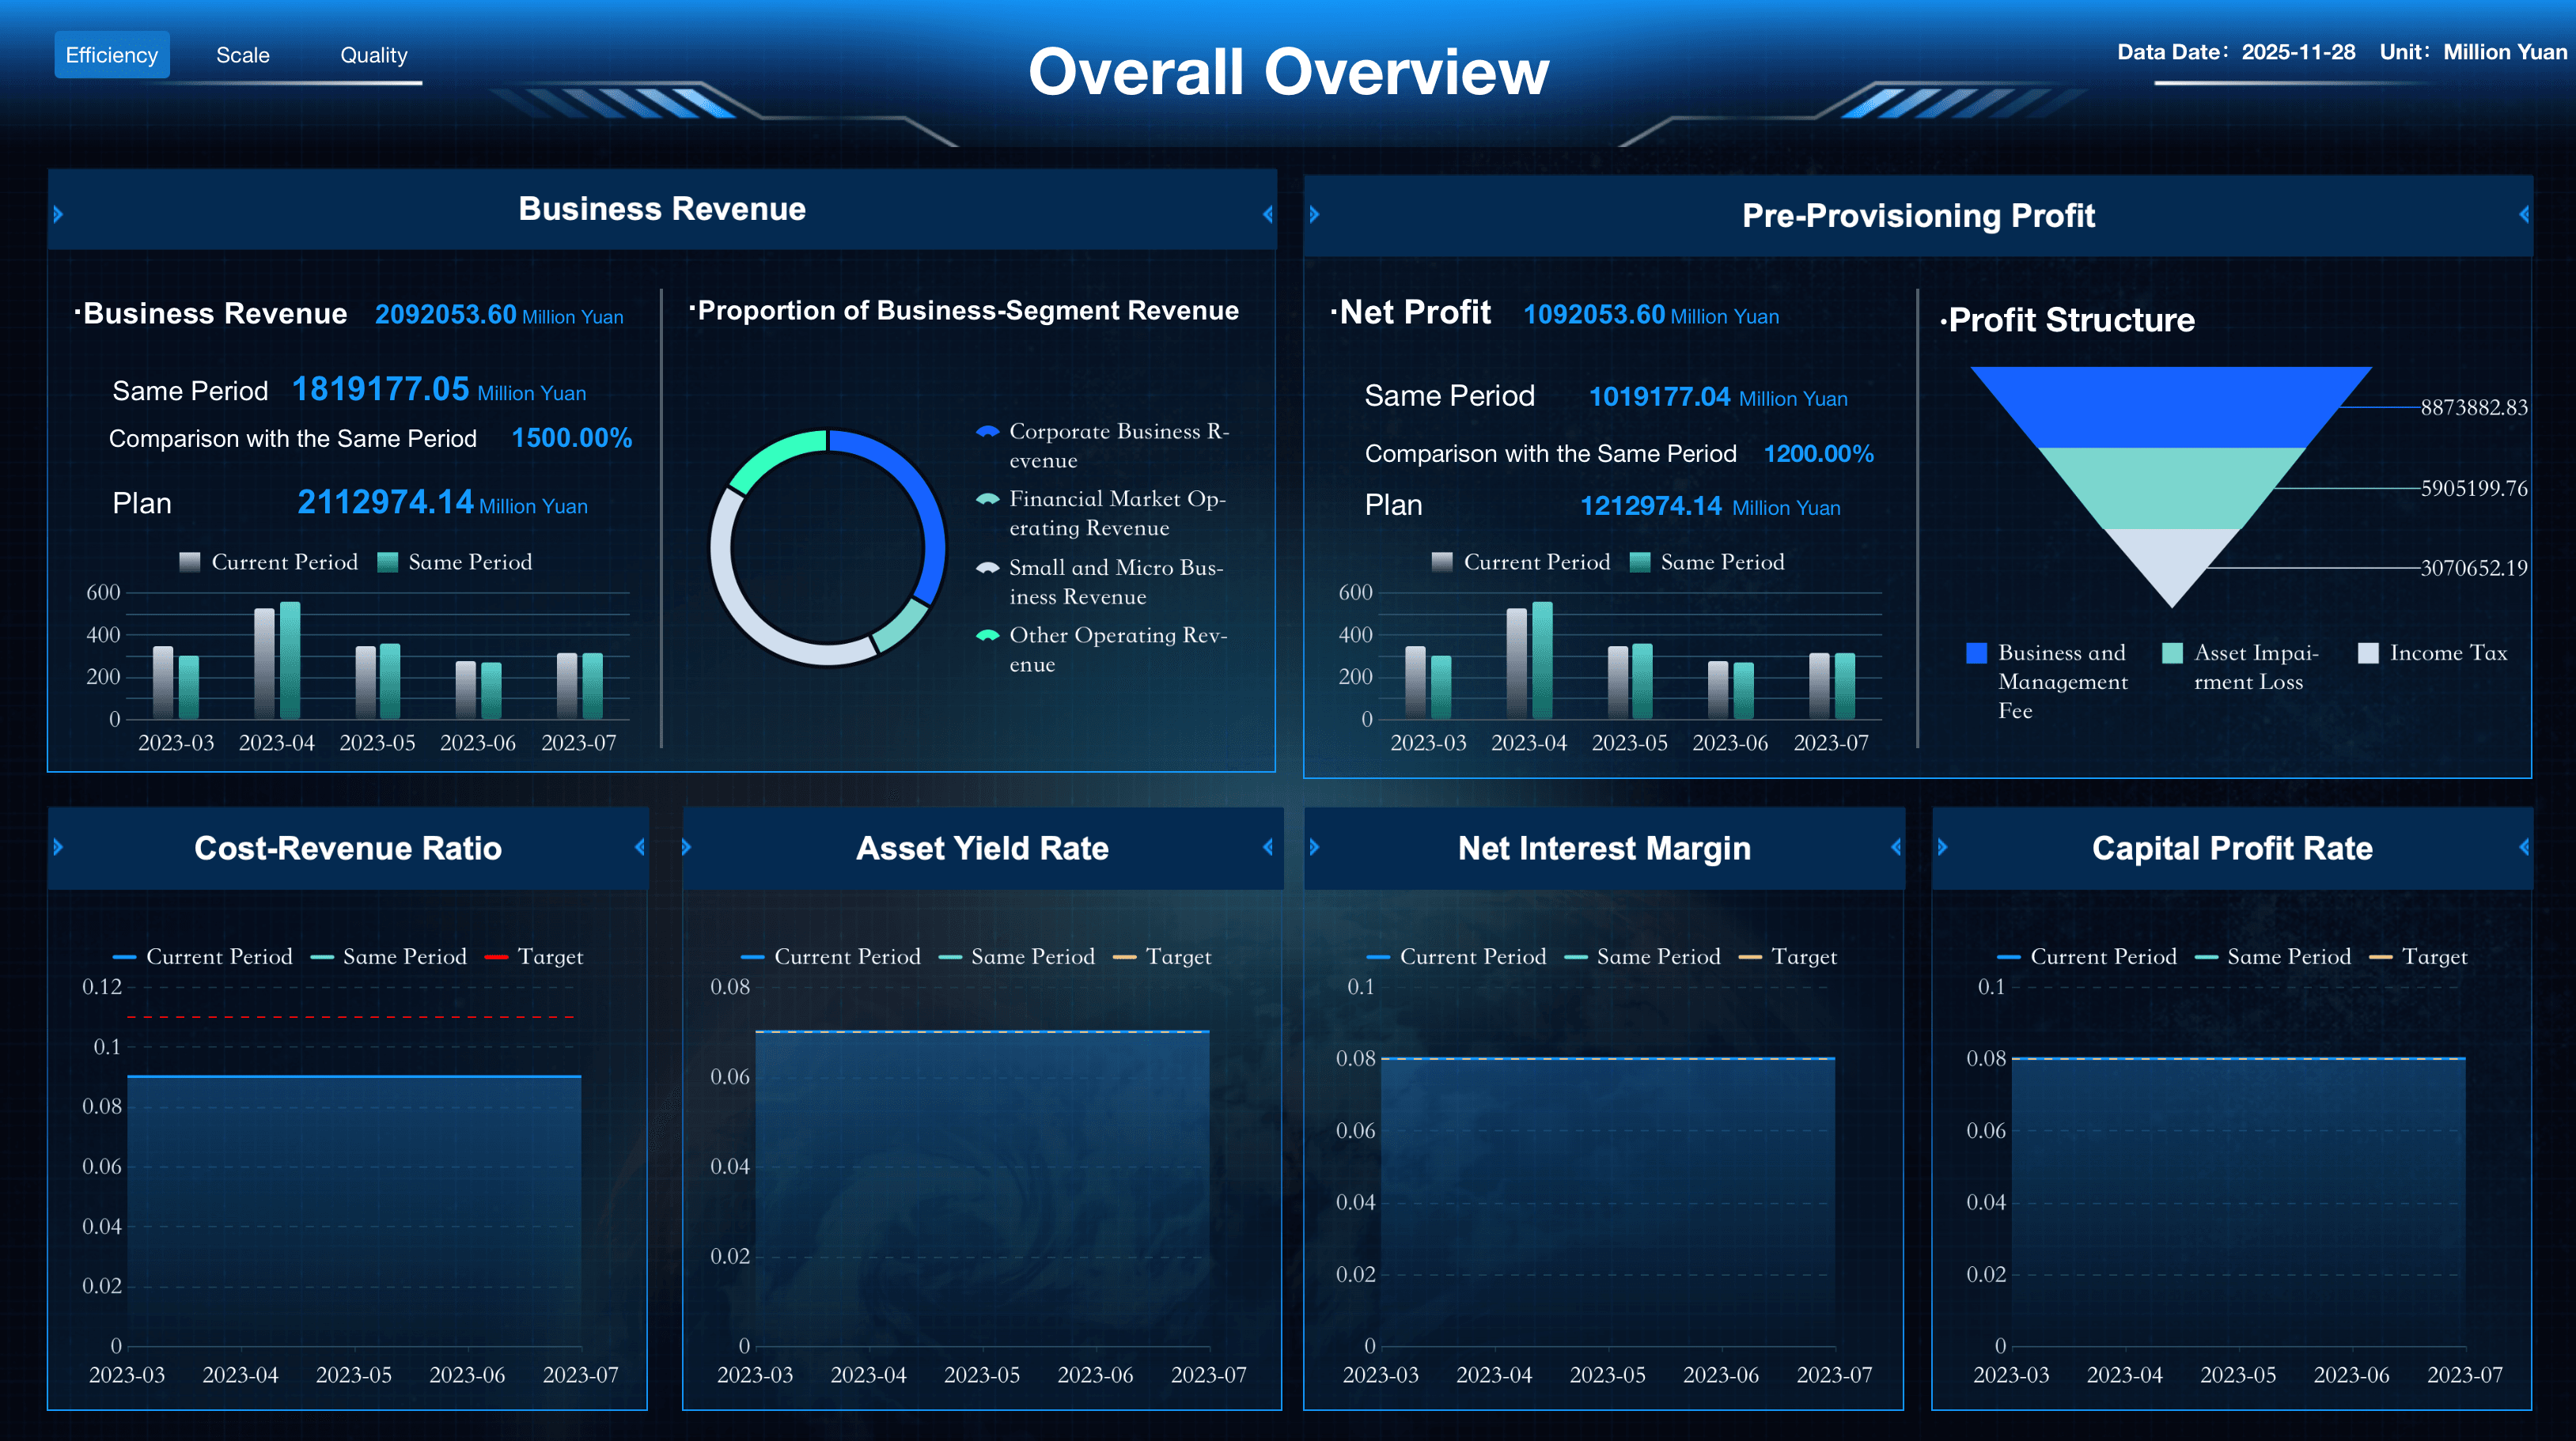
Financial Reports provide visibility into organizational financial health.
Examples:
- Profit and loss statements
- Balance sheets
- Cash flow reports
- Budget reports
Benefits
- Support financial planning
- Ensure compliance
- Improve budget control
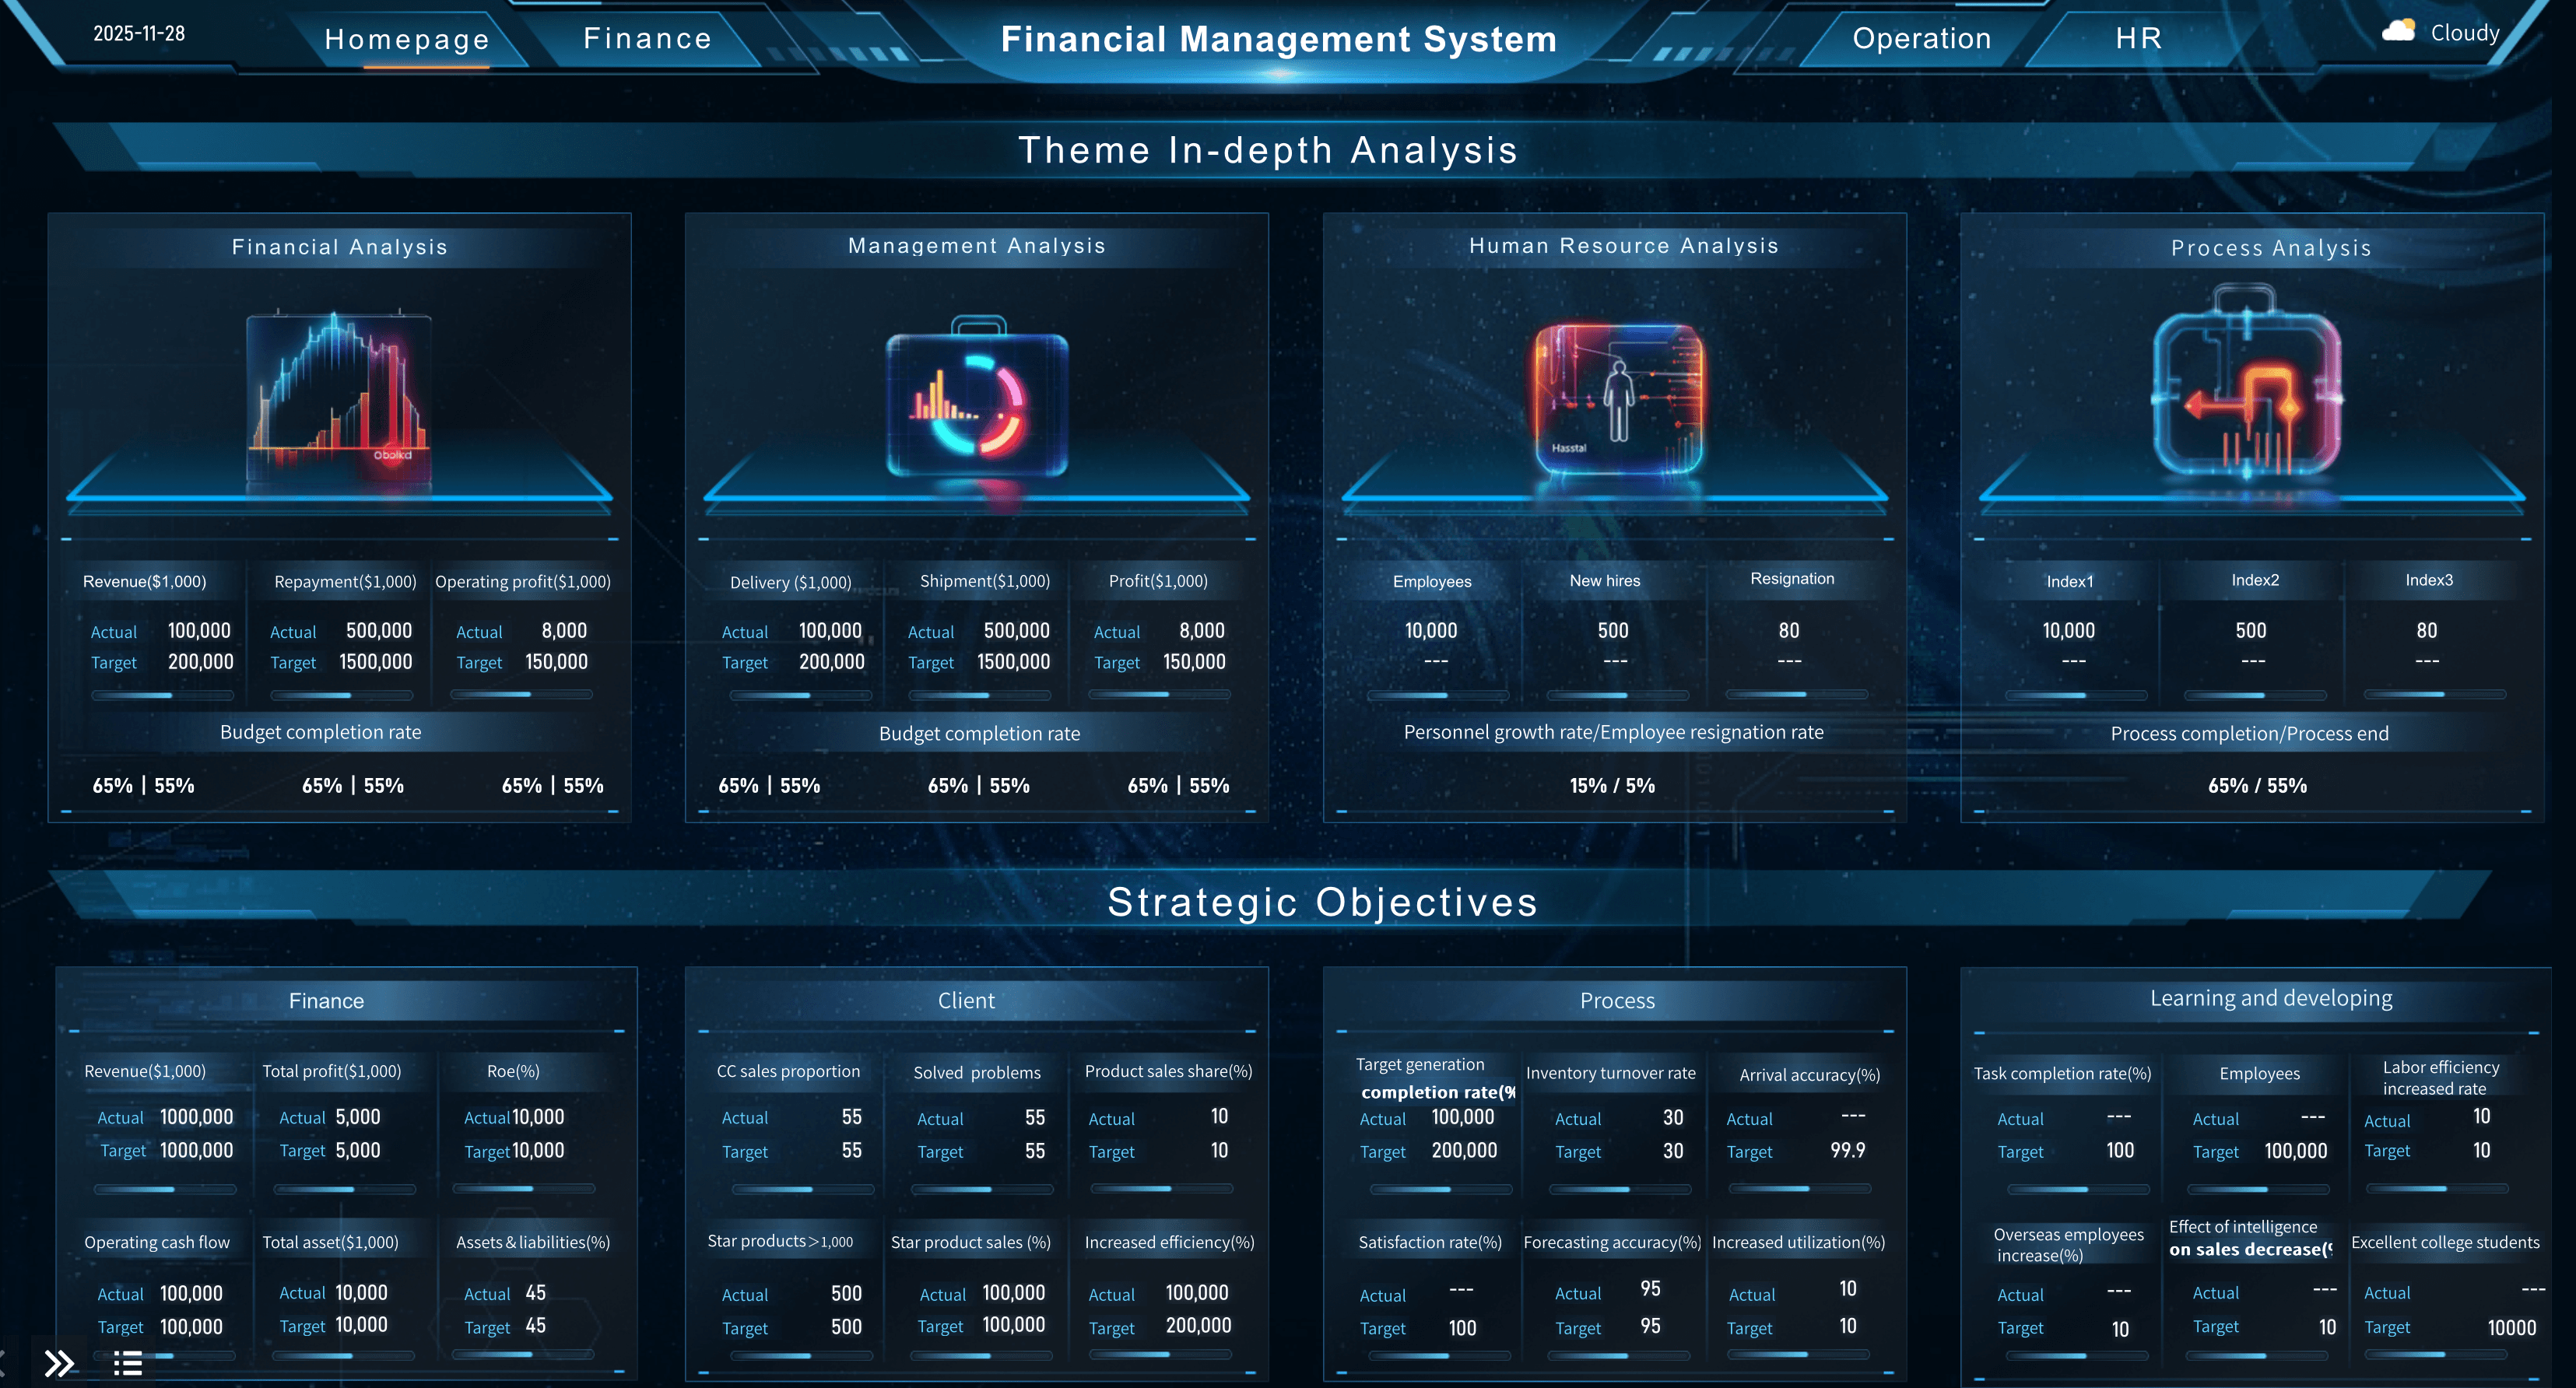
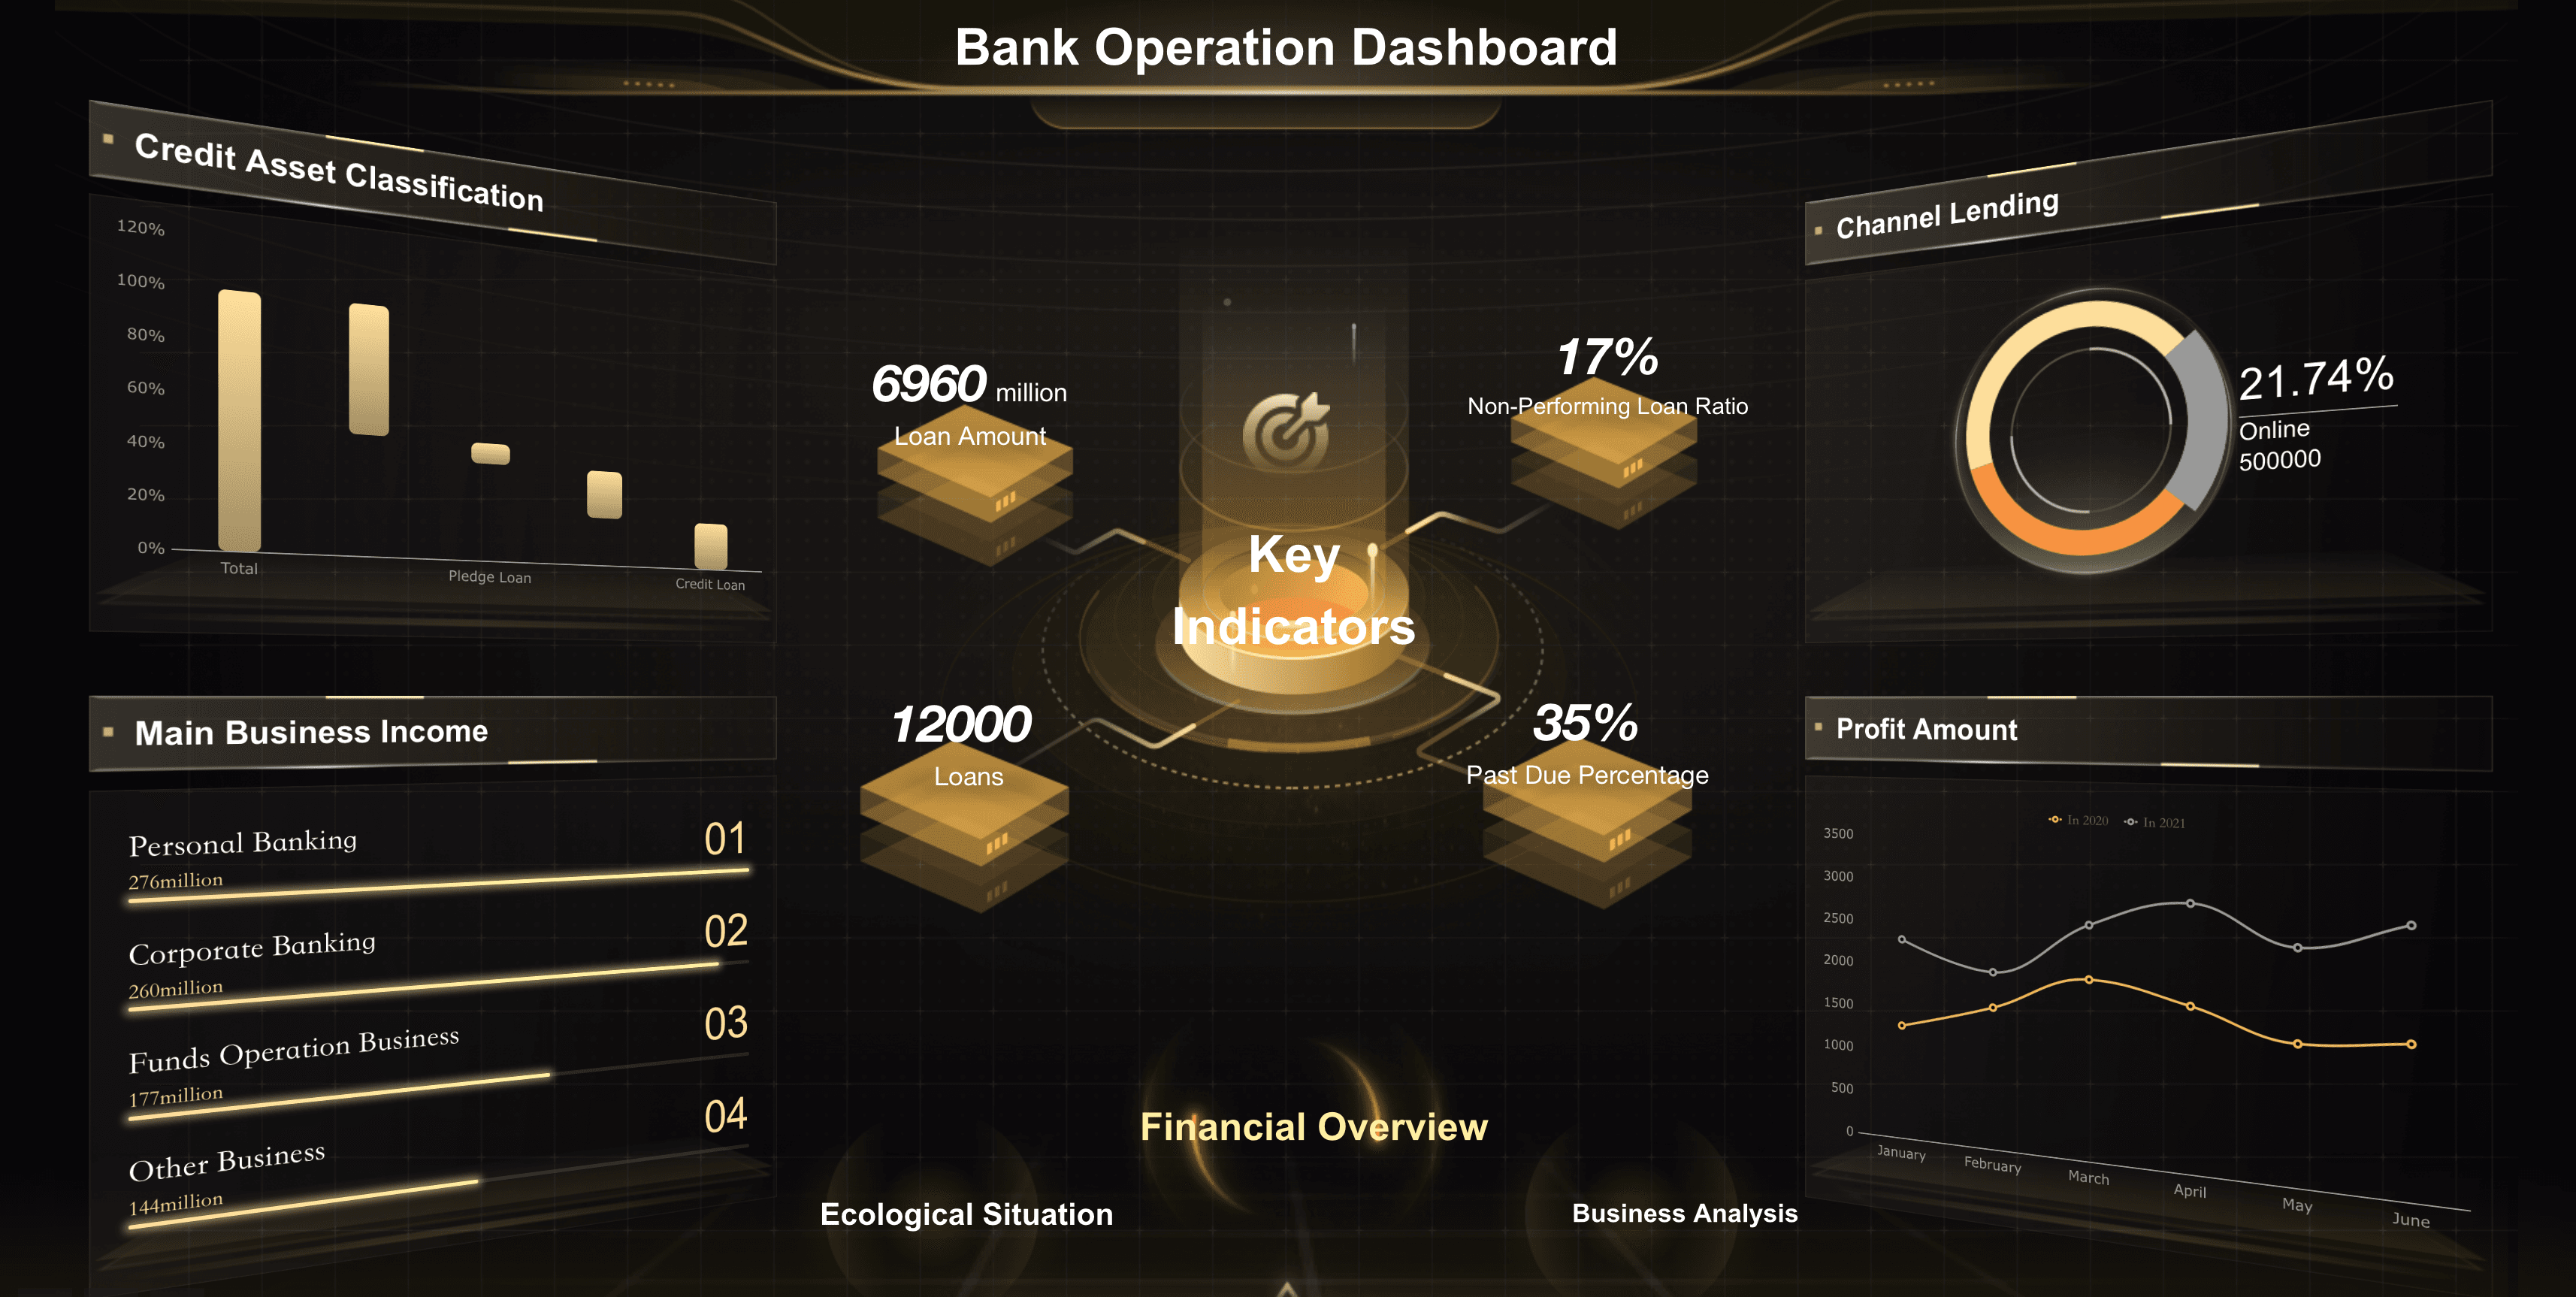
- Management Reports
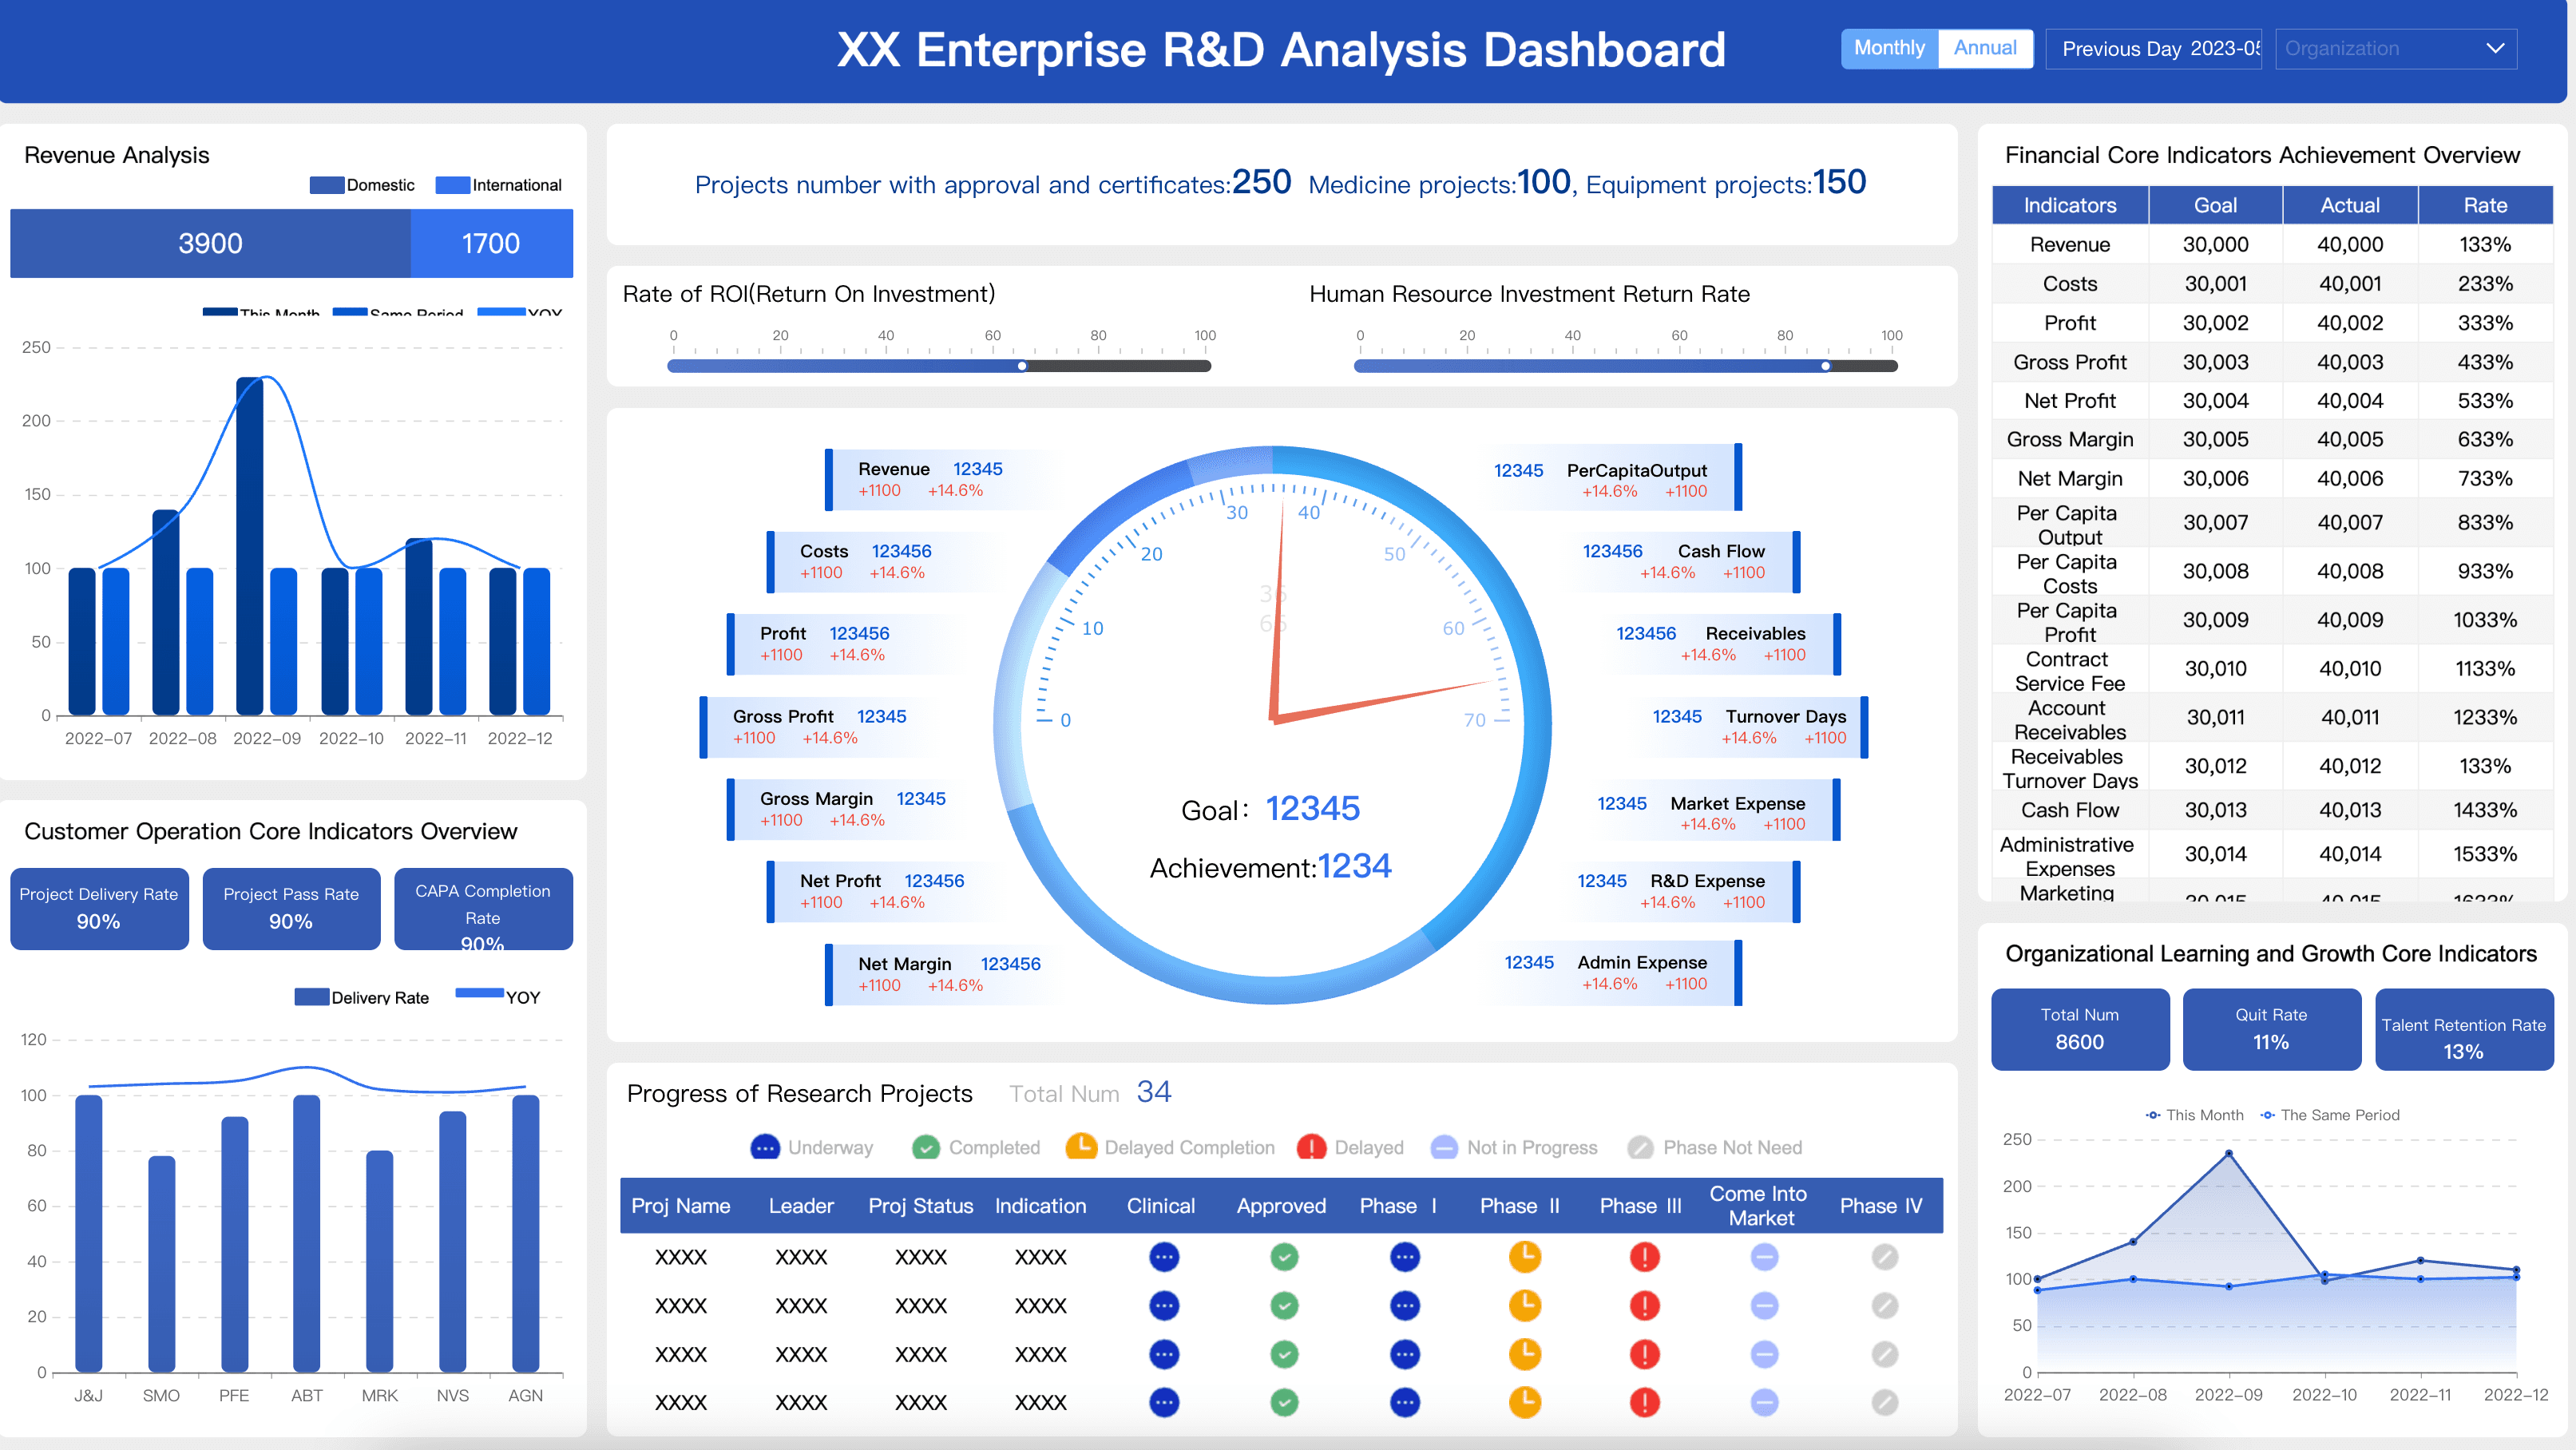
Management reports help executives evaluate organizational performance.
Examples:
- Executive summaries
- Department performance reports
- Strategic KPI reports
Benefits
- Support executive decision-making
- Align business objectives
- Track strategic initiatives
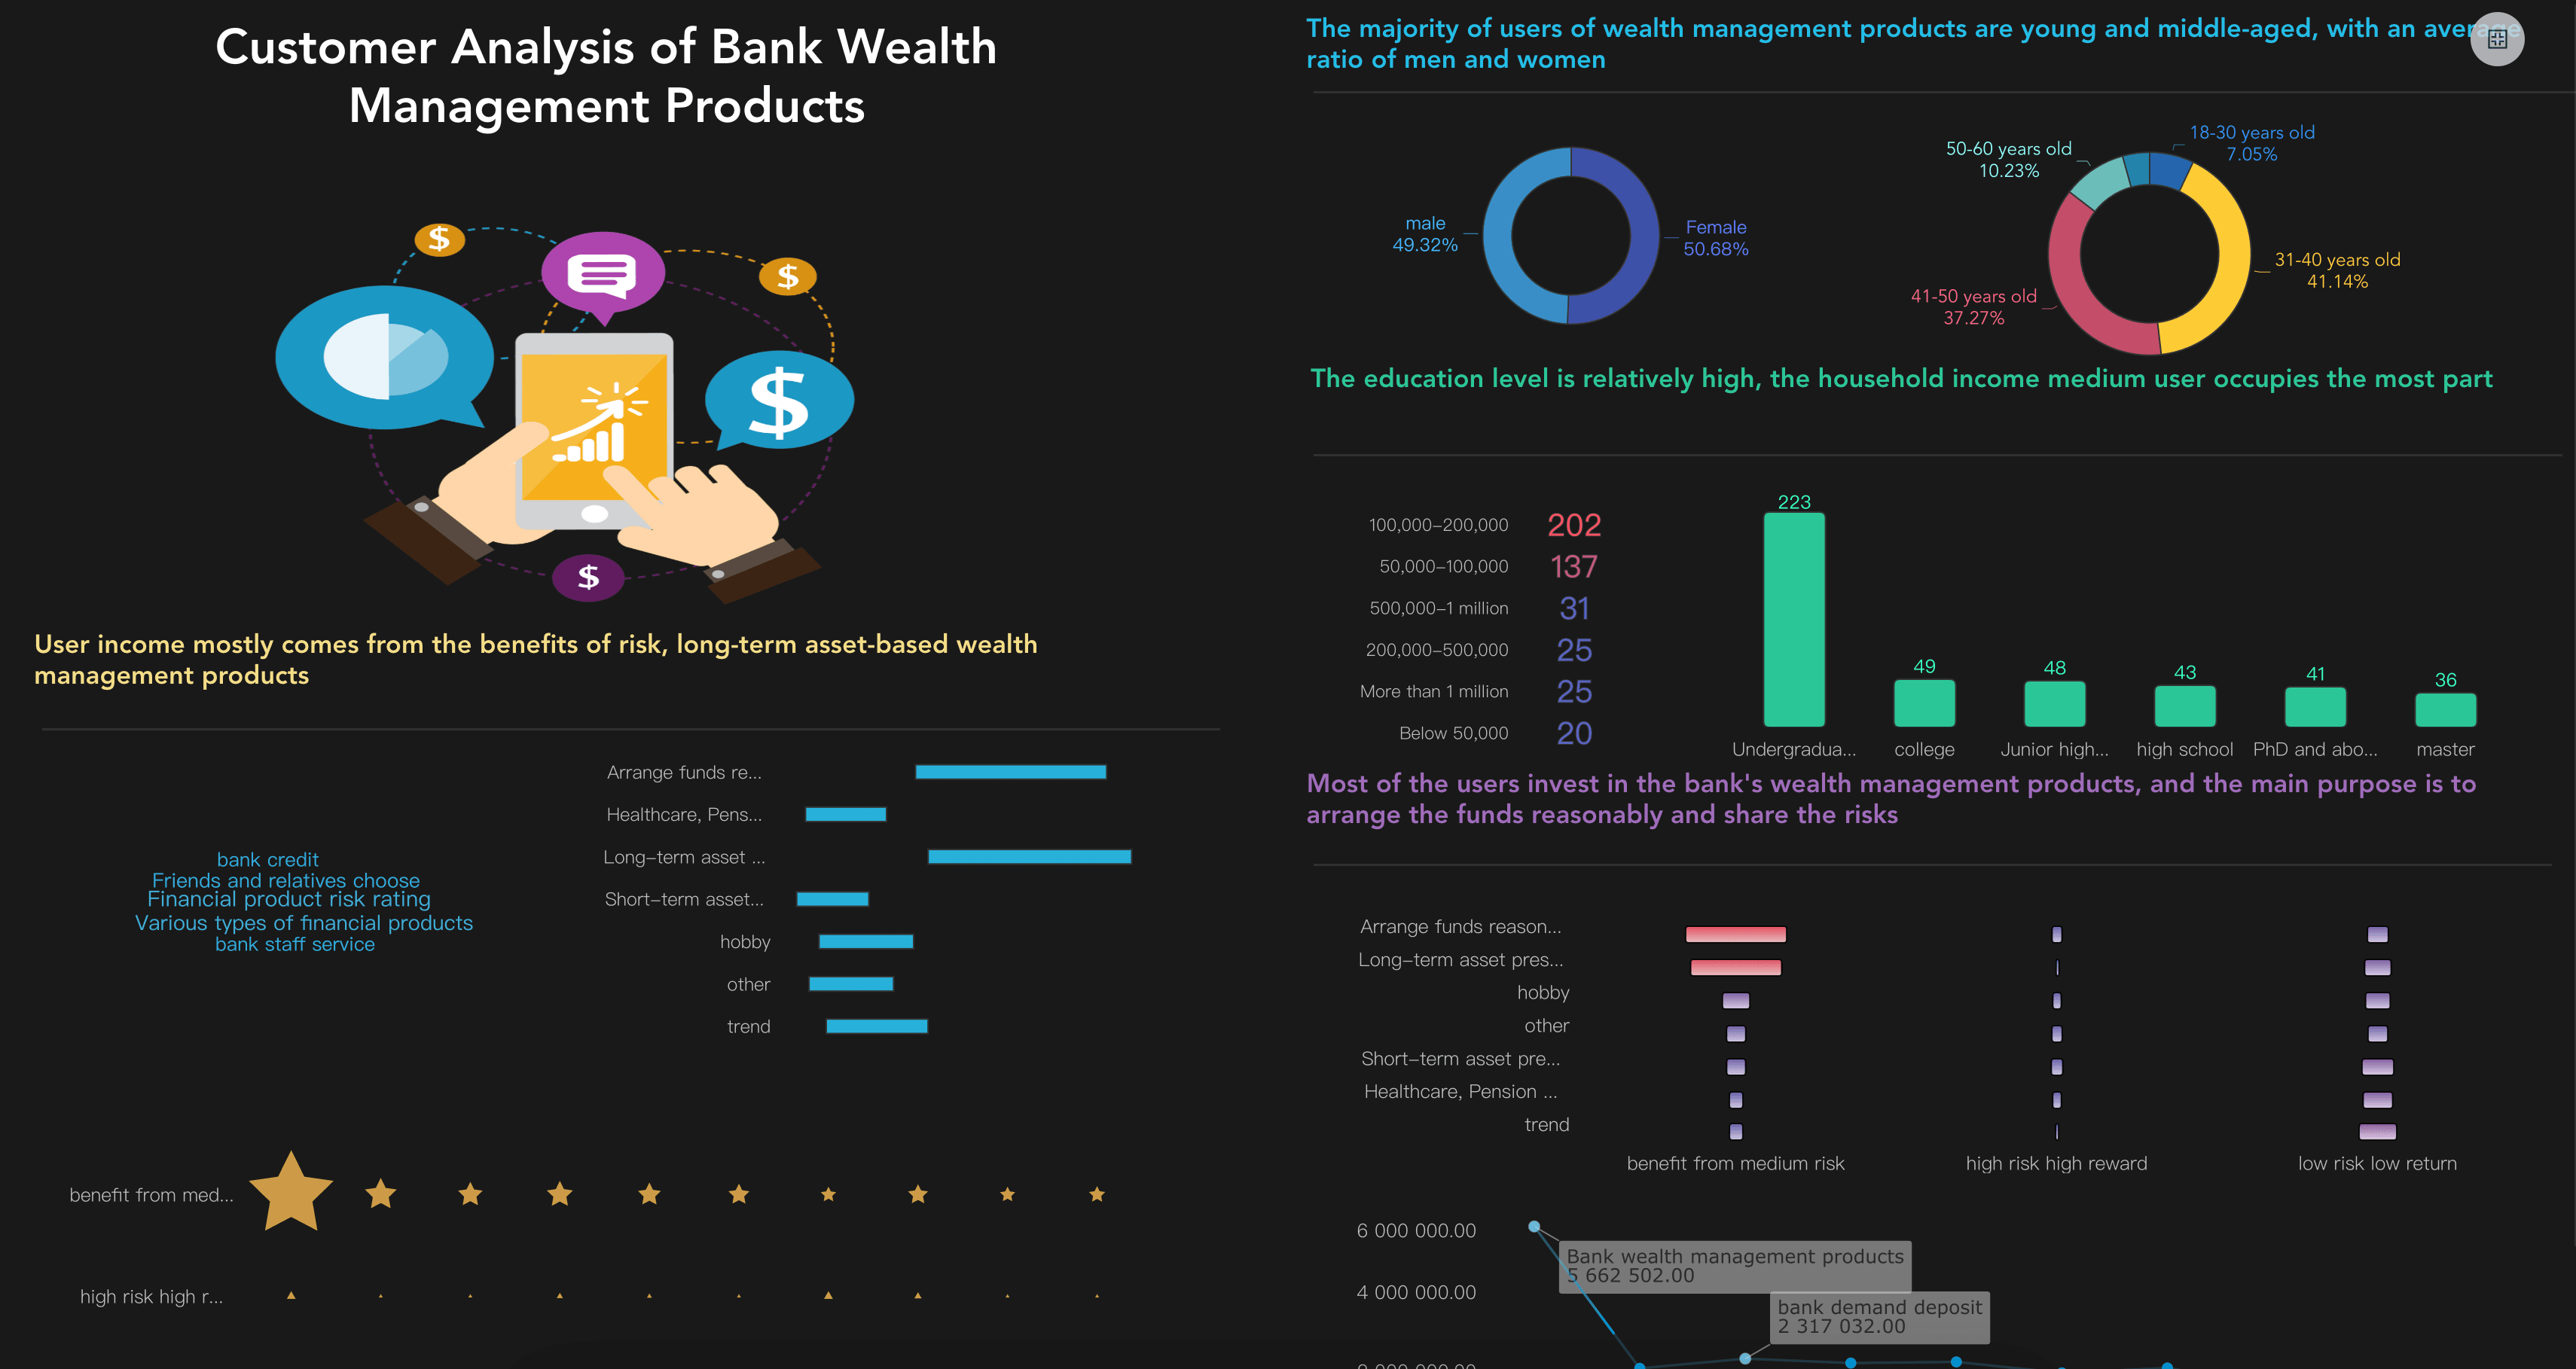
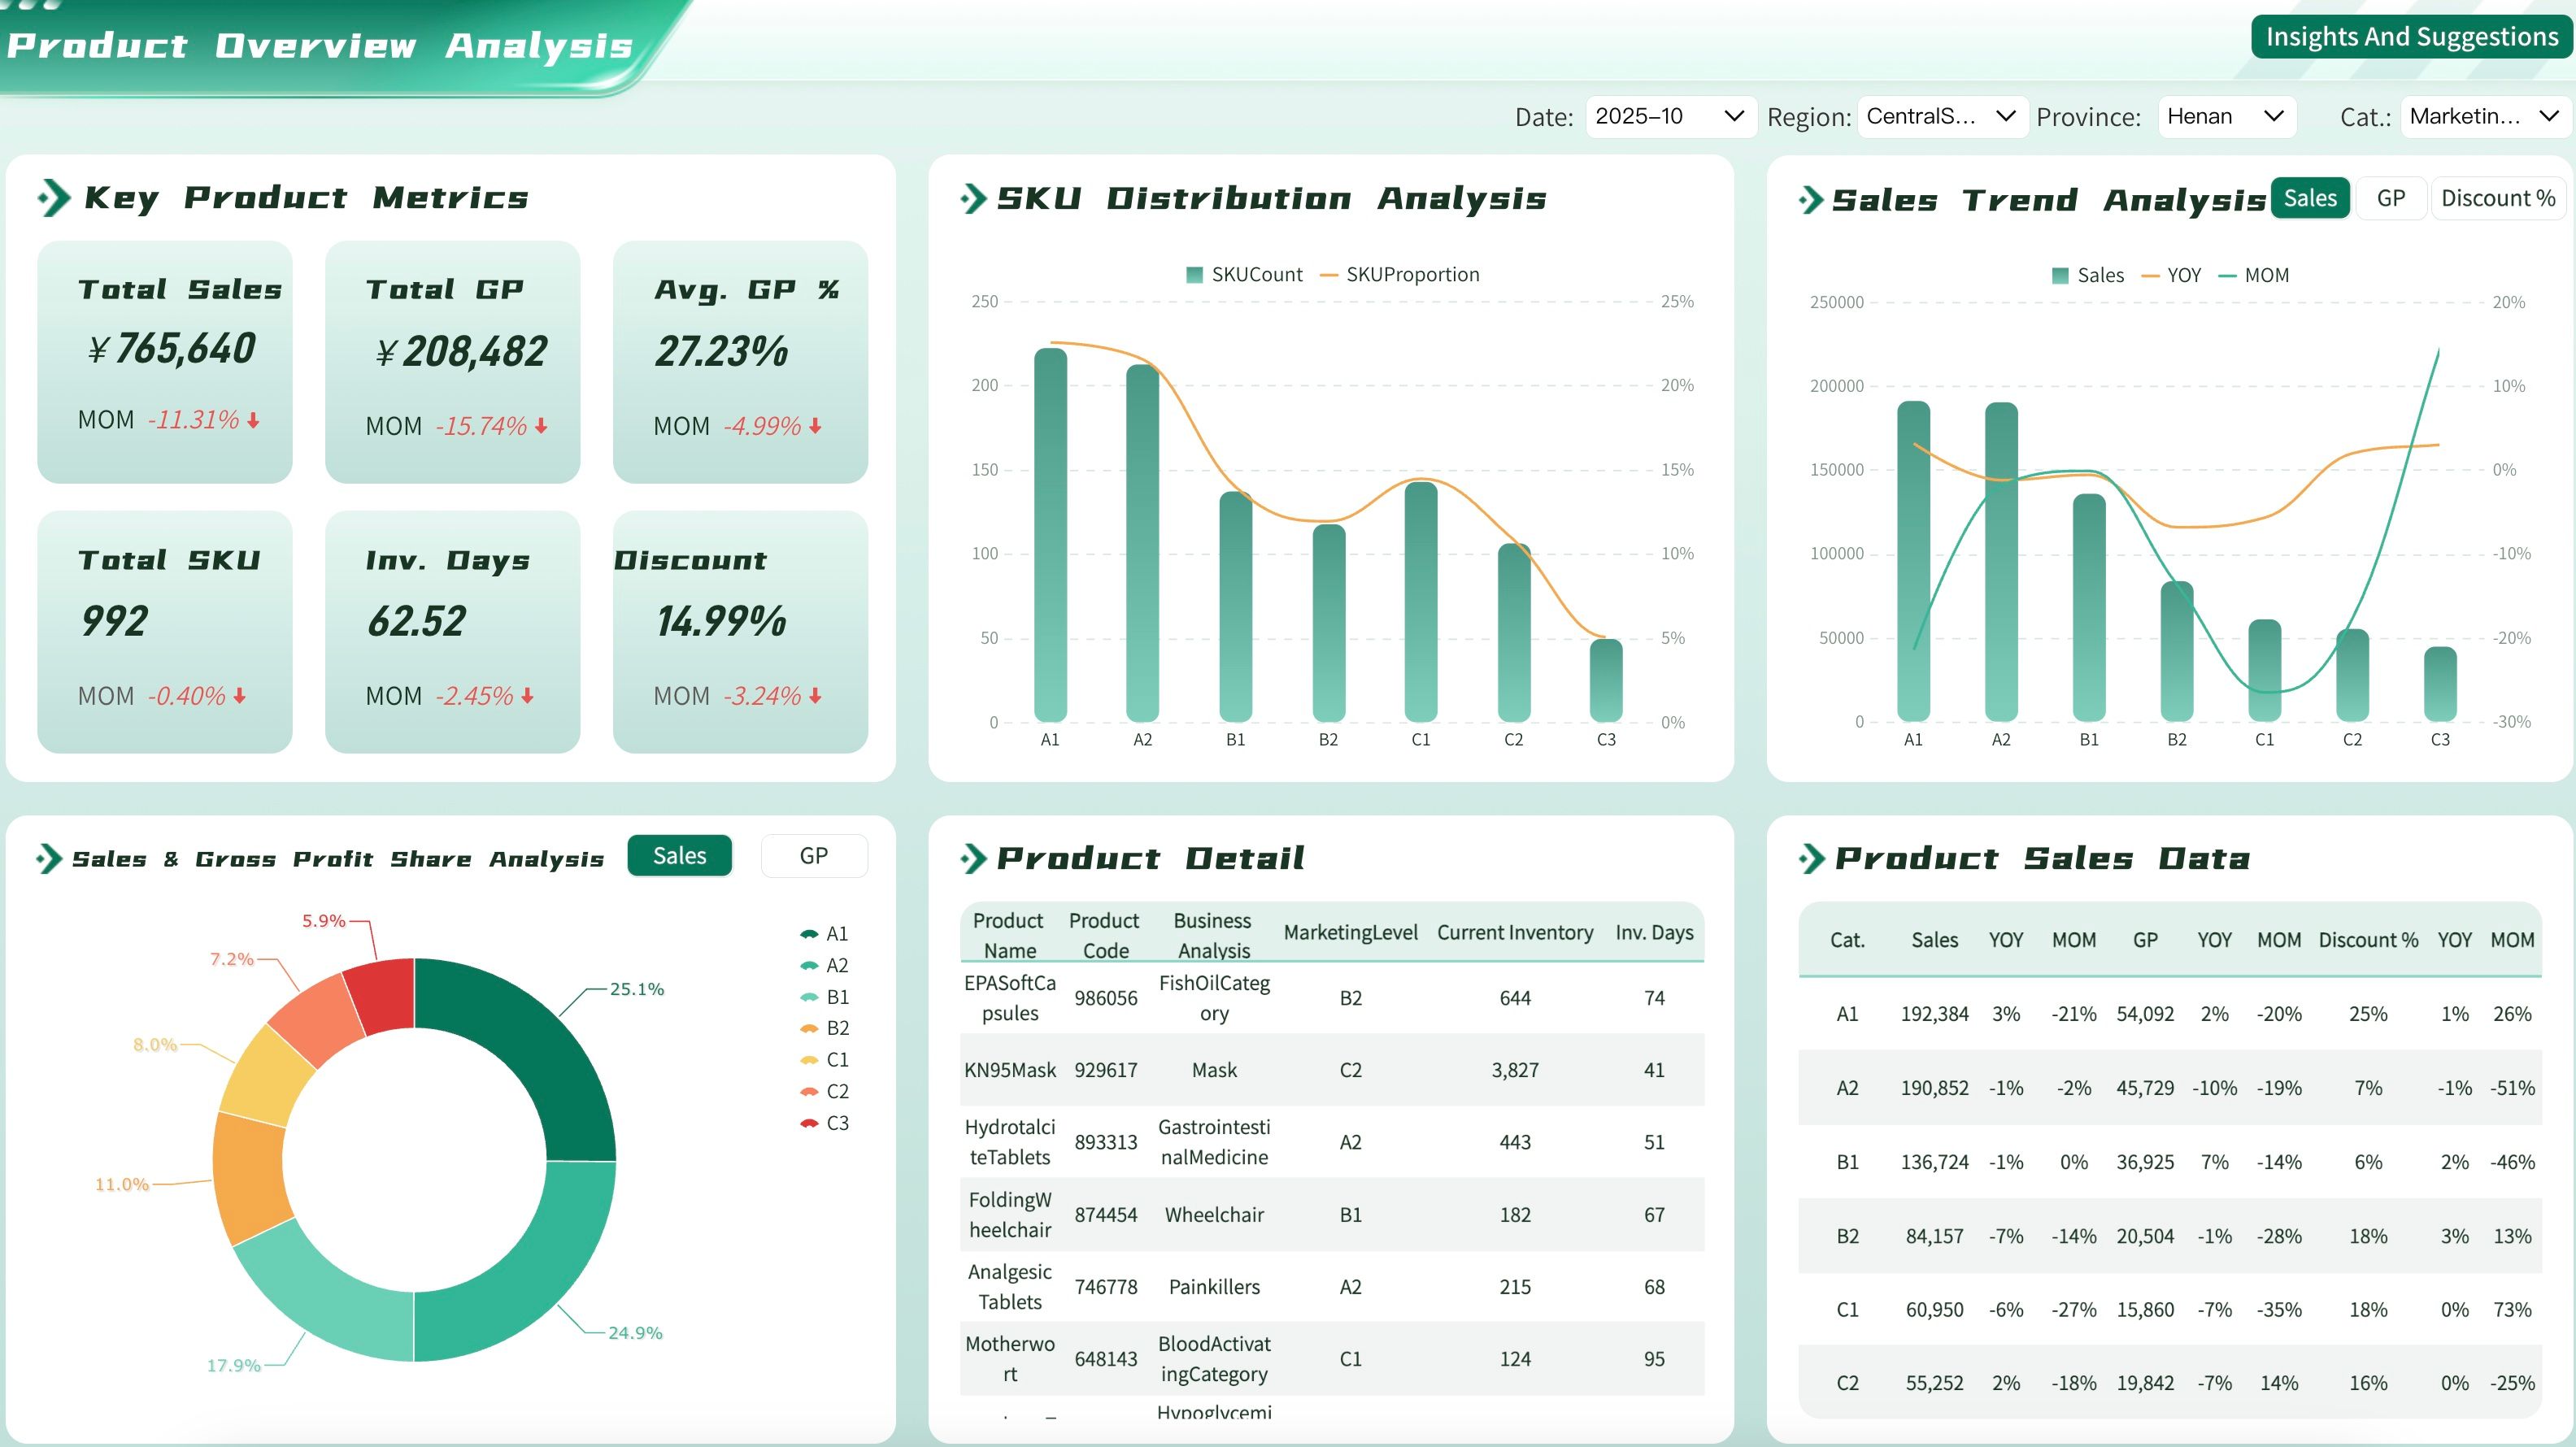
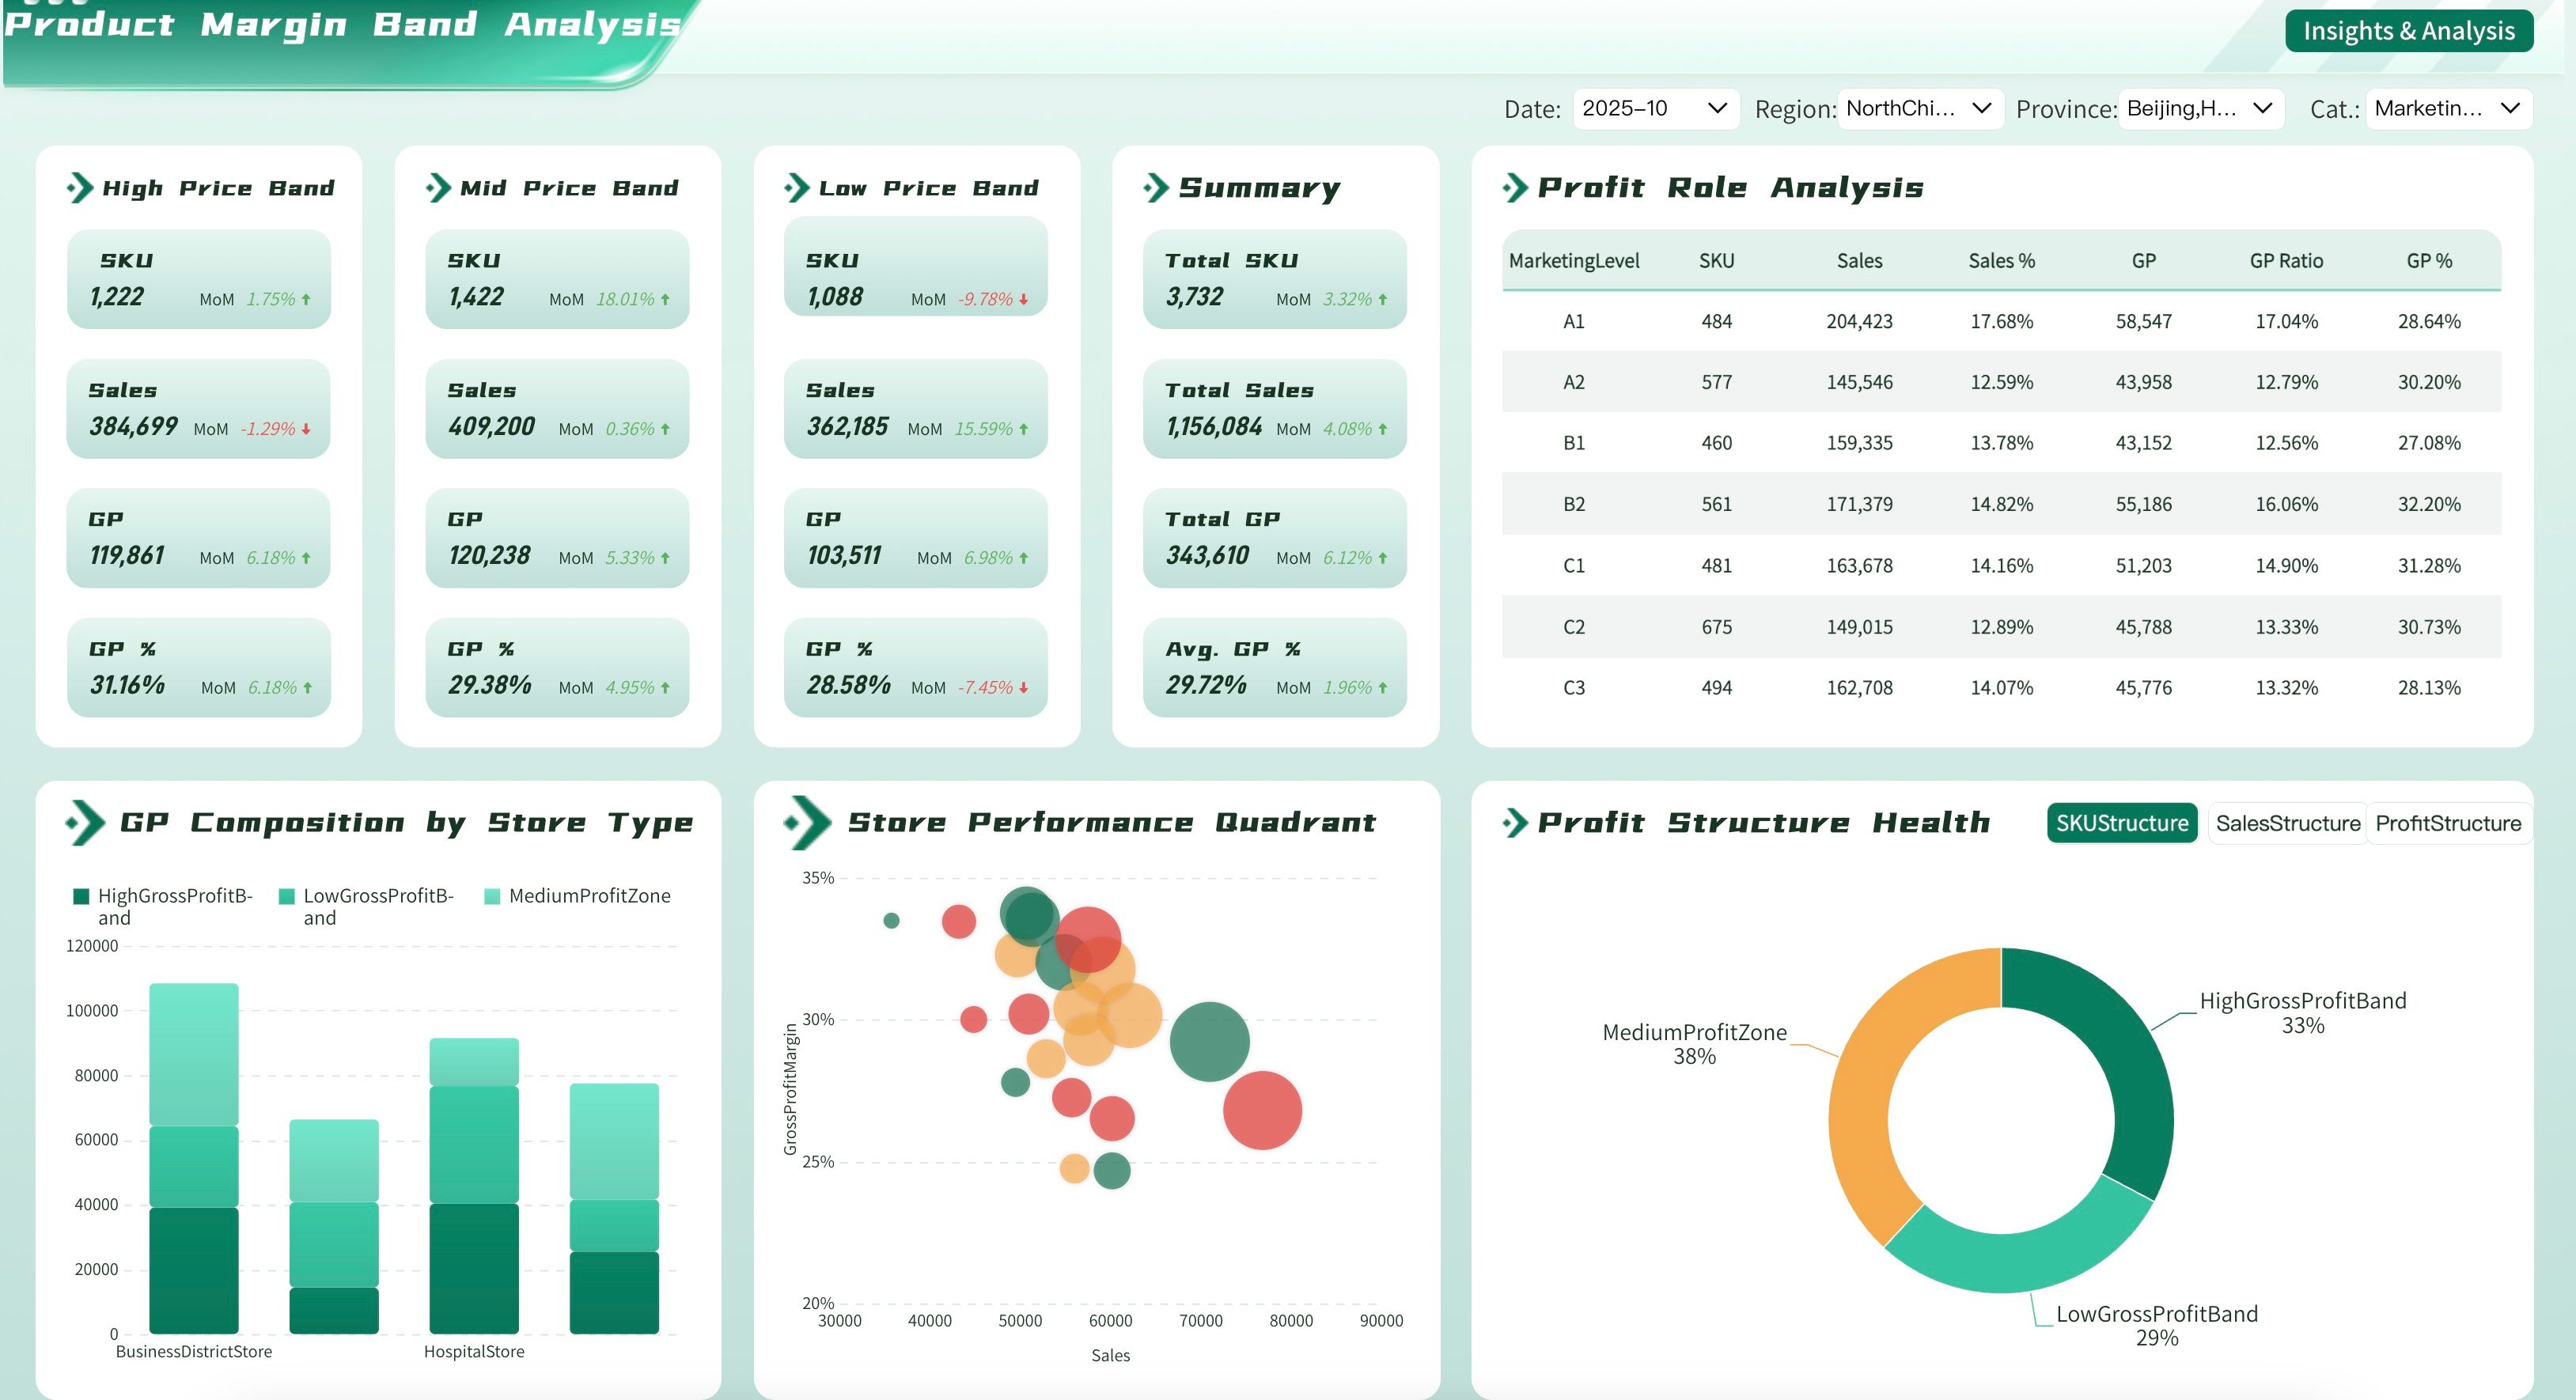
Analytical Reports examine trends, patterns, and business performance.
Examples:
- Sales trend analysis
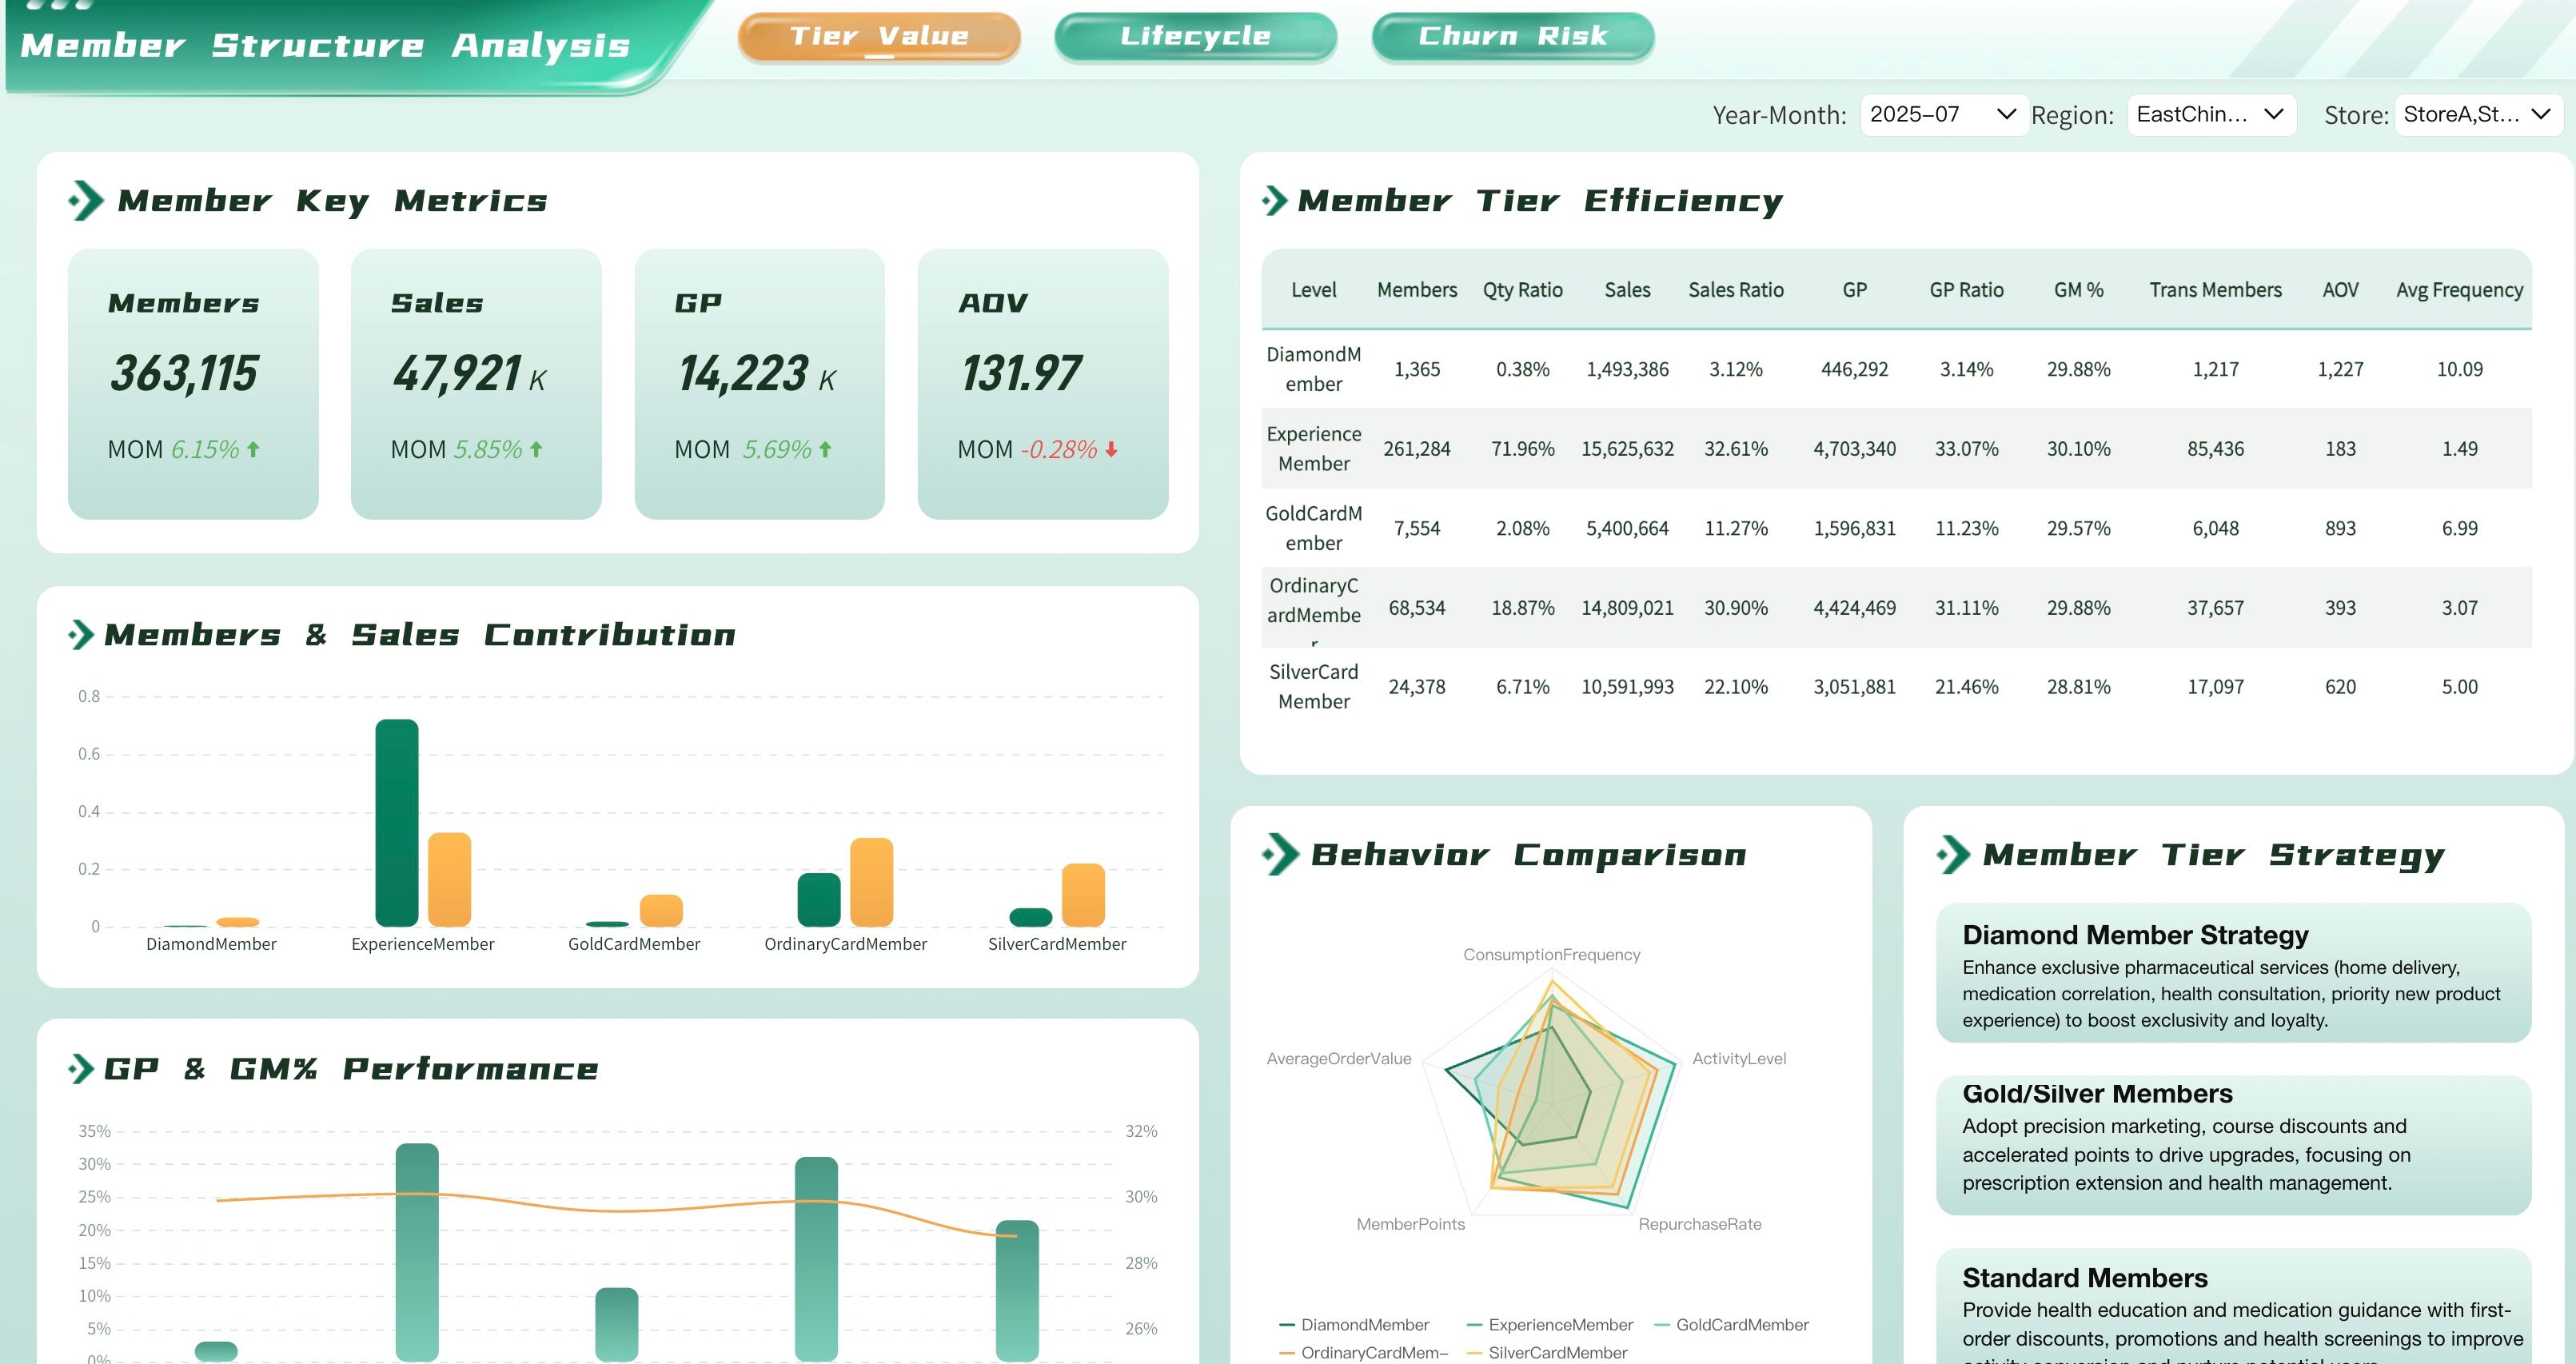
- Customer behavior analysis
- Market performance reports
Benefits
- Discover business opportunities
- Improve forecasting accuracy
- Support strategic planning
Regulatory and Compliance Reports help organizations meet legal and industry requirements.
Examples:
- Audit reports
- Tax reports
- Regulatory submissions
- Risk management reports
Benefits
- Reduce compliance risks
- Improve governance
- Simplify auditing processes
How to Build a Report
Effective reports don’t happen by accident. Follow this proven framework:
- Define the Objective & Audience: Start with the end in mind. Who will read this report? What decision will it inform? A compliance auditor needs different detail than a department head. Clarify scope before touching any data.
- Identify Key Metrics & Data Sources: Select only the metrics that directly serve the objective. Map each metric to its authoritative data source. Avoid vanity metrics that look impressive but drive no action.
- Choose the Right Format & Layout: Match structure to purpose. Financial reports follow standardized templates; operational reports may use tabular layouts with conditional formatting; executive summaries benefit from visual highlights and bullet points. Prioritize readability over decoration.
- Ensure Data Accuracy & Consistency: Validate data pipelines, apply business rules uniformly, and document assumptions. Inconsistent definitions erode trust faster than any design flaw. Automate calculations wherever possible to reduce human error.
- Design for Clarity, Not Complexity: Use clear headings, consistent typography, and intentional white space. Label axes, add units, and provide context (e.g., YoY change, benchmarks). Every element should earn its place on the page.
- Automate Distribution & Scheduling: Manual report generation doesn’t scale. Use a platform like FineReport to schedule automatic generation, multi-format export (PDF, Excel, email), and role-based delivery. Free your team from repetitive tasks.
- Review, Iterate, and Retire: Solicit feedback regularly. Are users reading the full report or just the summary? Have business priorities shifted? Archive outdated reports and refine active ones. Reporting is a living process, not a one-time project.
Report Examples & Templates
Every business function relies on structured reports to document performance, ensure compliance, and inform strategic decisions. Below are essential report examples organized by industry, each designed to address sector-specific requirements and accelerate your reporting initiatives.
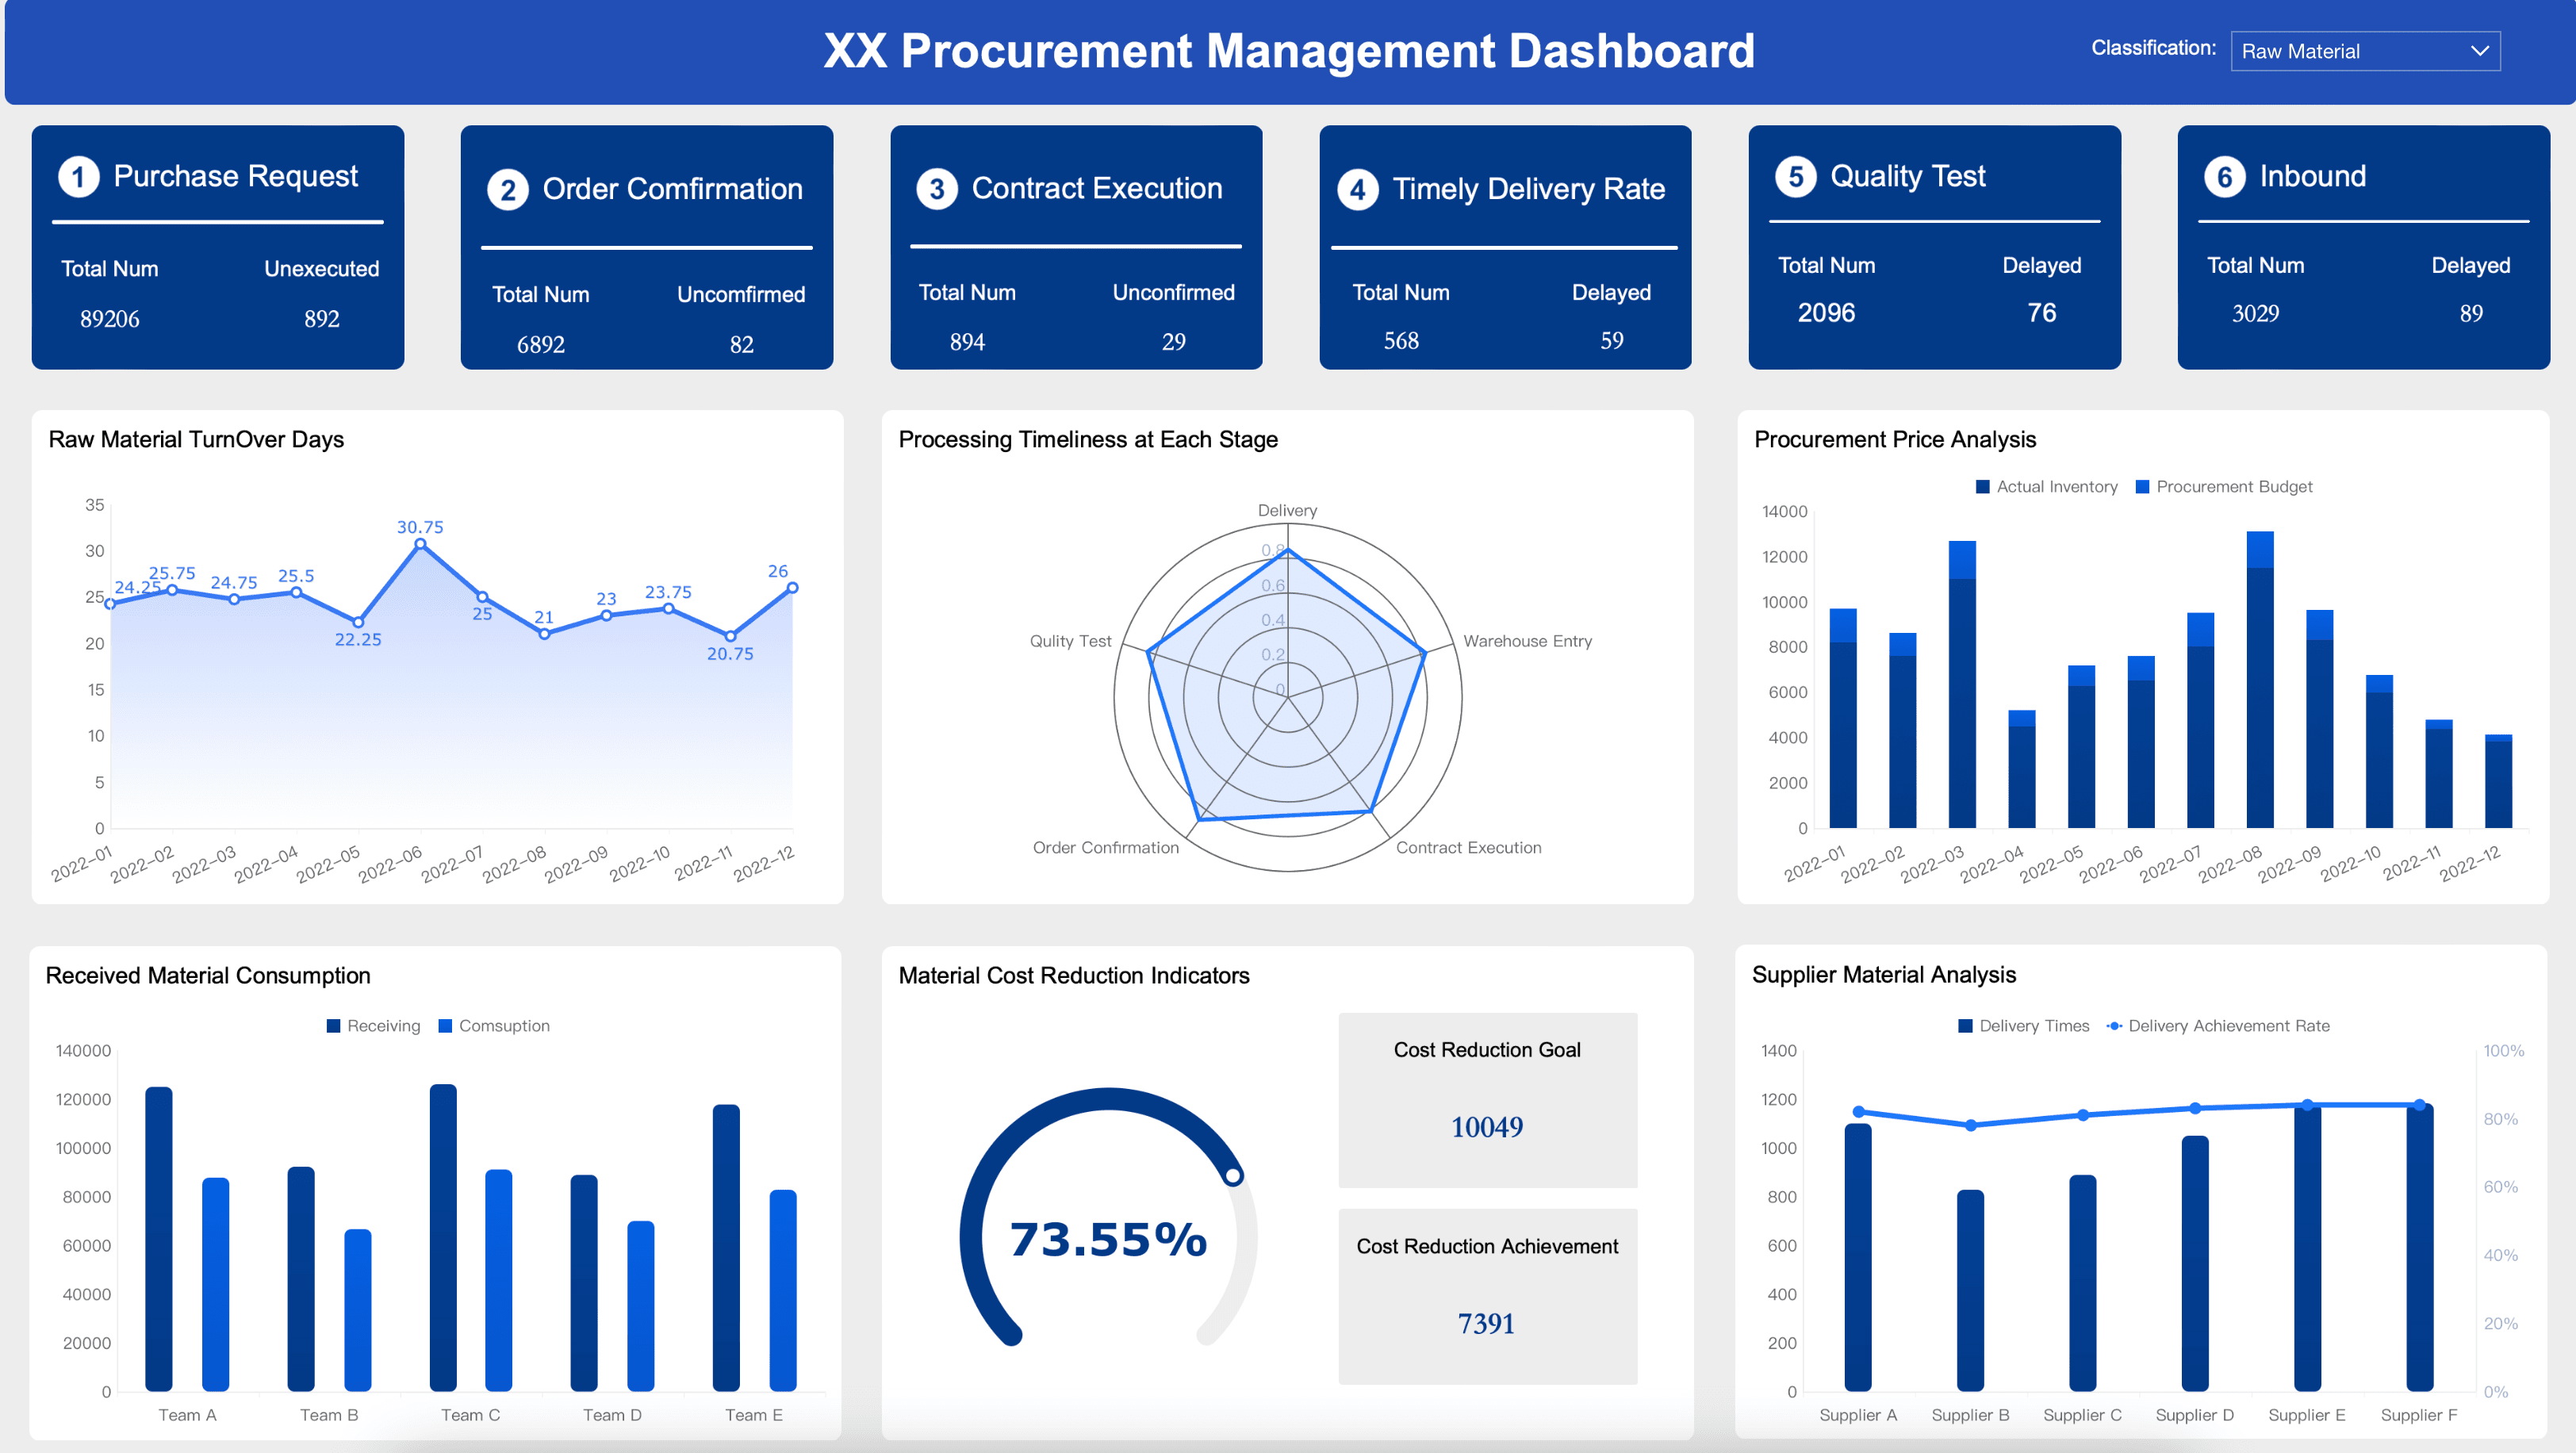
Manufacturing
Manufacturing reports bridge the gap between shop-floor operations and strategic planning, translating machine data, labor logs, and quality inspections into actionable intelligence. These templates help plant managers track OEE, monitor yield rates, document compliance with ISO standards, and identify bottlenecks before they impact delivery schedules—all in formats ready for shift handovers, audit trails, and executive reviews.


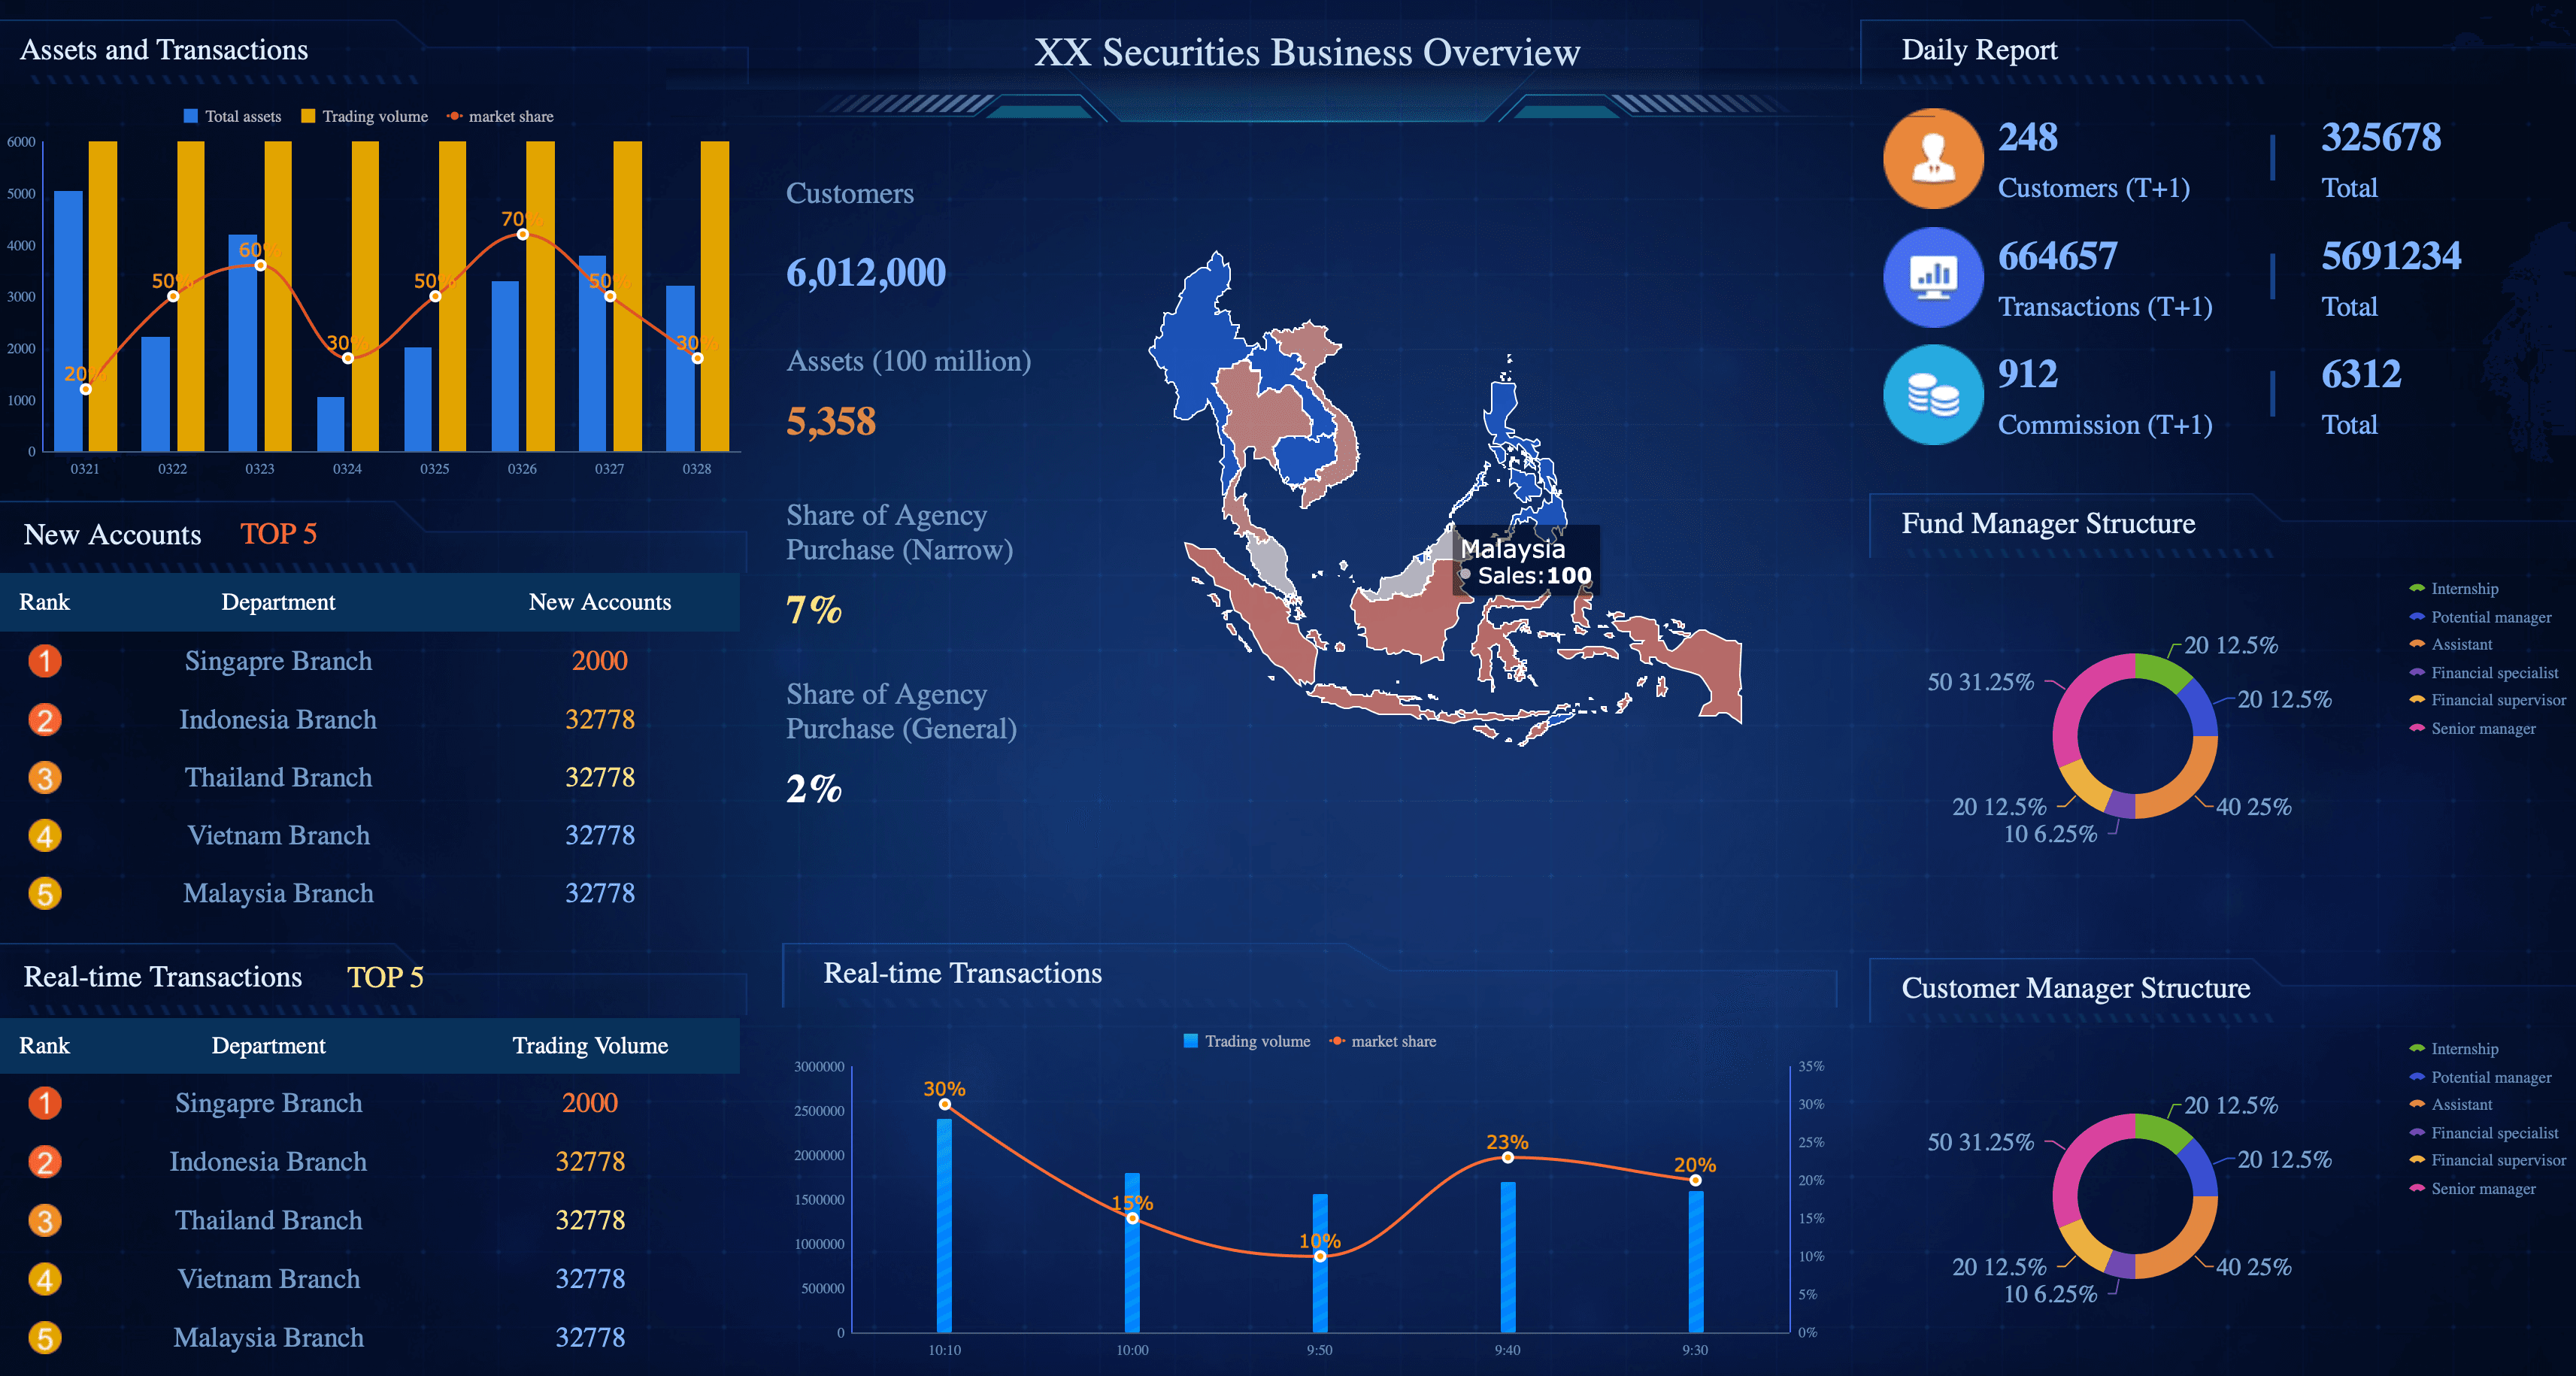
Financial Services
Financial services reporting demands precision, regulatory alignment, and audit-ready documentation. These templates cover everything from GAAP/IFRS-compliant financial statements and loan portfolio aging analyses to AML transaction monitoring and branch profitability scorecards. Each design embeds the controls, disclosures, and traceability required by regulators while enabling finance teams to close books faster and advise stakeholders with confidence.
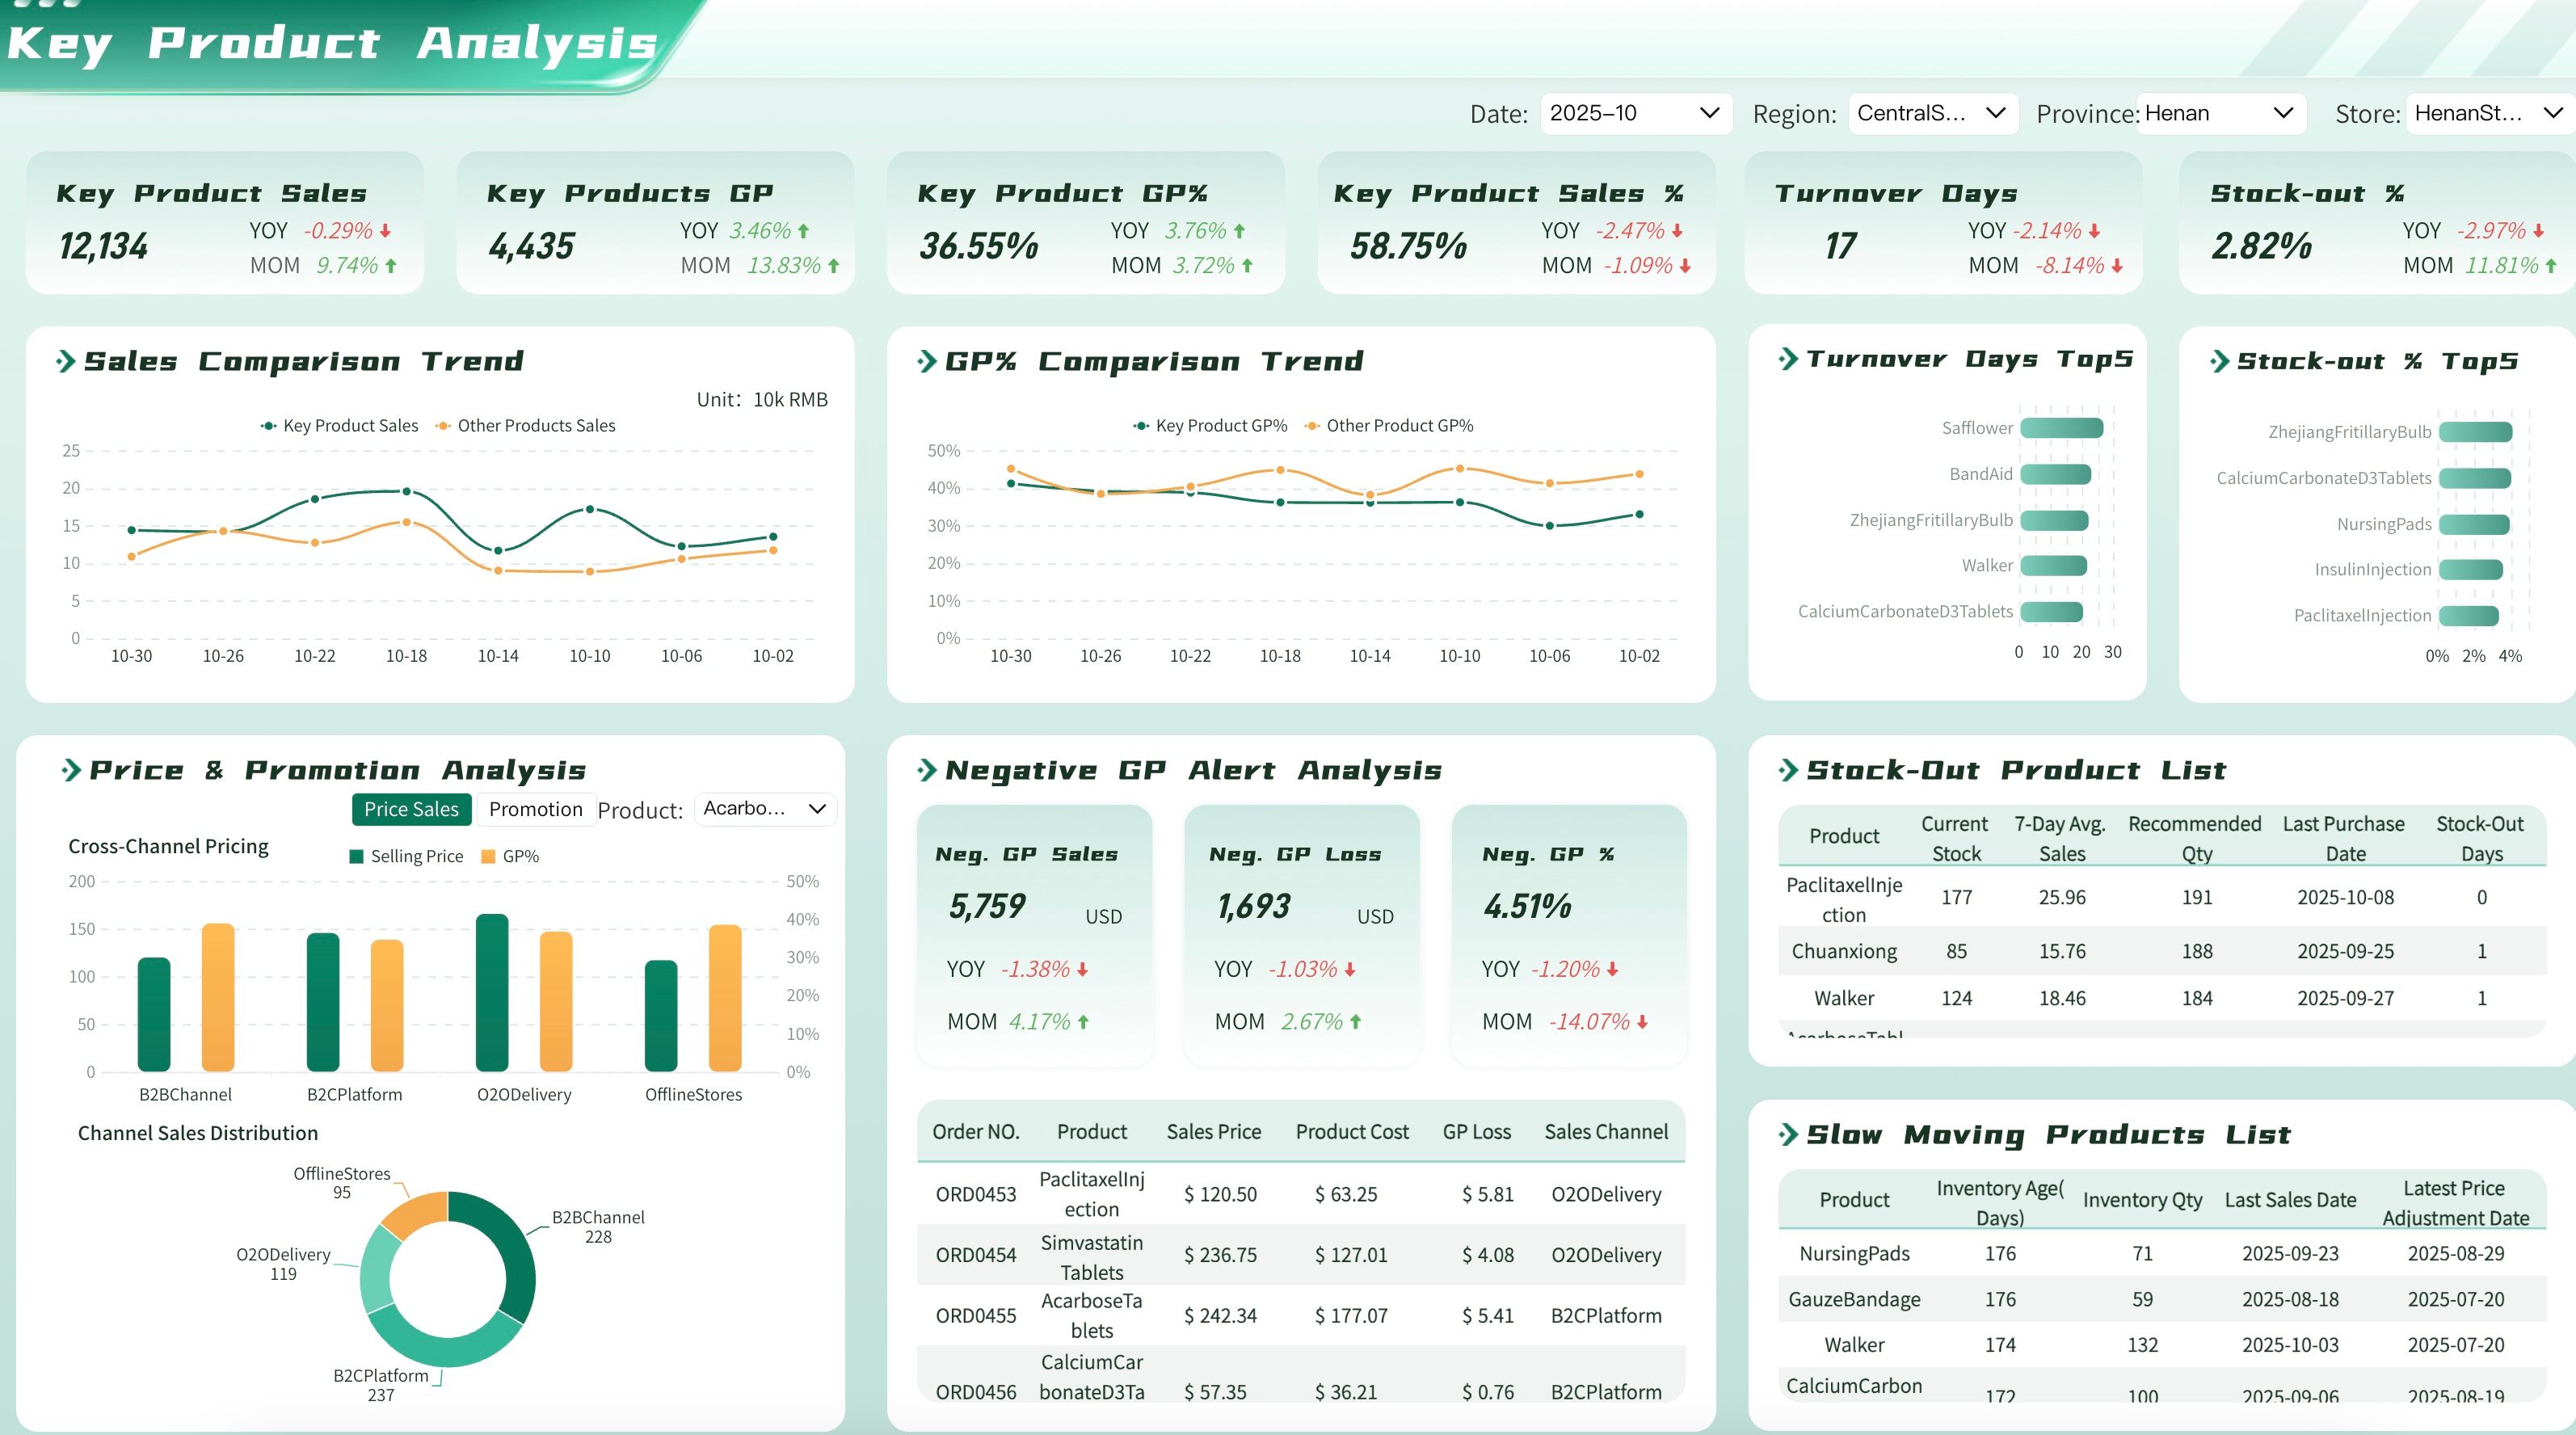
Sales & Marketing
Sales and marketing reports transform campaign data, pipeline metrics, and customer interactions into structured evidence of revenue impact and growth efficiency. These templates help teams track lead conversion funnels, measure PPC and social media ROI, analyze sales performance by region or product, and document attribution models for executive review. Designed to bridge the gap between marketing analytics and sales execution, they replace fragmented spreadsheets with consistent, automated deliverables that align both functions around shared KPIs and accountable outcomes.


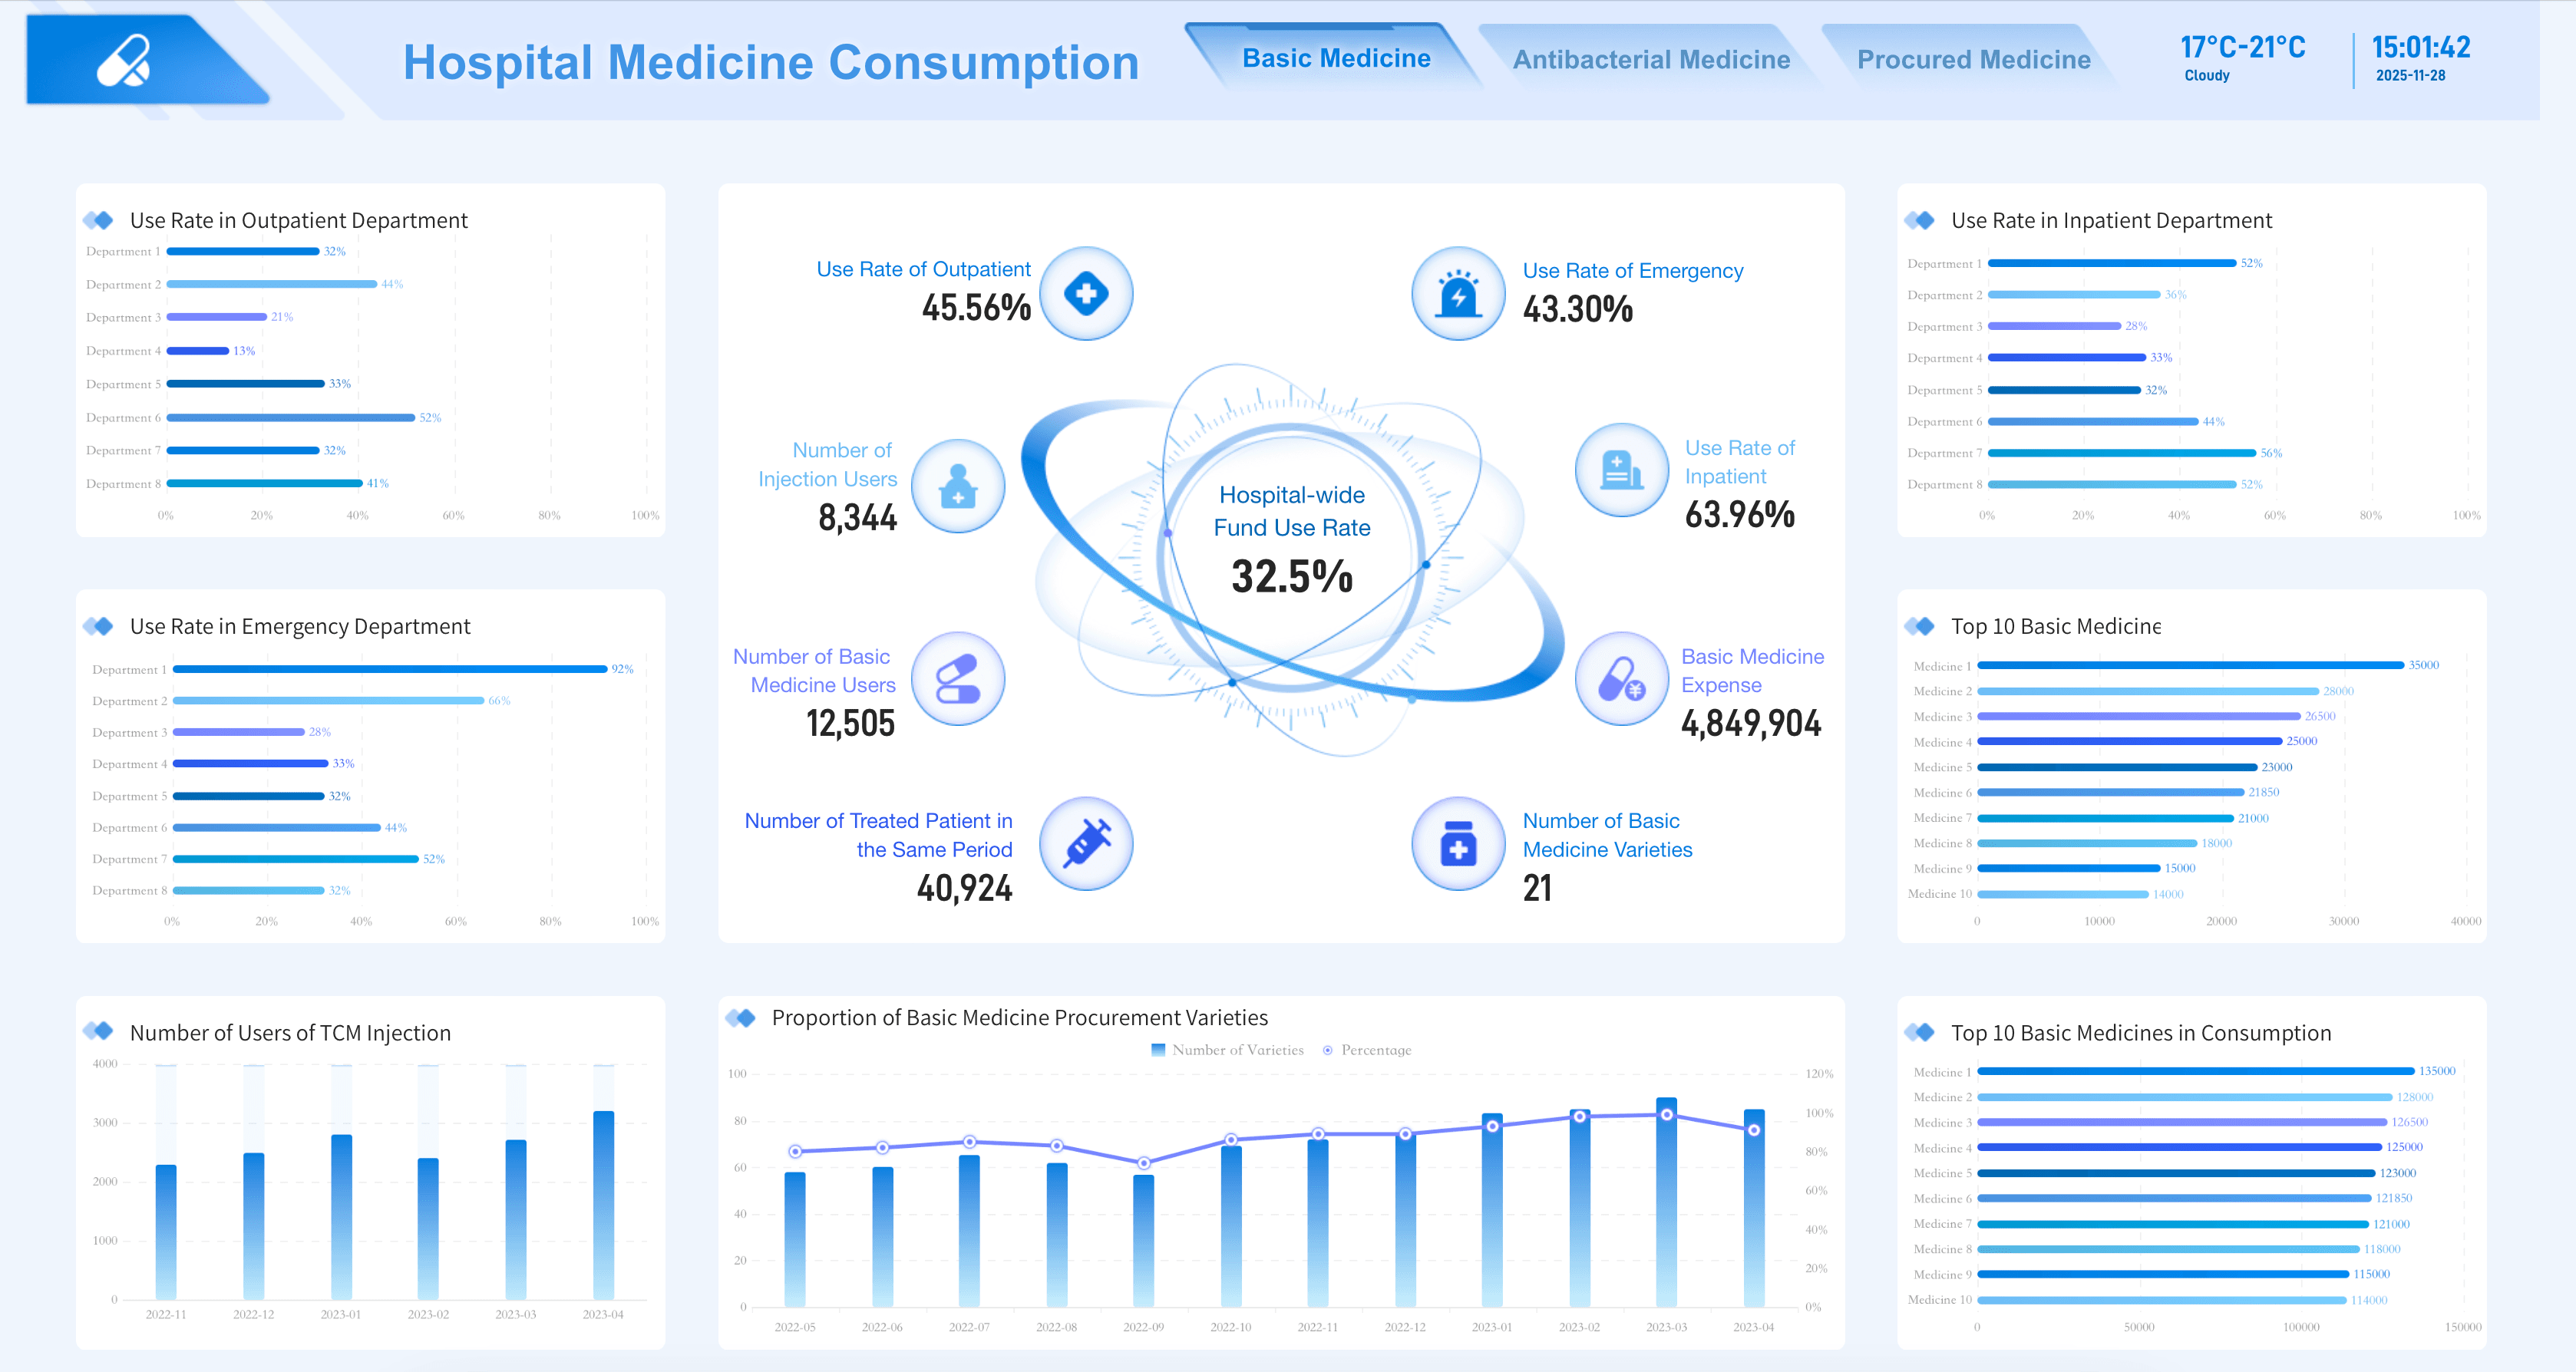
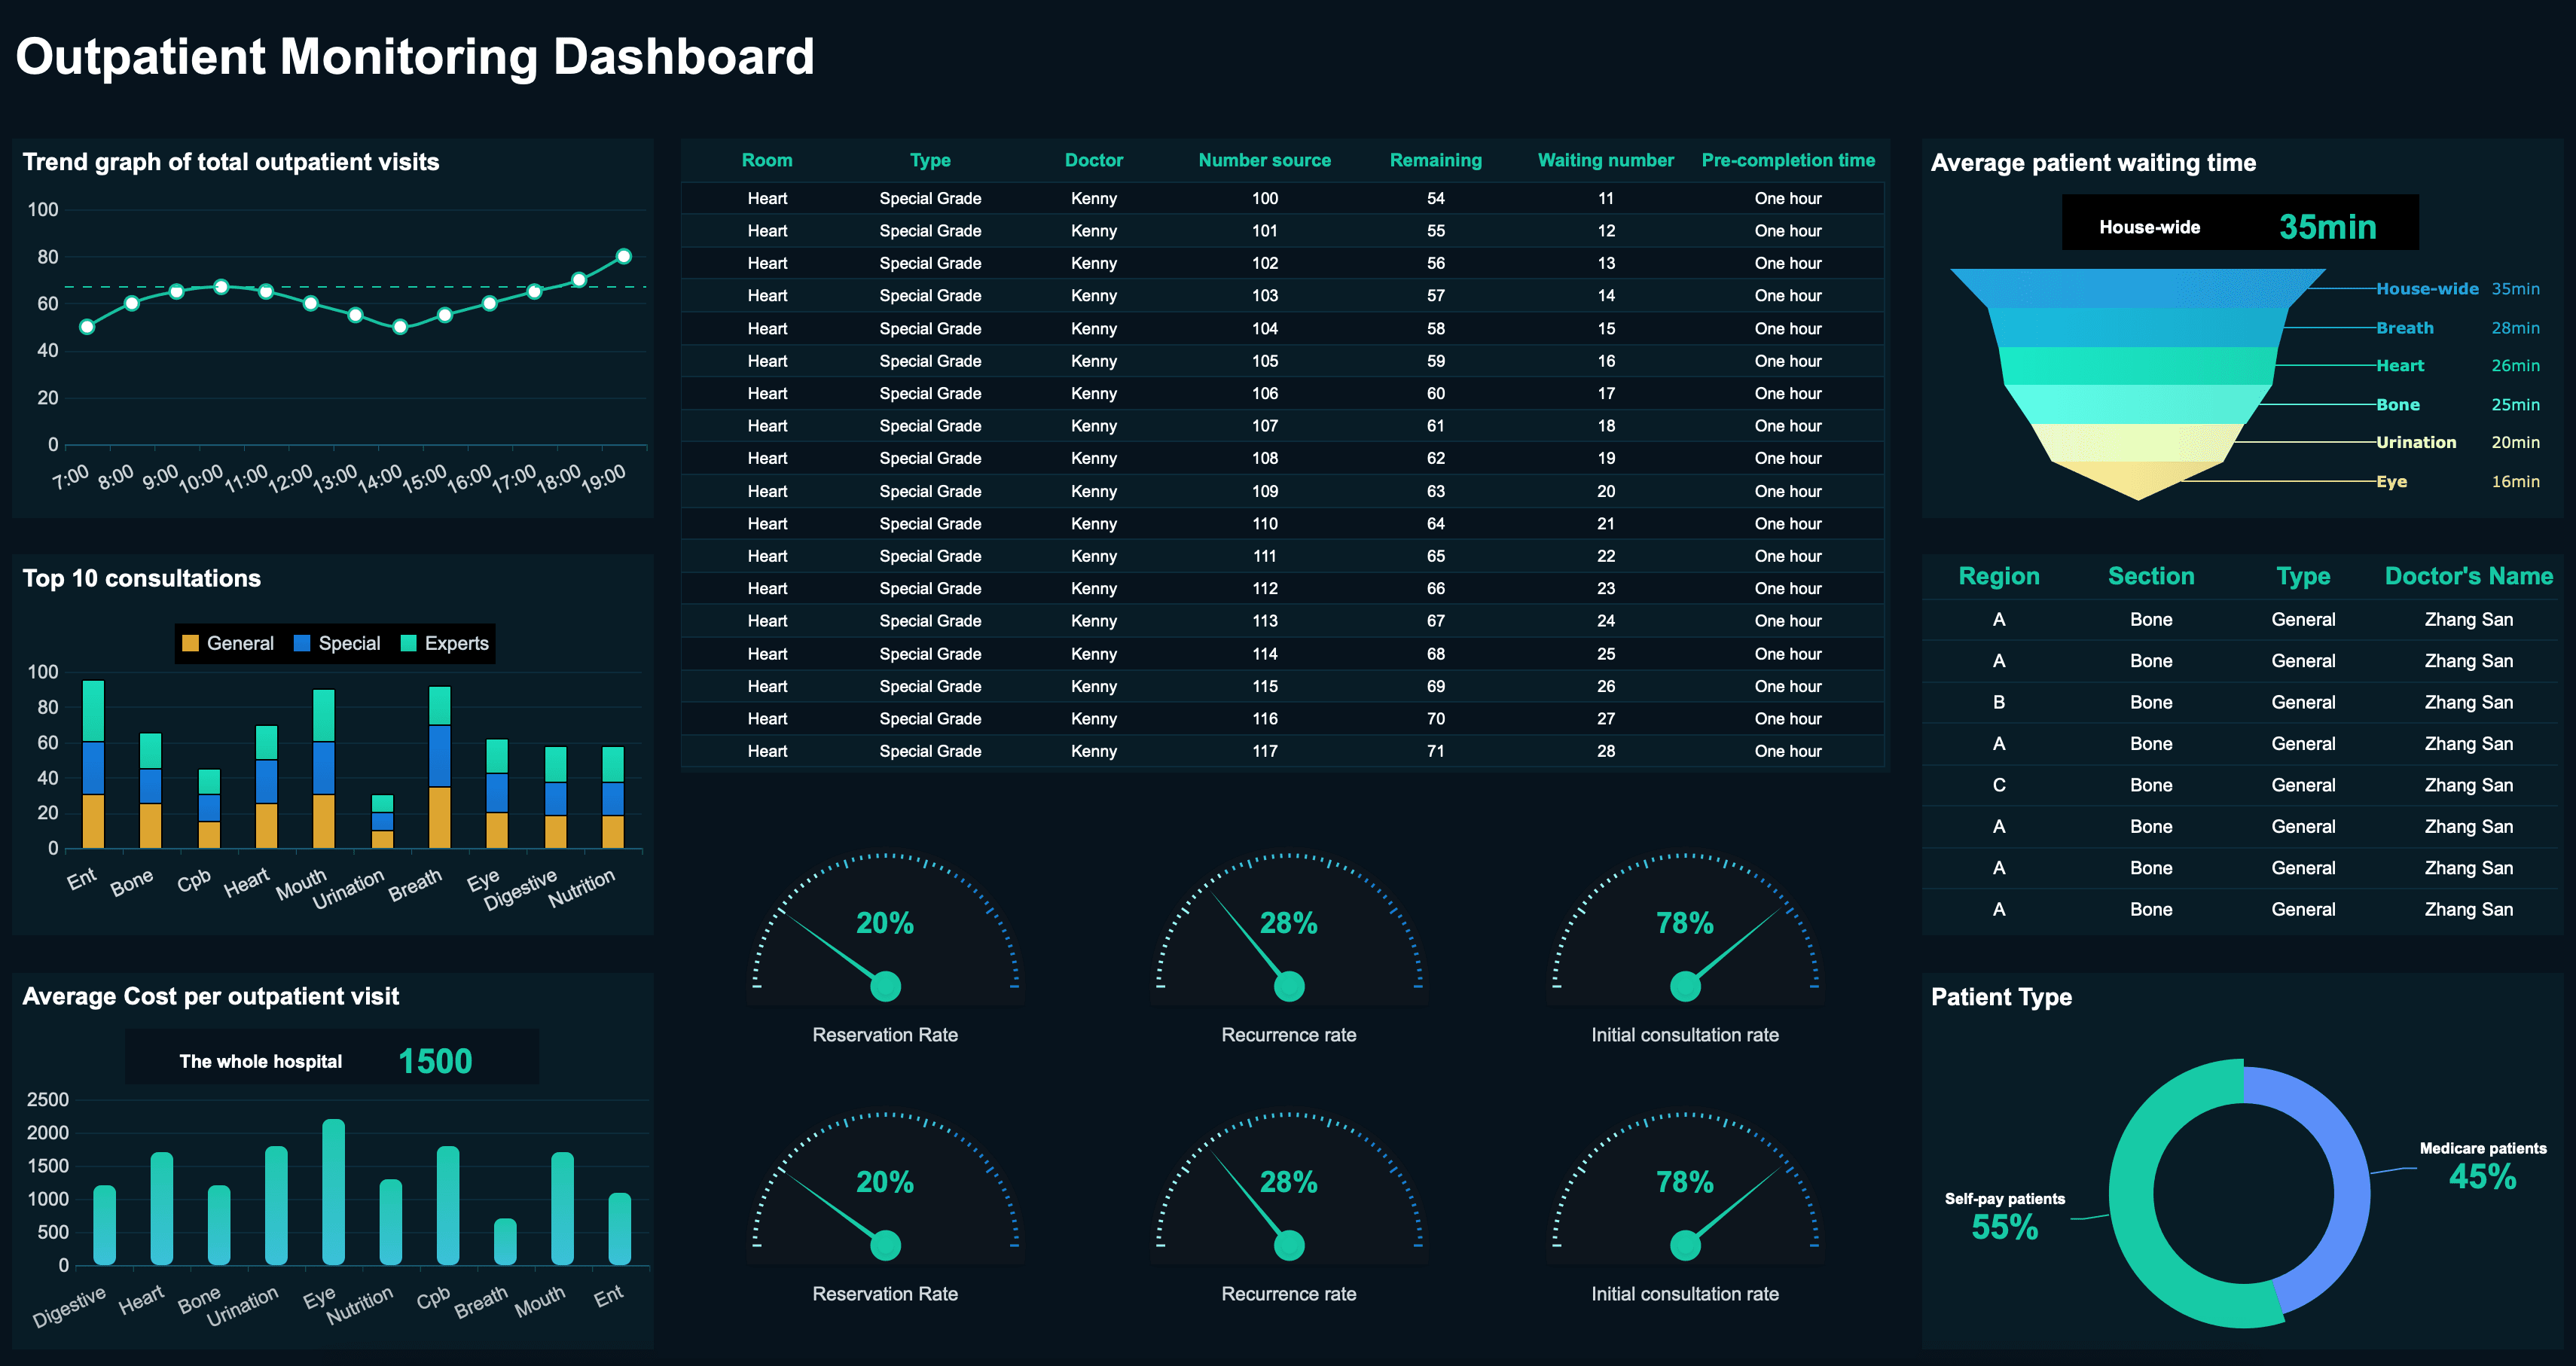
Healthcare
Healthcare reporting balances clinical outcomes, operational efficiency, and stringent regulatory requirements. These templates support patient satisfaction tracking, staffing ratio compliance, revenue cycle denial analysis, and quality metric reporting for CMS or accreditation bodies. Designed with HIPAA-aligned security and audit trails, they enable administrators to improve care delivery, manage costs, and demonstrate compliance without compromising data integrity.


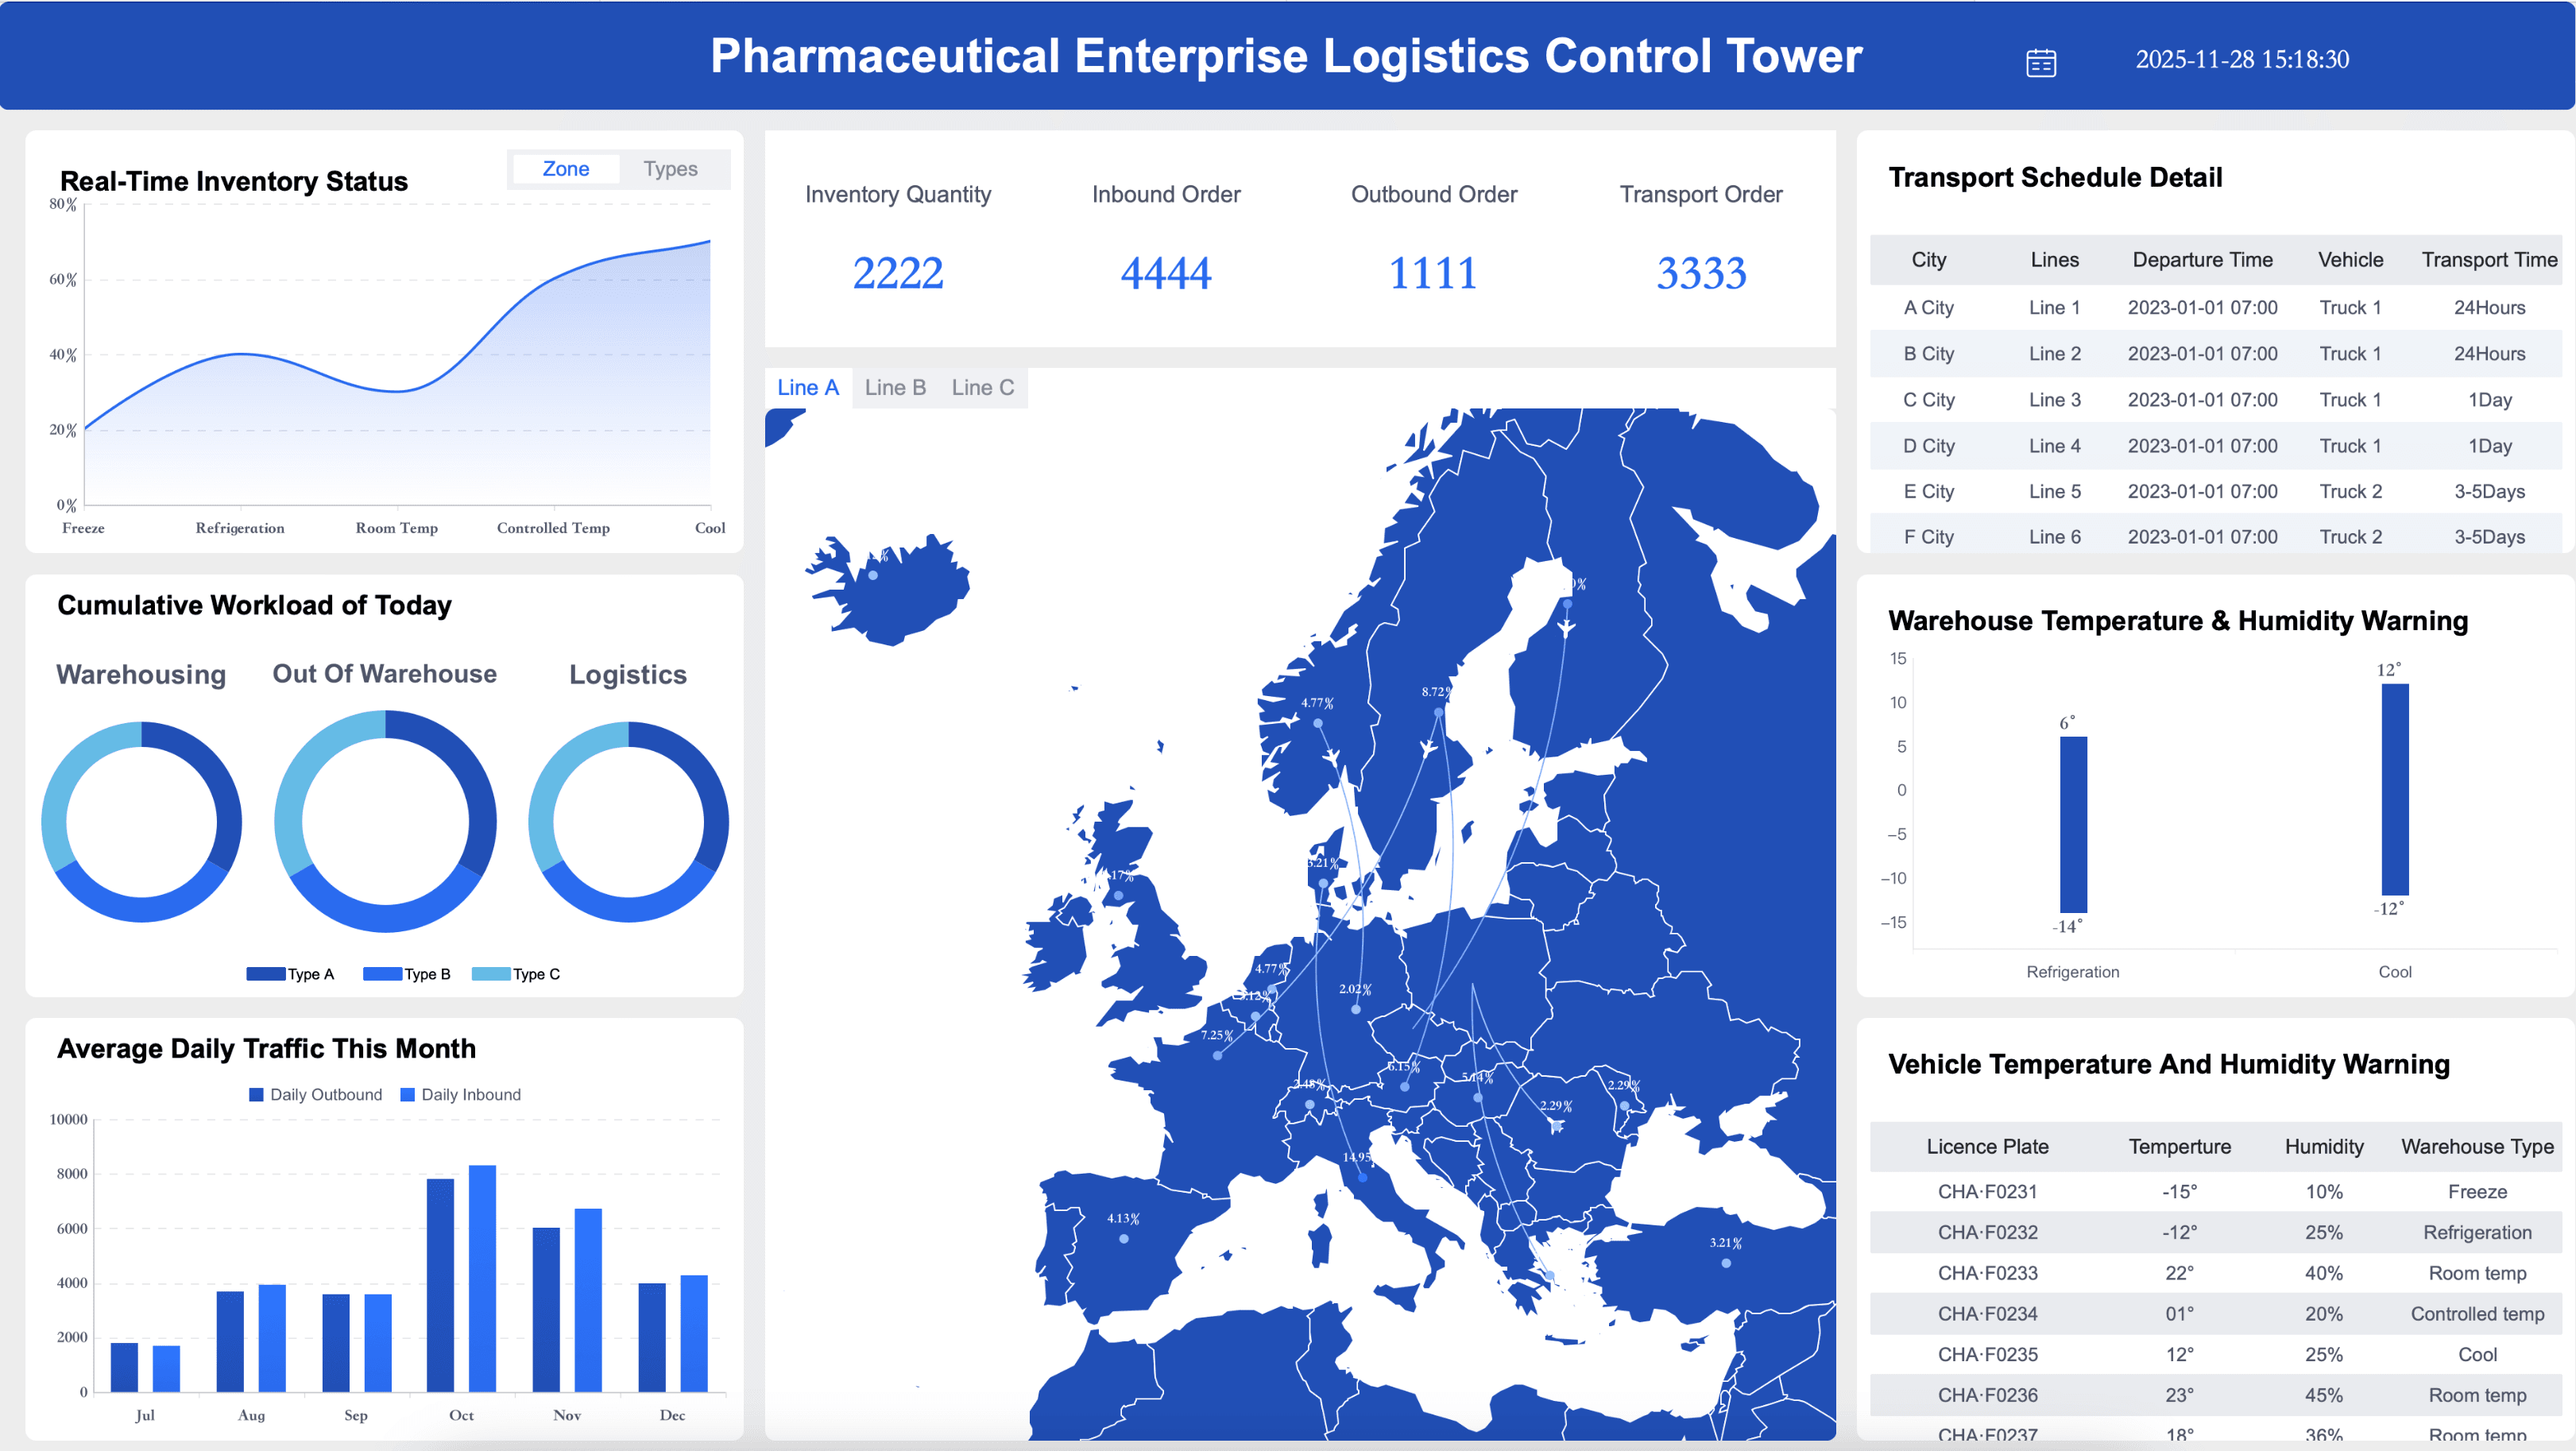
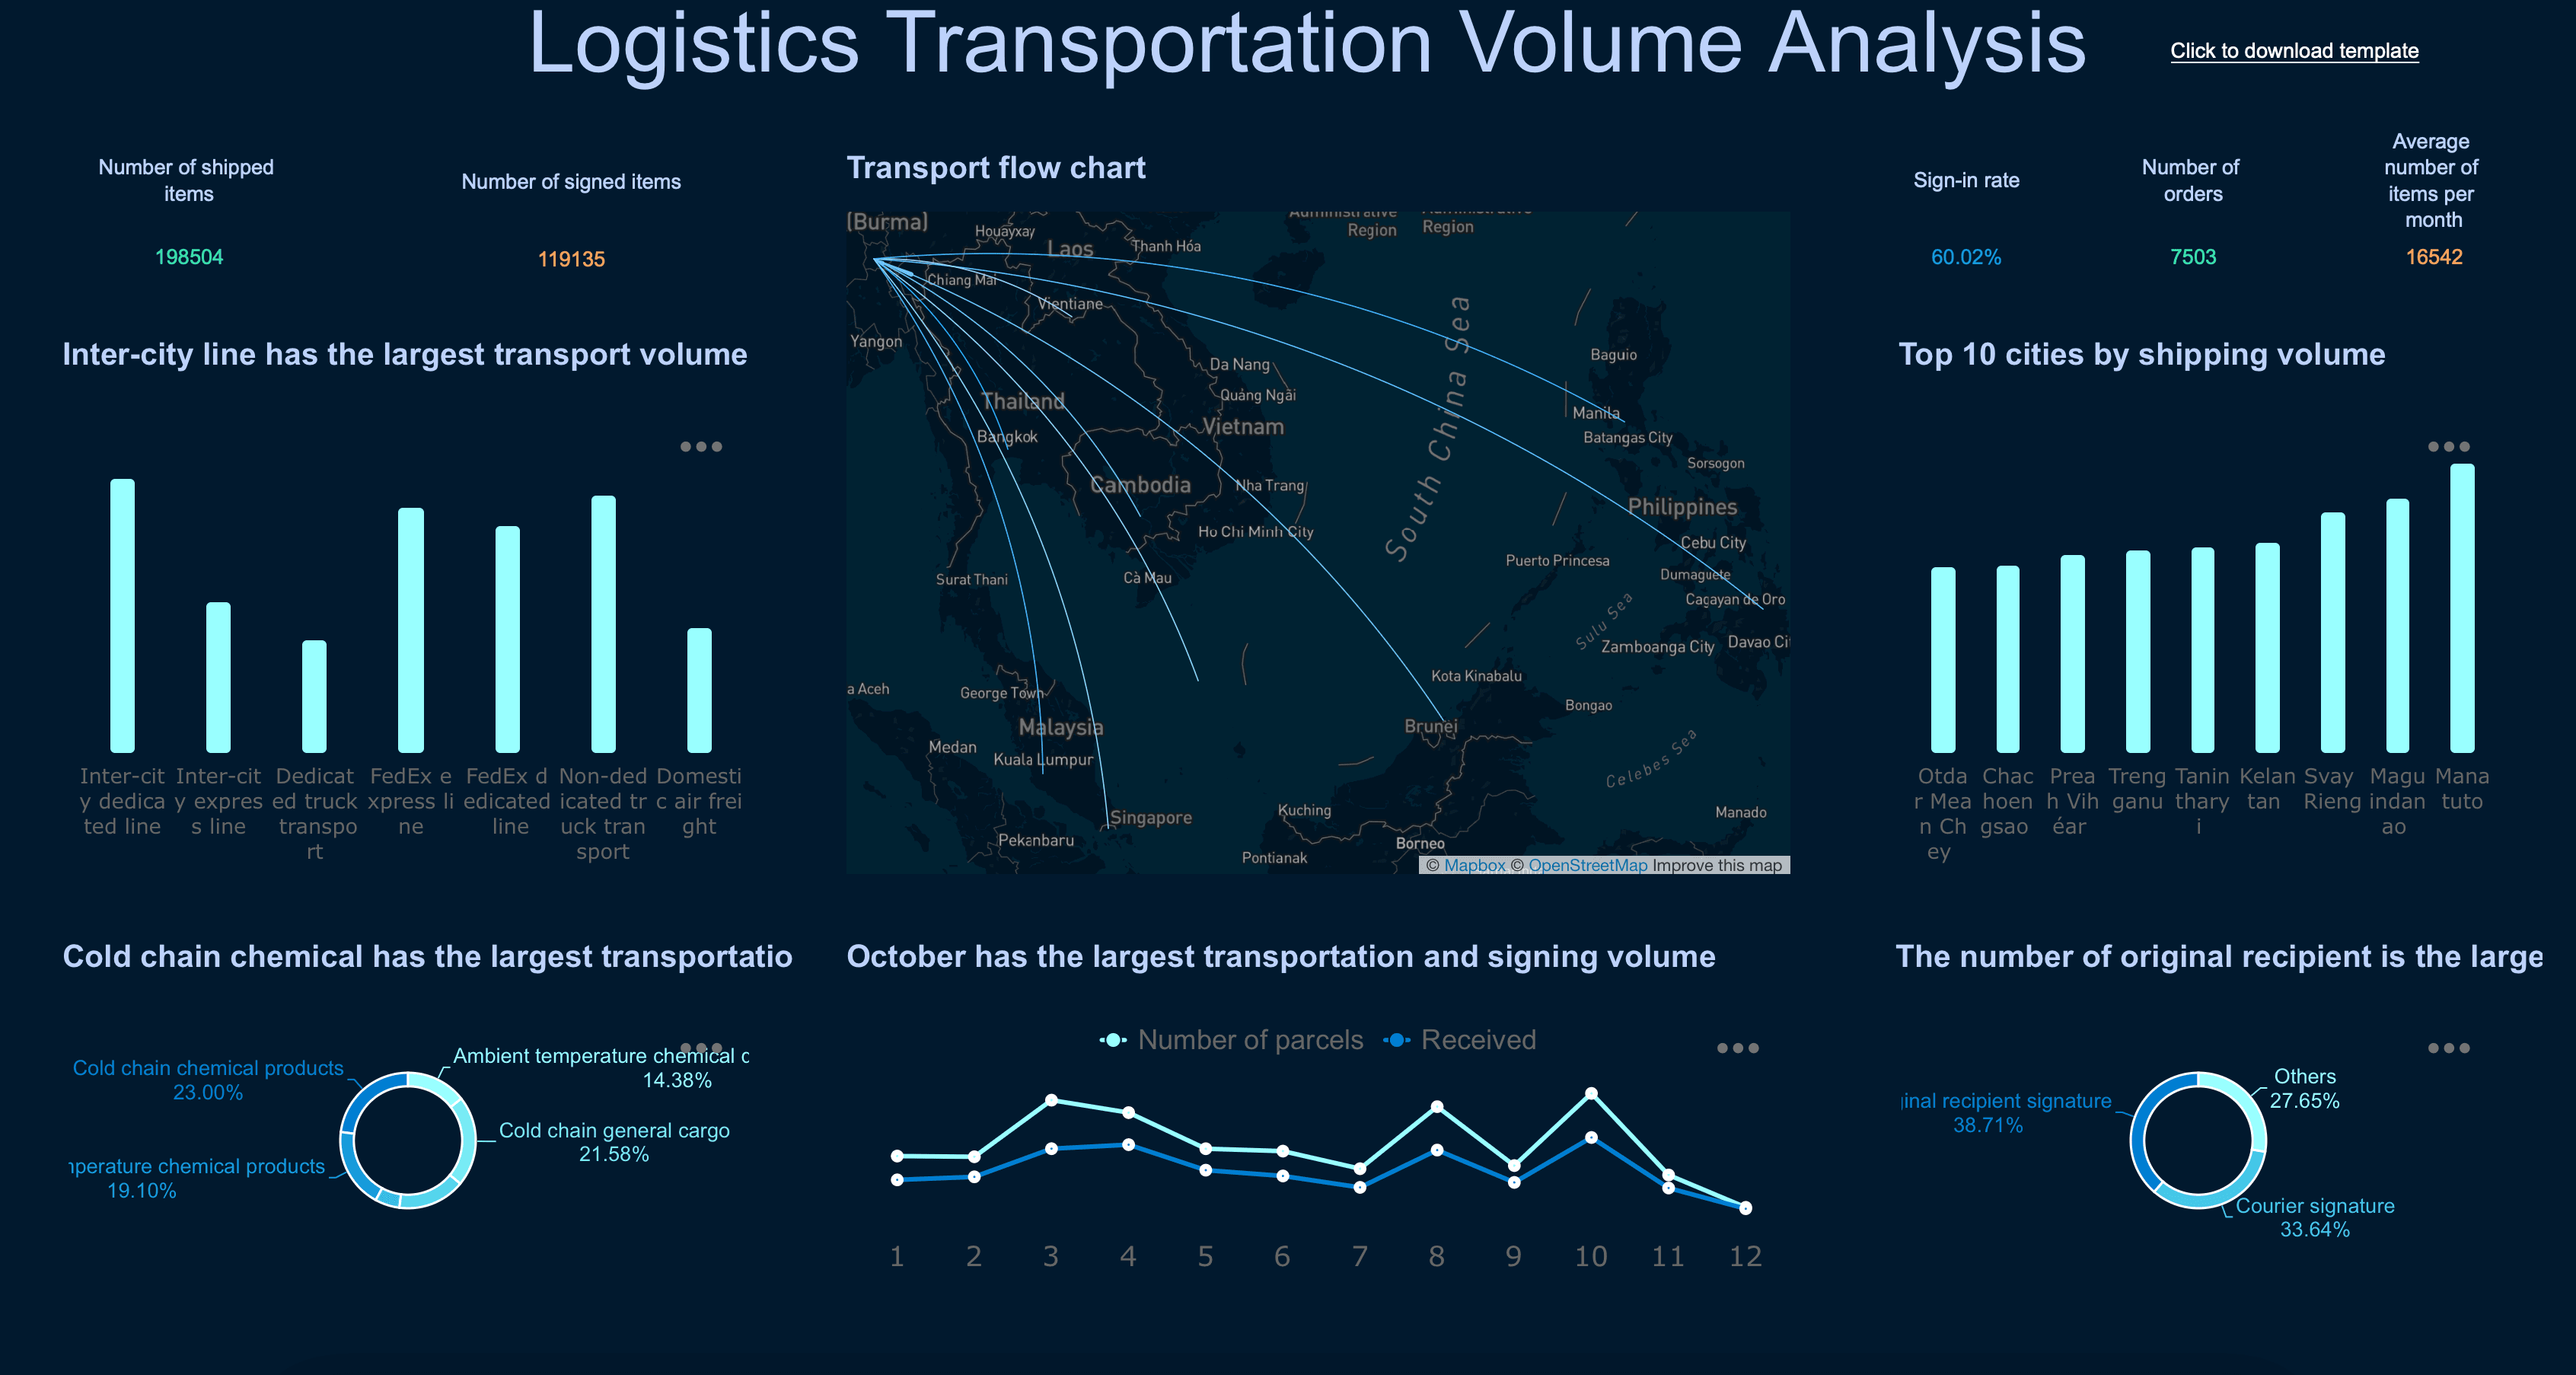
Transportation & Logistics
Transportation and logistics reports transform fleet telemetry, shipment records, and warehouse data into structured insights that keep supply chains moving. These templates help operators monitor on-time delivery rates, analyze freight cost per unit, document safety incidents, and optimize route efficiency. Built for both daily dispatch reviews and quarterly carrier negotiations, they provide the visibility needed to reduce delays, control expenses, and meet service-level agreements.

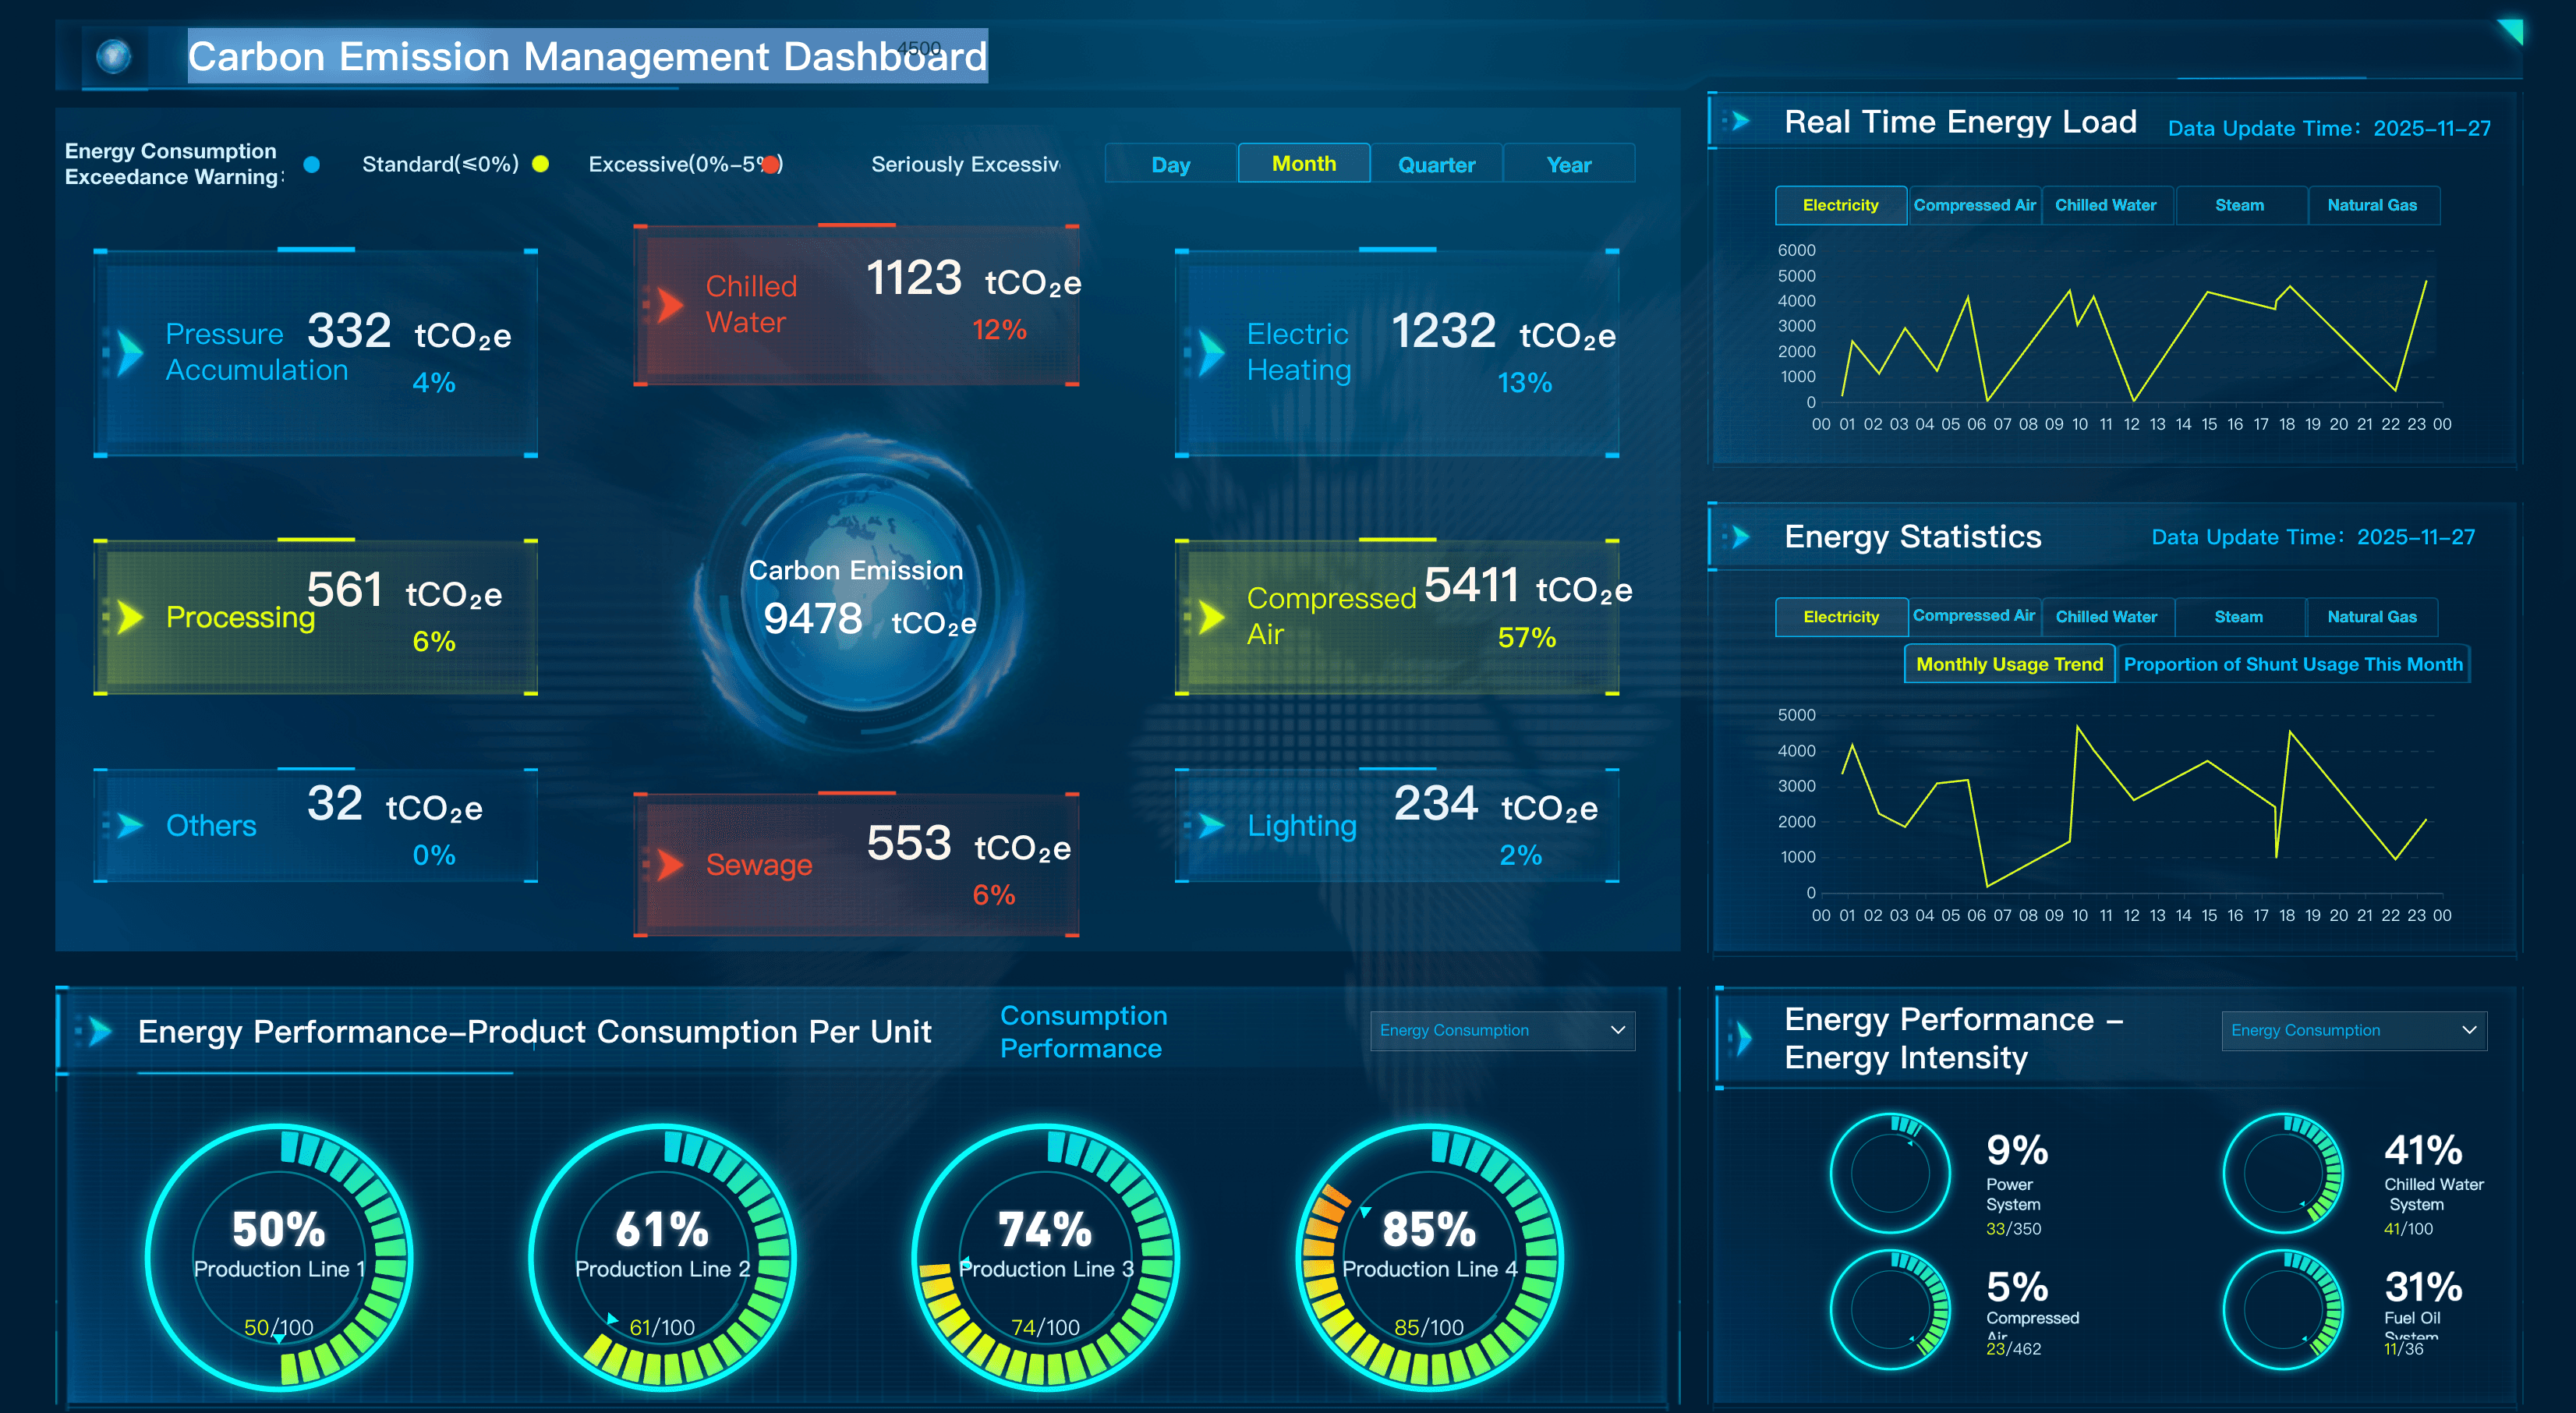
Energy & Utilities
Energy and utilities reporting must satisfy operational, environmental, and regulatory stakeholders simultaneously. These templates cover generation output tracking, grid reliability metrics, ESG emissions disclosures, and capital project expenditure reports. Engineered for high-volume sensor data and complex compliance frameworks, they enable utilities to maintain asset performance, demonstrate sustainability commitments, and justify infrastructure investments with auditable evidence.


General Business
General business reports serve as the universal language of organizational performance, applicable across functions and industries. These templates cover cross-functional needs such as budget vs. actuals, project status updates, HR headcount analytics, and vendor scorecards. Flexible and easily customized, they provide a foundation for any team seeking to replace ad-hoc spreadsheets with consistent, automated, and professionally formatted reporting that scales with the business.


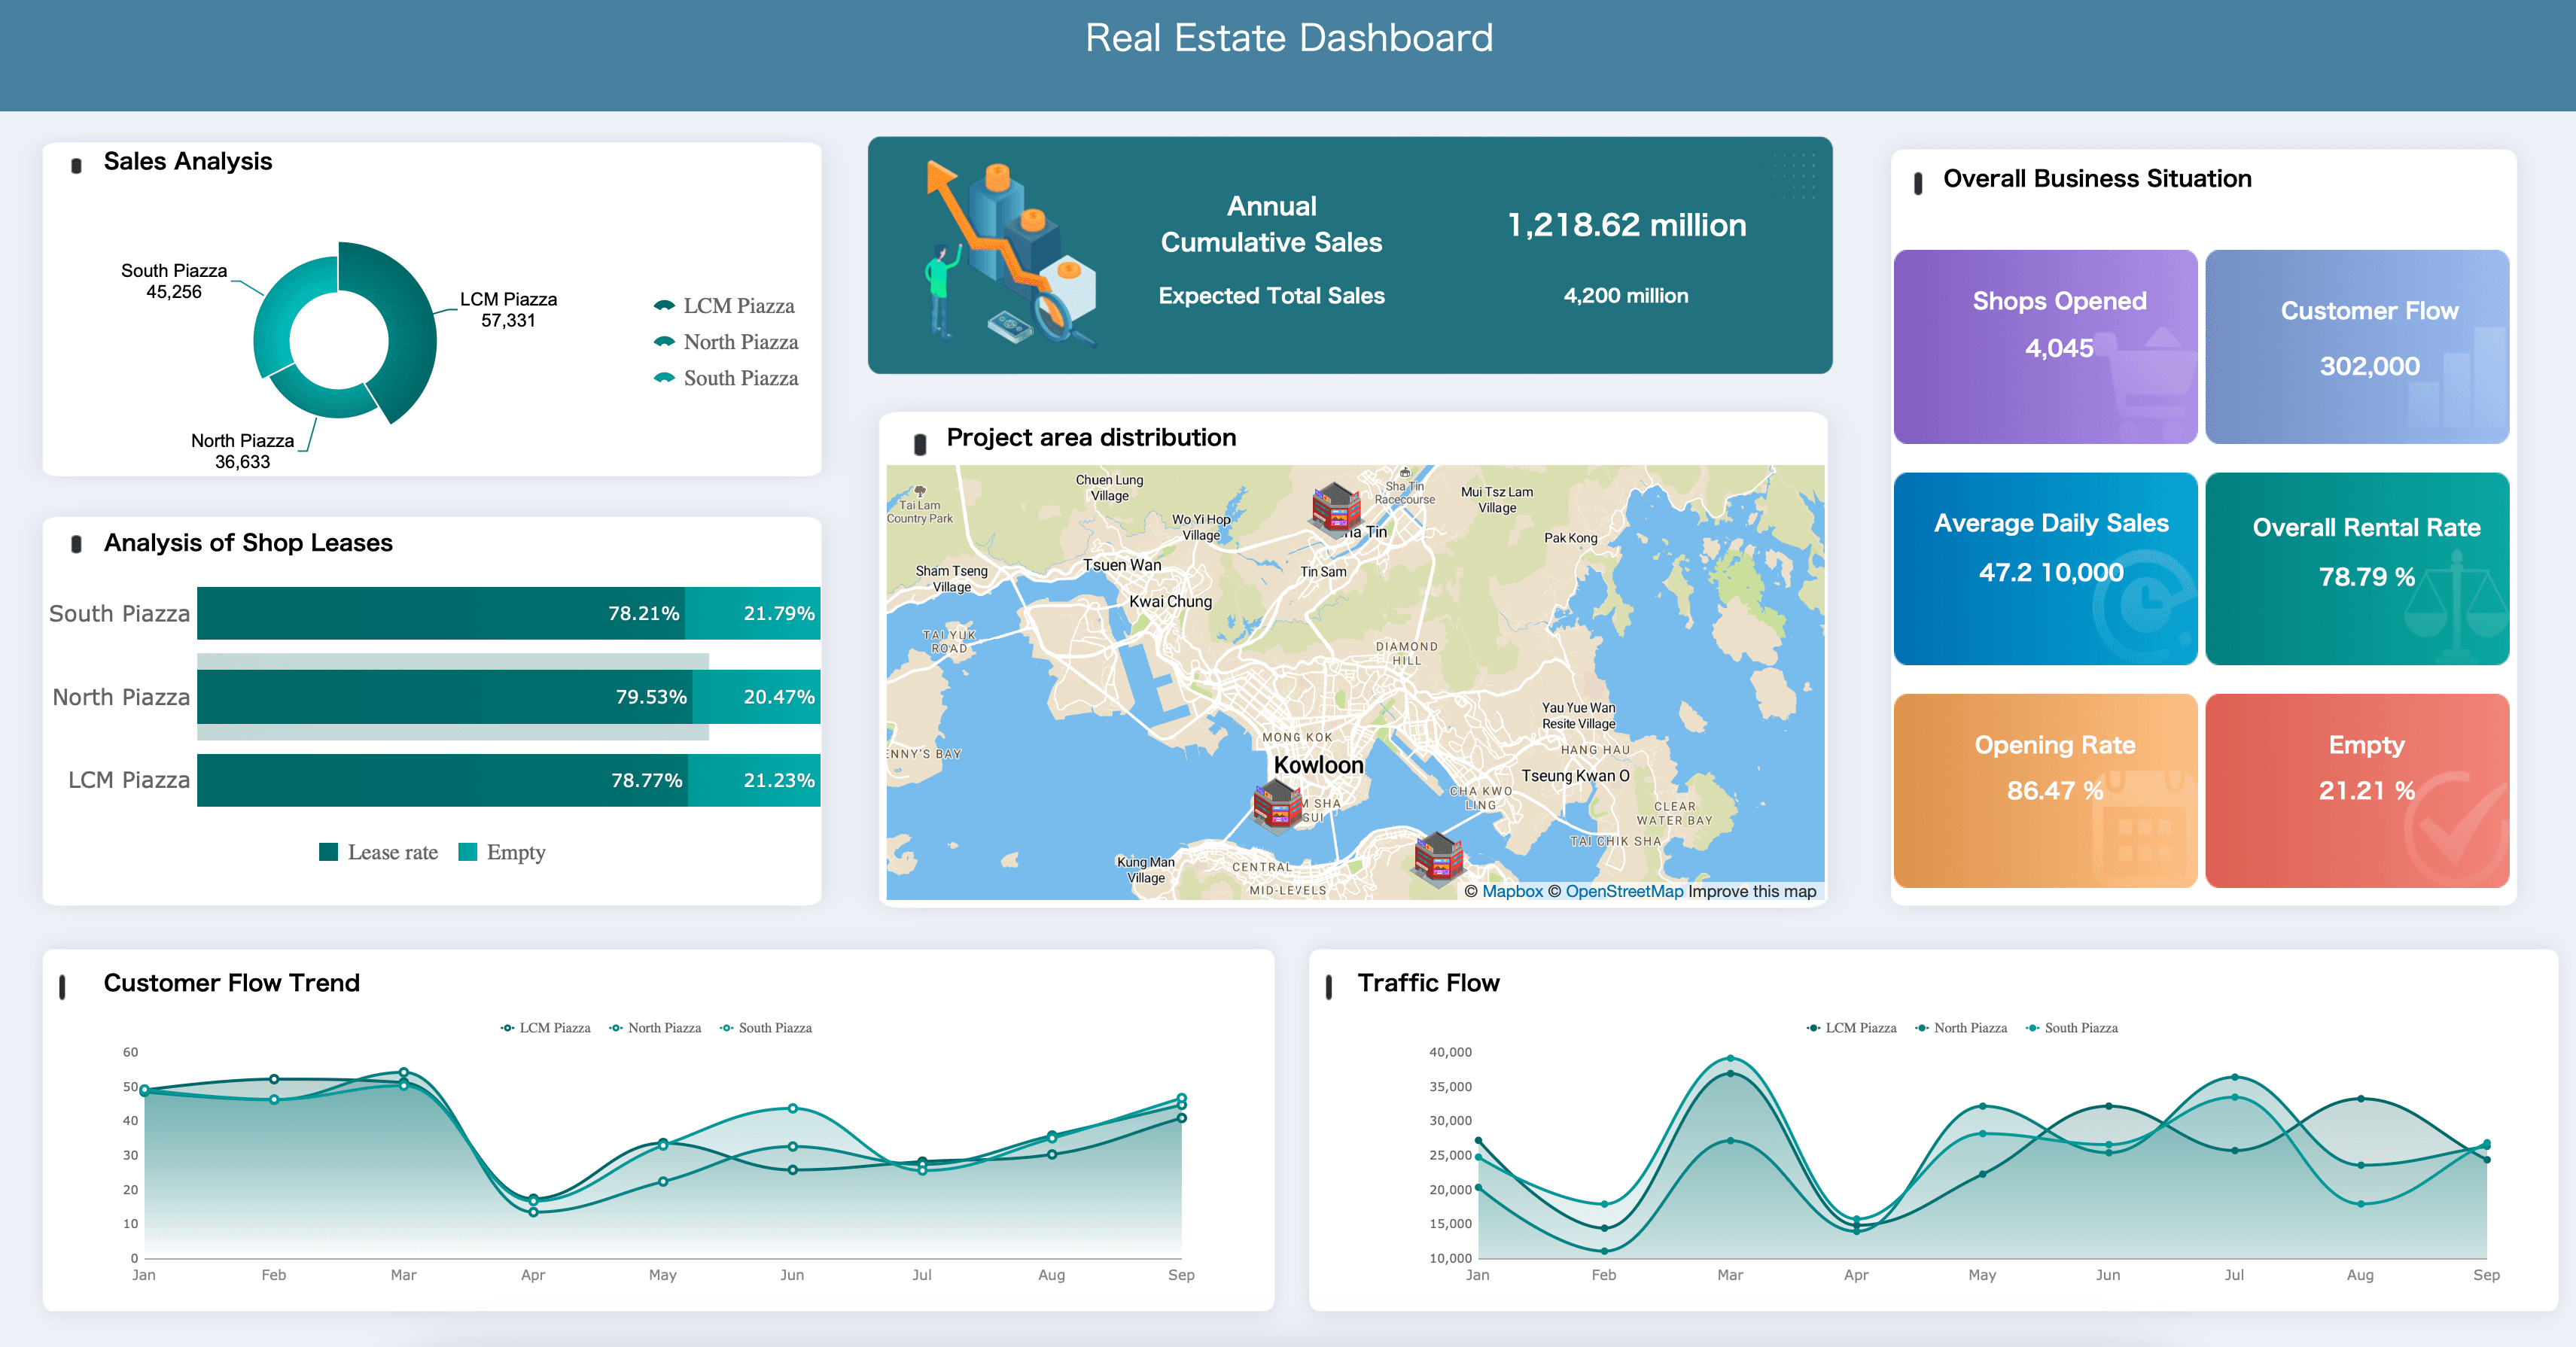
Real Estate
Real estate reports consolidate property performance, tenant data, and financial metrics into standardized deliverables for investors, lenders, and asset managers. These templates include rent roll summaries, occupancy trend analyses, CAM reconciliation reports, and development budget trackers. Designed to align with industry accounting standards and investor expectations, they streamline portfolio reviews, support valuation models, and enhance transparency across stakeholder groups.


FAQs
Reporting software is a business application that collects, organizes, analyzes, and presents data in report formats for decision-making and operational management.
Dashboards provide real-time visual monitoring of KPIs, while reports offer detailed and structured analysis of business data.
Yes. Reporting is one of the core components of Business Intelligence. It delivers structured information, while BI provides deeper analytical capabilities.
Absolutely. Modern reporting software can automatically generate, refresh, schedule, and distribute reports without manual intervention.
Reporting software is widely used across manufacturing, retail, healthcare, finance, government, education, telecommunications, and many other industries.
Key capabilities include:
- Multi-source data integration
- Pixel-perfect report design
- Report scheduling
- Permission management
- Export and printing support
- Mobile accessibility
- Interactive drill-down analysis
- Enterprise-level scalability
While BI and AI provide advanced analytics, organizations still require standardized reports for operational management, compliance, auditing, governance, and executive communication. Reporting remains the foundation of trustworthy business information.
