An email marketing report is not just a scorecard. It is an operating tool that helps campaign managers spot performance issues early, gives leadership a clean view of business impact, and shows clients what changed, why it changed, and what should happen next. If your team is still exporting scattered ESP screenshots into slides or sending raw metrics without context, you are creating reporting friction instead of decision support.
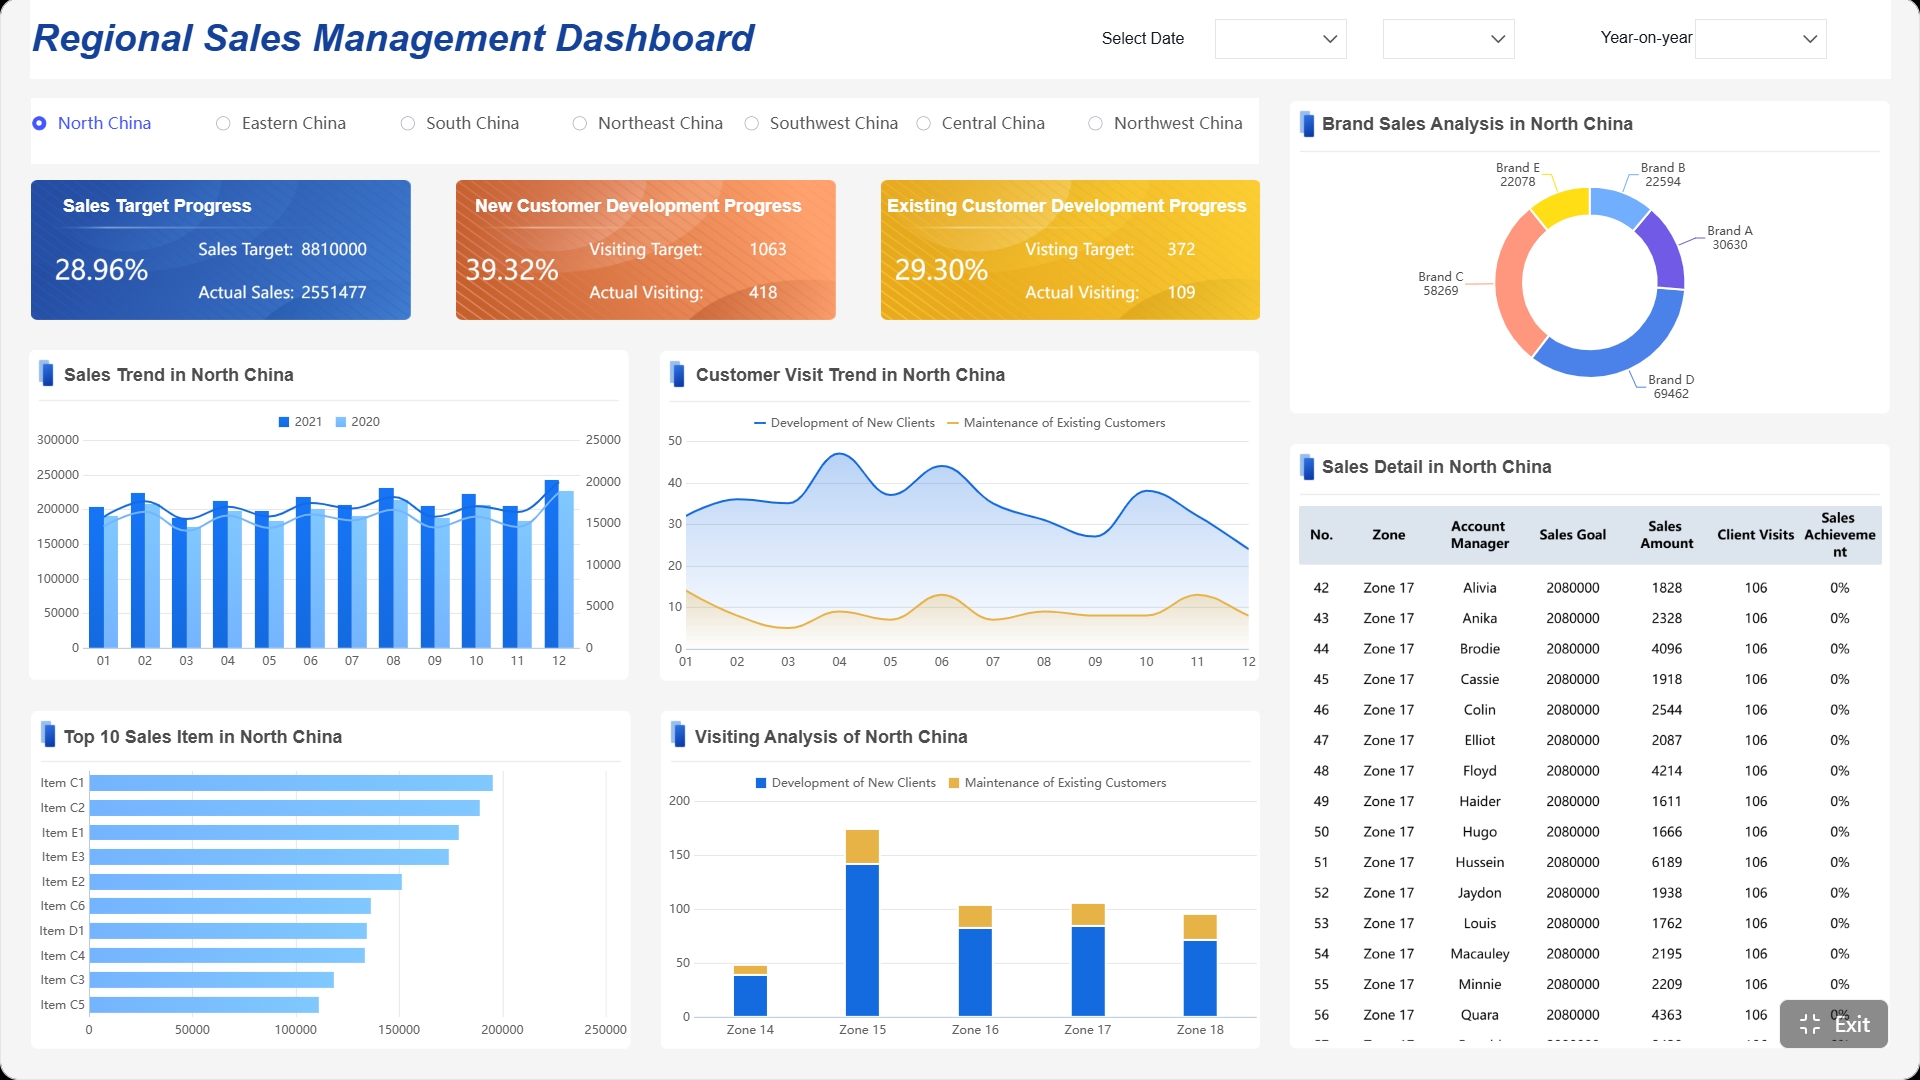
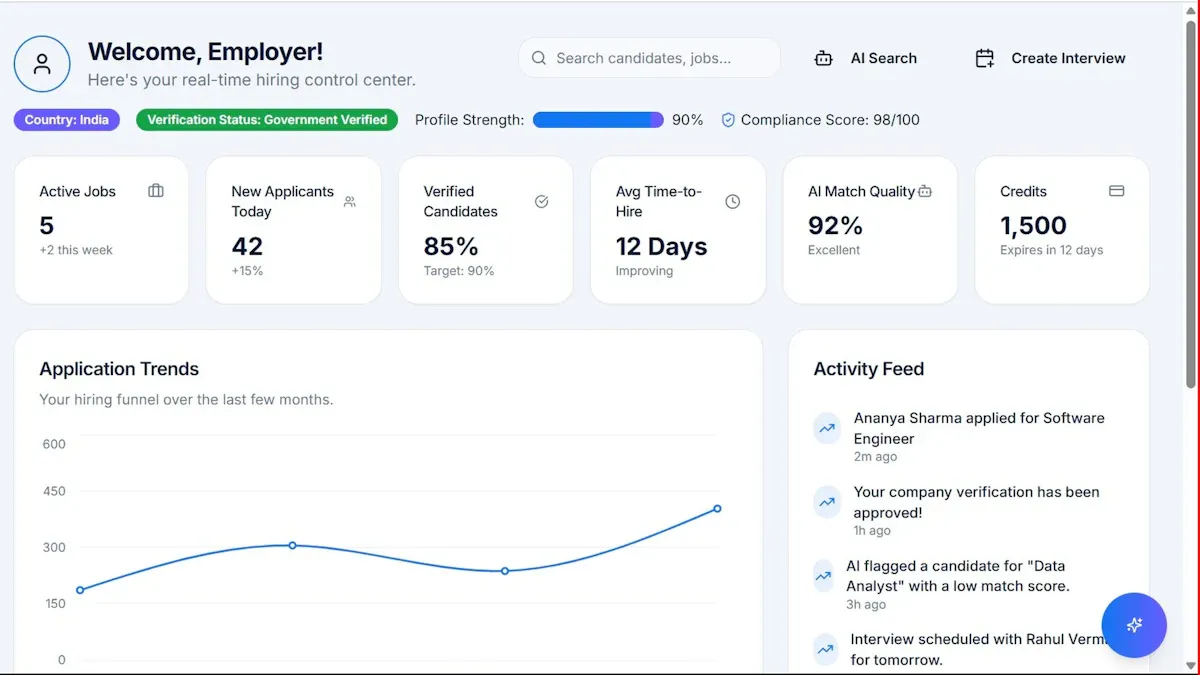
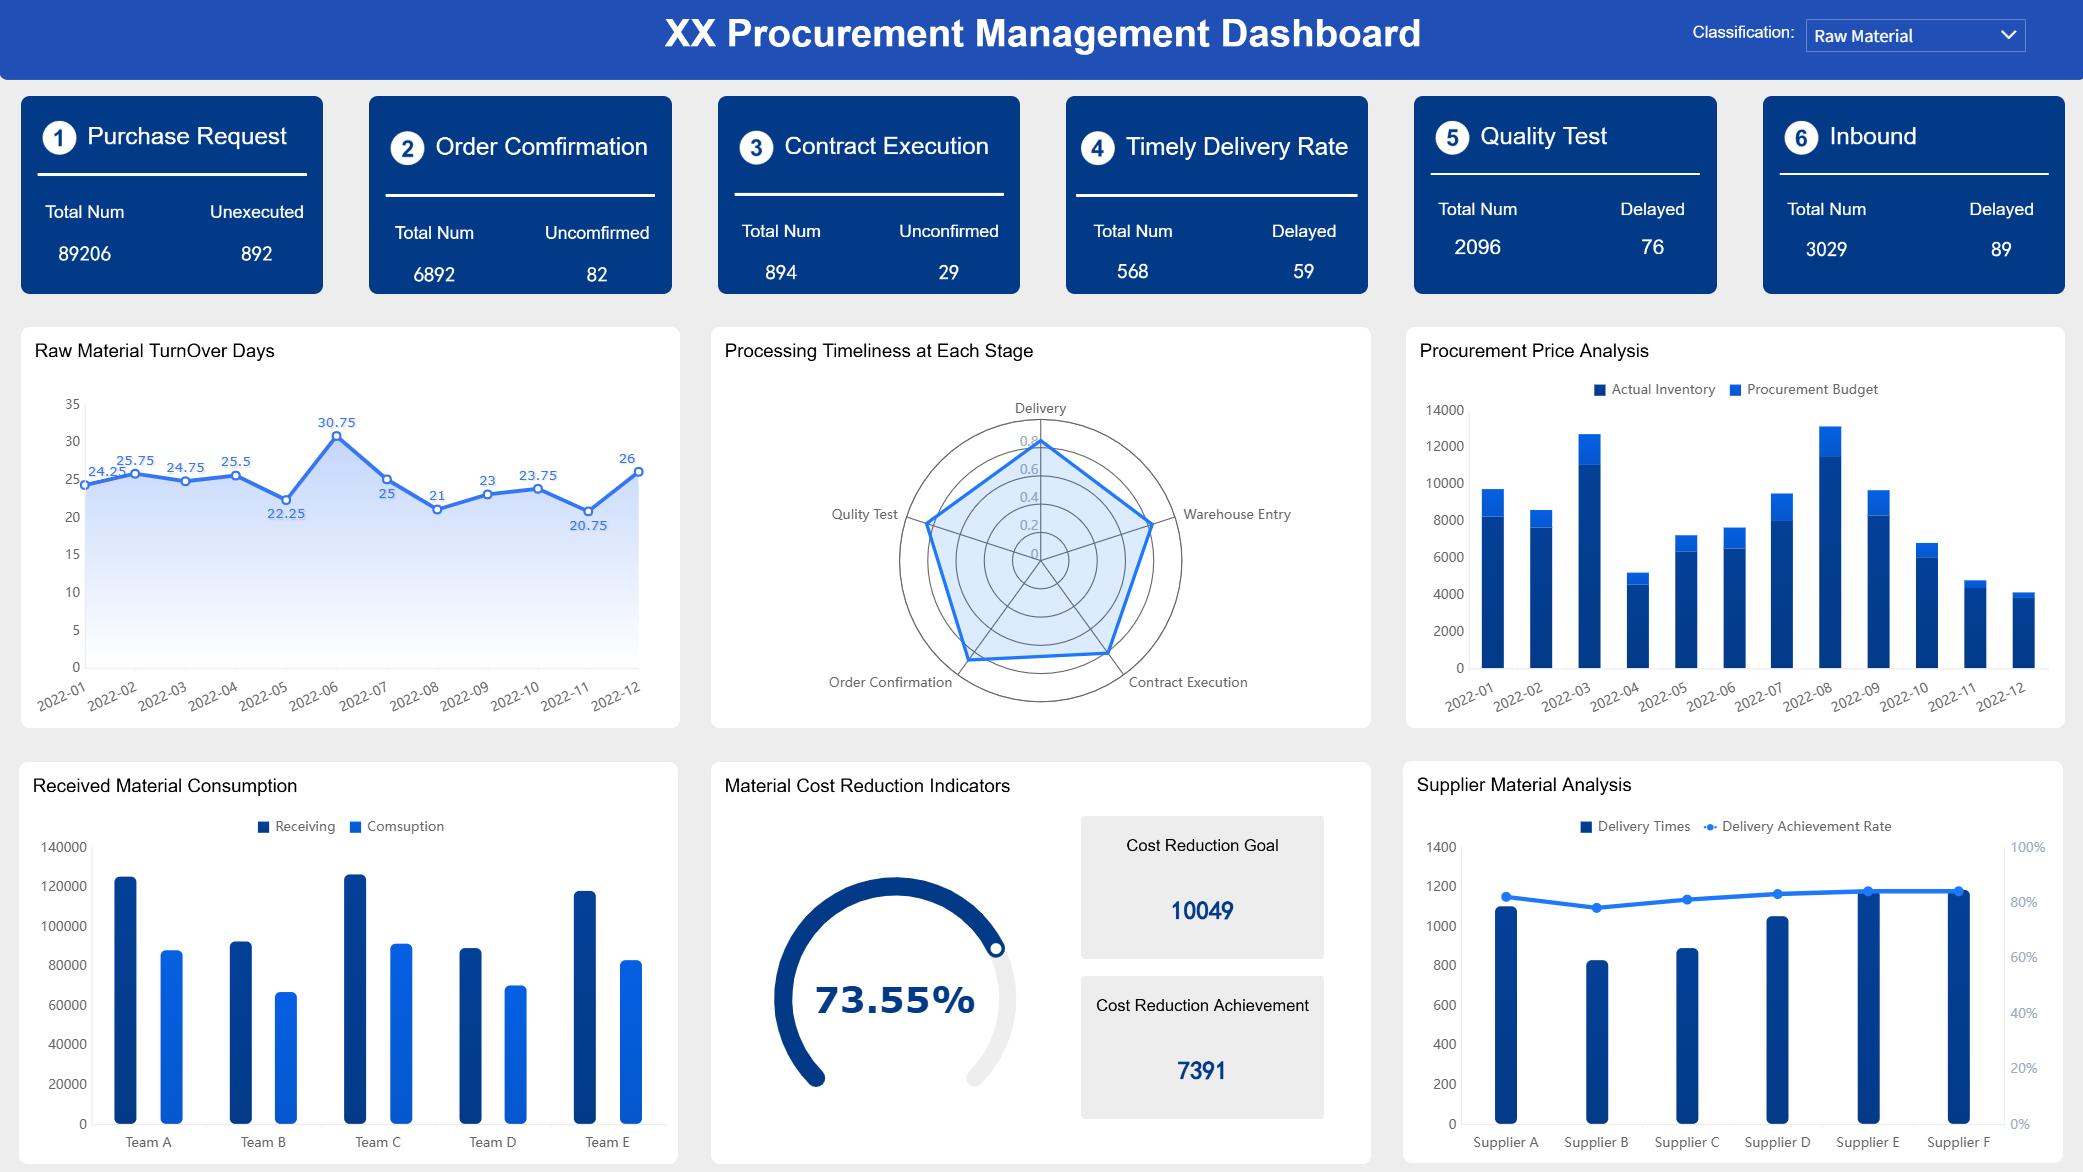
All reports in this article are built with FineReport.
What an email marketing report should include
A useful email marketing report should answer three questions quickly:
- How did email perform?
- Why did performance change?
- What action should the team take next?
That sounds simple, but many reports fail because they either stay too shallow or go too deep without structure.
Define the purpose of weekly and monthly reporting
Weekly and monthly reporting serve different business needs.
A weekly email marketing report is designed for operational control. It helps teams monitor recent campaigns, identify emerging issues, and adjust quickly. This is where campaign managers track short-term shifts like a sudden drop in delivery rate, an unusual unsubscribe spike, or a strong click-through result from a new CTA.
A monthly email marketing report is meant for broader performance evaluation. It looks at patterns across multiple sends, segments, and campaigns. This is where leadership and senior marketers want to understand whether email is improving retention, generating pipeline, supporting promotions, or contributing meaningful revenue over time.
Clarify who the report is for: campaign managers, leadership, and clients
The same data should not be presented the same way to every audience.
- Campaign managers need operational detail, campaign-by-campaign performance, testing outcomes, and corrective actions.
- Leadership needs a compact summary focused on business outcomes, trends, risks, and strategic recommendations.
- Clients or external stakeholders need clarity, accountability, and narrative context that connects email performance to agreed goals.
A strong reporting process starts by defining the audience before building the dashboard.
Explain the difference between a quick performance snapshot and a deeper review
A snapshot is for speed. A review is for understanding.
A quick performance snapshot usually includes:
- total sends
- delivery rate
- open rate
- click-through rate
- conversion rate
- attributed revenue
- major anomalies
A deeper review adds:
- segment-level performance
- list growth quality
- churn and unsubscribe patterns
- deliverability issues by campaign or domain
- test results
- revenue trends
- commentary on causes and next steps
Core metrics to track in every email marketing report
The fastest way to improve email reporting is to standardize a core KPI set. This creates consistency across weekly and monthly reviews and makes trend analysis far easier.
Key Metrics (KPIs)
- Delivery Rate: Percentage of emails successfully delivered. Indicates inbox reach and list quality.
- Bounce Rate: Percentage of emails not delivered. High rates may signal poor list hygiene or technical issues.
- Unsubscribe Rate: Percentage of recipients who opt out after a send. Helps evaluate content relevance and frequency fit.
- Spam Complaint Rate: Percentage of recipients marking the message as spam. Critical for sender reputation monitoring.
- List Growth Rate: Net growth of subscribers over a reporting period after new signups and losses.
- Audience Churn: Rate at which subscribers become inactive, unsubscribe, or are removed.
- Open Rate: Percentage of delivered emails opened. Useful directionally, but should be interpreted carefully due to privacy changes.
- Click-Through Rate (CTR): Percentage of delivered emails that generated at least one click. Stronger than opens for measuring engagement.
- Click-to-Open Rate (CTOR): Percentage of opens that turned into clicks. Measures content and CTA effectiveness after the open.
- Conversion Rate: Percentage of recipients who completed the desired action, such as purchase, signup, or form completion.
- Revenue Per Email (RPE): Revenue generated divided by delivered emails. Useful for comparing campaign efficiency.
- Total Attributed Revenue: Revenue credited directly to email campaigns within your attribution model.
- Assisted Conversions: Conversions where email influenced the journey but was not the final touch.
- Week-over-Week Change: Short-term trend comparison to detect momentum shifts or sudden anomalies.
- Month-over-Month Change: Broader trend comparison to evaluate strategic progress.
- Goal Attainment: Performance against internal targets, such as revenue, CTR, or retention benchmarks.
Delivery and list health metrics
Deliverability and list quality are foundational. If emails do not reliably reach inboxes, downstream metrics become misleading.
Core delivery and list health metrics include:
- Delivery rate
- Bounce rate
- Unsubscribe rate
- Spam complaint rate
- List growth
- Source quality
- Audience churn
These metrics reveal whether your program is expanding sustainably or degrading under the surface. For example, rapid list growth from a low-quality acquisition source may look positive on paper but often leads to lower engagement and higher complaint risk later.
Delivery rate, bounce rate, unsubscribe rate, and spam complaint rate
These are early warning indicators.
- Falling delivery rate may point to sender reputation issues or invalid addresses.
- Rising bounce rate often suggests data quality problems.
- Increasing unsubscribe rate can indicate message fatigue, poor targeting, or misaligned content.
- Elevated spam complaint rate is a serious risk and should trigger immediate investigation.
List growth, source quality, and audience churn
Subscriber count alone is not enough. Report growth with context.
Track:
- where new subscribers came from
- how those subscribers behave after signup
- how quickly inactive contacts accumulate
- whether list gains offset subscriber losses
A healthy list is not just growing. It is staying engaged.
Engagement metrics
Engagement metrics show whether your emails are earning attention and driving action.
Open rate, click-through rate, click-to-open rate, and conversion rate
These metrics should be interpreted as a sequence.
- Open rate suggests whether the sender name, subject line, and timing earned attention.
- CTR shows whether the message generated action from the delivered audience.
- CTOR isolates content effectiveness among those who opened.
- Conversion rate shows whether clicks translated into business value.
Because privacy protections can inflate or distort opens, many teams now rely more heavily on CTR, CTOR, and conversion data for decision-making.
Revenue per email, total attributed revenue, and assisted conversions
If your email marketing report does not connect performance to business outcomes, it will not influence serious decisions.
Include:
- Revenue per email to compare campaign efficiency
- Total attributed revenue to quantify direct impact
- Assisted conversions to show email’s influence across longer buying journeys
This is especially important for ecommerce, SaaS, and B2B lead generation teams that need to justify email investment beyond vanity metrics.
Trend and benchmark context
Metrics without context create confusion. Trend reporting is what turns raw numbers into insight.
Week-over-week and month-over-month comparisons
Comparisons should be built into every report.
- Week-over-week comparisons help detect immediate changes in campaign performance
- Month-over-month comparisons reveal broader shifts in audience behavior and strategy effectiveness
Always show both absolute values and percentage change where useful.
Internal goals, historical baselines, and industry benchmarks
The best benchmark is usually your own history.
Use:
- internal targets
- trailing averages
- prior campaign clusters
- seasonal baselines
Industry benchmarks can be helpful, but only when they are clearly framed. Different industries, send types, list sizes, and privacy environments can make external comparisons misleading. Historical internal baselines are often more actionable.
Recommended sections of an email marketing report for weekly and monthly reviews
A report becomes more useful when its structure matches its review cadence.
Weekly report sections
A weekly email marketing report should be compact, practical, and action-oriented.
Recommended weekly sections:
- Reporting period
- Campaign list
- Top-line KPI snapshot
- Notable wins
- Issues and risks
- Immediate actions and owners
Campaign summary, top-line metrics, notable wins, issues, and immediate actions
A weekly report should quickly show:
- what was sent
- what performed above or below expectations
- any operational problems
- what the team will do next
A good weekly summary might say:
Three campaigns were sent this week. CTR improved 18% week over week due to stronger product CTA placement. However, unsubscribe rate increased on the promotional send to older inactive segments. Next action: suppress low-engagement cohort from next week’s promotion and test lower frequency.
Monthly report sections
A monthly report should go beyond recap. It should help shape future strategy.
Recommended monthly sections:
- Executive summary
- Performance trends
- Campaign comparisons
- Audience and segment insights
- Testing and experimentation results
- Deliverability and list health review
- Strategic recommendations
Performance trends, audience insights, campaign comparisons, testing results, and strategic recommendations
Monthly reviews should answer:
- which campaign types consistently worked
- which segments generated the strongest value
- what tests produced statistically meaningful improvement
- where deliverability or list quality needs intervention
- which priorities should drive next month’s plan
Commentary that makes the report useful
Raw numbers are not enough. Commentary is what makes reporting actionable.
Explain what changed, why it changed, and what should happen next
Every major movement in the report should include concise interpretation.
Use this formula:
- What changed
- Why it likely changed
- What to do next
Example:
- CTR dropped from 2.9% to 2.1%
- Likely caused by broader audience targeting and weaker offer-message fit
- Next step: split promotional and educational audiences, then retest creative by segment
Separate signal from noise by focusing on meaningful movements
Not every fluctuation deserves attention.
Good commentary focuses on:
- material changes
- recurring trends
- statistically meaningful test outcomes
- risks with business impact
Avoid filling the report with commentary on tiny variations that do not change decisions.
How to create an email marketing report that people will actually use
A report only works if people can read it quickly and act on it confidently.
Choose the right format and dashboard layout
Your reporting format should reflect both the audience and the speed of decision-making.
Common formats include:
- Live dashboards for ongoing access and operational monitoring
- Slides for executive and client review meetings
- Spreadsheets for analyst workflows and auditability
- One-page summaries for fast distribution
For most teams, the best model is a dashboard-backed process with lightweight summaries for stakeholders.
Decide between slides, spreadsheets, dashboards, or one-page summaries
Use the simplest format that supports the decision.
- Choose slides when narrative and presentation matter
- Choose spreadsheets when detailed validation is required
- Choose dashboards when stakeholders need self-serve access
- Choose one-page summaries when speed and clarity are the priority
FineReport is especially useful here because it allows teams to build standardized dashboards, automate recurring reporting, and present complex email performance clearly across different stakeholder groups.
Keep visuals simple and highlight the few metrics that drive decisions
Do not overcrowd the page.
Prioritize:
- KPI cards
- trend lines
- comparison tables
- variance indicators
- annotations
Deprioritize decorative charts that look good but do not guide action.
Customize by audience and business goal
The same email marketing report should not be sent unchanged to executives, sales leaders, and campaign specialists.
Tailor the report for executives, marketing teams, sales stakeholders, or clients
Here is a practical breakdown:
| Audience | What they care about most | Best report style |
|---|---|---|
| Executives | Revenue, pipeline, growth, risk | High-level summary with trends and recommendations |
| Marketing team | Campaign detail, tests, segment insights | Detailed dashboard with drill-down views |
| Sales stakeholders | Lead quality, influenced pipeline, conversion | Funnel-focused report tied to CRM stages |
| Clients | Goal progress, insights, accountability | Branded summary with commentary and action plan |
Align reporting sections with goals such as retention, lead generation, or ecommerce revenue
Build the report around business objectives.
If the goal is retention, emphasize:
- engagement by lifecycle stage
- reactivation performance
- churn indicators
- repeat purchase impact
If the goal is lead generation, emphasize:
- form fills
- MQLs
- assisted conversions
- funnel progression
If the goal is ecommerce revenue, emphasize:
- revenue per email
- conversion rate
- average order value
- campaign revenue by segment and category
Make email campaign reporting more effective
Effective reporting is usually the result of disciplined operating standards.
Standardize naming conventions, reporting windows, and attribution rules
This is one of the most overlooked improvements.
Standardize:
- campaign naming
- date windows
- audience labels
- conversion definitions
- attribution models
Without this, weekly and monthly reviews quickly become inconsistent and hard to trust.
Add annotations for launches, promotions, deliverability issues, or list changes
Annotations make trend lines readable.
Tag events such as:
- major promotions
- new product launches
- list cleanups
- deliverability incidents
- frequency changes
- segmentation logic updates
These notes prevent teams from misreading performance changes in isolation.
Email insights, campaign tracking, and best practices of email marketing report
Reliable reporting depends on reliable tracking.
Campaign tracking setup
If campaign tracking is inconsistent, your report will always be incomplete.
Use consistent UTM structures, campaign labels, and conversion definitions
Create and enforce rules for:
- UTM source
- UTM medium
- UTM campaign
- campaign naming taxonomy
- conversion event definitions
This is essential for comparing email performance across reporting periods and across channels.
Connect email data with web analytics and CRM reporting where possible
The highest-value email marketing report blends data from:
- your email service provider
- web analytics platform
- CRM
- ecommerce or sales systems
This gives you a more complete view of what happened after the click and whether email influenced revenue, leads, or retention.
Actionable best practices for implementing an email marketing report
Below is the practical framework I recommend to teams that want reporting people will actually use.
1. Build one KPI spine and keep it fixed
Start with a standardized KPI set for all weekly and monthly reporting. Keep definitions fixed for at least one quarter.
Step by step:
- Select 8 to 12 core metrics
- Define each metric in plain language
- Confirm ownership of each data source
- Lock formula logic and date windows
- Publish a reporting glossary internally
This prevents endless reporting debates and protects trust in the numbers.
2. Separate operational views from executive views
Do not force executives to read analyst-level detail, and do not force campaign managers to work from executive summaries.
Step by step:
- Create one dashboard for detailed campaign analysis
- Create one condensed summary for leadership
- Limit executive pages to trends, outcomes, risks, and next moves
- Keep detailed campaign tables in supporting tabs or linked views
This reduces noise while preserving analytical depth.
3. Add commentary rules, not just numbers
Require every report owner to include short commentary for major movements.
Step by step:
- Flag KPI changes above a defined threshold
- Write one sentence on what changed
- Write one sentence on likely cause
- Write one sentence on recommended action
- Review commentary for specificity before sharing
This turns reporting into decision support rather than data dumping.
4. Review list health every month, not just campaign performance
Too many teams report campaign metrics weekly but ignore long-term audience quality.
Step by step:
- Track source quality by signup channel
- Review churn and inactivity monthly
- Compare recent subscriber cohorts against older cohorts
- Suppress or re-engage low-quality segments
- Document any list quality actions in the report
This protects deliverability and improves long-term ROI.
5. Automate distribution and preserve one source of truth
Manual exports slow down reporting and increase version confusion.
Step by step:
- Centralize data inputs into a reporting layer
- Automate dashboard refresh schedules
- Distribute the same report link to stakeholders
- Archive monthly snapshots for comparison
- Restrict metric editing rights to report owners
This is where a platform like FineReport can help teams scale reporting with consistency, governance, and cleaner stakeholder access.
Benchmarks and performance evaluation
Compare results against your own historical performance first
Historical internal performance is your most valuable benchmark because it reflects your actual audience, send frequency, brand recognition, and business model.
Use internal comparisons such as:
- trailing 4-week average
- trailing 3-month average
- same month last year
- campaign-type averages
- segment-specific baselines
This gives stakeholders a more realistic view of progress.
Use industry statistics carefully, with notes on audience size, sector, and send type
Industry benchmark data can be helpful for directional context, but it should never replace internal benchmarking.
If you include external benchmarks, note:
- industry category
- audience size
- send type
- time period
- privacy limitations affecting open data
That level of context prevents weak comparisons.
Common reporting mistakes to avoid
Overloading the report with vanity metrics
A bloated report is rarely a useful report.
Common vanity-metric mistakes include:
- leading with opens alone
- reporting every click without prioritization
- showing too many charts on one page
- listing metrics without interpretation
Focus on metrics that support decisions.
Ignoring data quality issues or changes in privacy-related tracking
Privacy changes and data inconsistencies can distort reporting if left unexplained.
Be careful with:
- inflated open rates
- unattributed conversions
- inconsistent campaign naming
- missing UTM parameters
- duplicate records
- unclear attribution windows
The report should note any known limitations directly in the commentary.
A simple email marketing report template and review checklist for marketers
Below is a practical reporting template you can adapt for internal teams or clients.
Weekly email report template
Reporting Period
- Start date:
- End date:
Campaign List
- Campaign names sent this week
- Audience/segment
- Send date
KPI Snapshot
- Emails sent
- Delivery rate
- Bounce rate
- Open rate
- CTR
- CTOR
- Conversion rate
- Attributed revenue
- Unsubscribe rate
- Spam complaint rate
Key Insights
- Best-performing campaign
- Most important trend
- One positive takeaway
Problems and Risks
- Deliverability concern
- Audience fatigue signal
- Tracking or data issue
Next Actions and Owners
- Action item
- Owner
- Deadline
Monthly email report template
Executive Summary
- Overall monthly performance
- Major gains and losses
- Strategic takeaway
Performance by Campaign and Segment
- Campaign comparison table
- Segment engagement trends
- Conversion and revenue contribution
Testing and Experimentation Results
- Tests run
- Winner
- Confidence or directional takeaway
- Recommended rollout
Deliverability and List Health Review
- Delivery trends
- Bounce trends
- Unsubscribe and complaint rates
- Net list growth
- Audience churn observations
Recommendations for the Next Month
- Priority tests
- Segment strategy changes
- Frequency adjustments
- Data or tracking fixes
Final checklist before sharing
Before sending any email marketing report, review the following:
- Verify data sources and date ranges
- Confirm commentary is clear, specific, and actionable
- Make sure the report answers the main business question
A stronger final checklist looks like this:
- Are all KPI definitions consistent with prior reports?
- Are campaign names and segments accurate?
- Are week-over-week or month-over-month comparisons correct?
- Are anomalies explained with annotations?
- Are recommendations tied directly to the findings?
- Does the report match the audience’s decision needs?
Final thoughts
A strong email marketing report should do more than summarize past sends. It should help teams improve targeting, protect deliverability, prioritize experiments, and prove business value. Weekly reporting should help operators react fast. Monthly reporting should help leaders make smarter strategic decisions. The difference between a mediocre report and a trusted one usually comes down to structure, commentary, and consistency.
If you want to standardize weekly and monthly email reporting with cleaner dashboards, automated distribution, and executive-ready views, FineReport is a practical option for building a more scalable reporting process.

FAQs
A strong email marketing report should show core KPIs, explain why performance changed, and recommend next actions. It typically includes deliverability, engagement, conversion, revenue, list health, and trend comparisons.