A strong b2b marketing report should help leadership answer one question: is marketing creating pipeline and helping revenue move forward? If your report only shows lead totals, MQL spikes, or campaign activity, it may look busy while still failing the executive test. Marketing leaders, revenue operations teams, and sales stakeholders need reporting that connects spend and programs to opportunity creation, deal progression, and pipeline quality. That is the business value of modern B2B reporting: clearer budget decisions, stronger sales alignment, and more confidence in marketing’s contribution to growth.
Click To Try The Dashboard
All reports in this article are built with FineReport
Most marketing reports are still designed around activity volume. They count leads, form fills, clicks, and MQLs because those metrics are easy to collect and easy to present. The problem is that executives do not fund marketing to generate spreadsheets full of leads. They fund marketing to create qualified demand, accelerate pipeline, and support revenue outcomes.
A better b2b marketing report makes a clear distinction between lead volume and pipeline contribution. Lead volume tells you how much top-of-funnel activity occurred. Pipeline contribution tells you whether those activities created real business value.
Lead volume reporting vs. pipeline impact reporting
Lead volume reporting focuses on quantity:
Number of leads generated
MQL count
Cost per lead
Landing page conversion rates
Webinar registrations
Pipeline impact reporting focuses on business outcomes:
Opportunities created
Pipeline sourced by marketing
Pipeline influenced by marketing
Conversion from lead to opportunity
Deal progression through stages
Revenue won
This distinction matters because large lead volumes often hide weak quality. A campaign can produce thousands of leads and still create almost no pipeline. Conversely, a niche campaign targeting the right accounts may produce fewer leads but generate high-value opportunities.
Why revenue influence and deal progression matter more than raw MQL counts
MQLs are only useful if they convert and move. If they sit untouched, get rejected by sales, or never become pipeline, they are not proof of impact. Senior stakeholders care more about:
Revenue influence: Did marketing meaningfully shape buying decisions?
Opportunity creation: Did campaigns create qualified pipeline?
Deal progression: Did marketing help stalled deals move to the next stage?
Win contribution: Did marketing-supported opportunities close at a higher rate?
These metrics are closer to financial outcomes, which is why they carry more weight in executive reviews and budget discussions.
Who the report is really for
Your report should not try to satisfy everyone with one giant data dump. It should serve the actual decision-makers:
Marketing leaders want to know where budget is generating pipeline efficiently.
Sales stakeholders want confidence in lead quality, account engagement, and opportunity support.
Finance partners want spend tied to measurable business return.
Executives want a concise view of pipeline impact, risk, and next actions.
If the audience cannot quickly identify what changed, why it changed, and what should happen next, the report is underperforming.
The true goal of a B2B marketing report
The goal is not to recap what happened. The goal is to support better decisions.
What changes are needed next month or next quarter
That is the threshold. If your report does not change decisions, it is just documentation.
Core metrics that connect marketing activity to pipeline impact
The fastest way to improve reporting is to standardize what counts. Many reporting disputes come from inconsistent definitions, not bad performance. Before building charts, align the operating model.
Before discussing KPIs, define the framework behind them. This is one of the most important steps in producing a credible b2b marketing report.
You need agreement on:
Lifecycle stages
Lead qualification criteria
Opportunity entry rules
Sourced versus influenced logic
Reporting windows
Account-level versus lead-level measurement
Without these definitions, marketing and sales will challenge every number. That slows reporting and damages trust.
Shared definitions to document with sales
At minimum, document these items:
Inquiry: A net-new response or engagement entering the system
MQL: A lead or account meeting agreed fit and engagement thresholds
SQL or accepted lead: A lead validated by sales as worth pursuit
Opportunity: A qualified sales deal entered into CRM with value and stage
Sourced pipeline: Pipeline created from marketing-originated demand
Influenced pipeline: Opportunities impacted by one or more marketing touches
Reporting period: Whether metrics are based on lead creation date, opportunity creation date, or revenue close date
This documentation reduces attribution arguments and makes trend analysis more reliable.
Track the metrics that show business impact
Once definitions are aligned, build your report around metrics that connect activity to revenue outcomes.
Key Metrics (KPIs)
Pipeline Sourced: Total pipeline value from opportunities directly created by marketing-originated demand.
Pipeline Influenced: Total pipeline value for opportunities where marketing played a measurable supporting role.
Opportunity Creation Rate: Percentage of qualified leads or engaged accounts that become sales opportunities.
Lead-to-Opportunity Conversion Rate: Measures how effectively top-of-funnel activity translates into pipeline.
Average Deal Size: Average value of opportunities or closed-won deals tied to marketing programs.
Sales Velocity: Speed at which opportunities move through the pipeline toward close.
Win Rate: Percentage of marketing-sourced or influenced opportunities that become closed-won deals.
Cost per Opportunity: Total campaign or channel spend divided by number of opportunities created.
Cost per Dollar of Pipeline: Marketing cost required to generate one dollar of pipeline value.
Channel Efficiency: Comparative view of which channels generate the best pipeline outcomes for the lowest investment.
Segment Performance: Pipeline and conversion results by industry, region, company size, or account tier.
Campaign Contribution: Opportunity and pipeline impact attributable to individual campaigns or programs.
These KPIs should sit at the center of your b2b marketing report, with volume metrics used only as supporting context.
Compare volume and quality together
One of the most useful report designs shows both volume and quality side by side. For example:
Leads by channel
Opportunity rate by channel
Pipeline per lead by channel
Win rate by channel
This comparison reveals tradeoffs. A paid social program may generate more leads, but a partner webinar may create fewer leads with much higher conversion and deal value. Without this side-by-side view, teams overinvest in noisy channels.
Add efficiency and trend context
Executives do not just want to know what happened. They want to know whether performance is improving and whether it is efficient.
Use benchmarks carefully. External research can help frame expectations around channel mix, buying behavior, or budget trends, but it should never replace internal context. A benchmark may tell you the market average. Your own sales motion, deal size, geography, and segment mix determine what good performance actually looks like.
How to structure the report for executive clarity
Even good metrics fail when presented poorly. A report that buries key insights in ten tabs, fifty charts, and endless tables will not influence decisions. Structure matters as much as metric selection.
Lead with business outcomes
Start with the business summary, not the channel detail.
The report should not simply display movement. It should explain it.
For each major shift, clarify:
What changed
Why it likely changed
What assumptions matter
What risk remains
What action is recommended
This is where strong reporting becomes executive communication. For example, instead of saying “opportunity volume declined 12%,” say:
Opportunity volume declined 12% because webinar output fell and SDR follow-up lag increased.
Conversion quality improved in target accounts despite lower total lead volume.
The short-term risk is lower mid-funnel coverage next quarter.
The recommended action is to restore two high-performing webinars and tighten SLA monitoring between marketing and sales.
That level of interpretation makes the report usable.
Data sources, attribution, and reporting pitfalls to address
The biggest reporting failures usually come from messy data and weak methodology, not dashboard design. If the inputs are inconsistent, your report will be challenged no matter how good it looks.
Connect data across systems
A credible b2b marketing report usually pulls from multiple systems:
CRM
Marketing automation platform
Ad platforms
Website analytics tools
Sales engagement systems
Event and webinar platforms
This integration work is where many teams struggle. Common issues include:
Different campaign names across platforms
Duplicate contacts and accounts
Time lags between engagement and CRM updates
Missing UTM parameters
Inconsistent stage mapping
Before building dashboards, resolve the data layer. Standardize naming conventions, deduplicate records, and define update timing. Otherwise, stakeholders will spend the meeting debating data quality instead of discussing actions.
Attribution does not need to be perfect. It needs to be transparent and defensible.
Common approaches include:
First-touch attribution: Credits the initial source of engagement
Last-touch attribution: Credits the final touch before conversion
Multi-touch attribution: Distributes value across multiple interactions
Account-level attribution: Measures impact across buying group and account engagement
The right model depends on your sales cycle and buying complexity. For short, direct-response motions, simple attribution may be enough. For enterprise B2B with multiple stakeholders, account-level and multi-touch methods are usually more realistic.
What matters most is consistency. If you change models constantly, trend reporting becomes meaningless.
Also be honest about limitations. Attribution can show patterns of influence, but it cannot always prove direct causation in long and complex buying journeys.
Avoid the most common reporting mistakes
These mistakes weaken trust quickly:
Overemphasizing leads while ignoring downstream conversion
Mixing incompatible date ranges across funnel stages
Hiding low-confidence or incomplete data
Treating correlation as causation
Reporting influenced pipeline without clear methodology
Flooding stakeholders with too many charts and too little interpretation
A better practice is to explicitly label uncertain metrics, explain reporting caveats, and separate confirmed performance from directional insight. Executives respect transparency more than false precision.
Using benchmarks and industry research to strengthen your conclusions
Benchmarks can make a b2b marketing report more persuasive, but only when used with discipline. The goal is not to outsource judgment to industry averages. The goal is to add context.
Bring in external benchmarks selectively
Use external research to validate broad patterns such as:
Budget shifts across channels
Expected CAC or efficiency ranges
Buying committee complexity
Market preference for webinars, events, paid media, or ABM programs
Changes in buyer behavior and sales cycle expectations
The best benchmark comparisons are relevant to your environment. Match by:
Segment
Geography
Business model
Deal size
Sales cycle complexity
Go-to-market motion
Generic comparisons are often misleading. A global enterprise SaaS company should not benchmark itself against a regional SMB demand generation model.
Turn external insight into internal action
Benchmarks become useful when they drive better internal decisions. For example, if outside research suggests that peer teams are shifting spend toward high-intent channels, combine that with your own sourced pipeline data before reallocating budget.
Good uses of benchmark insight include:
Identifying gaps in measurement maturity
Improving executive communication standards
Reassessing channel mix
Refining pipeline expectations by segment
Challenging outdated lead-centric dashboards
Do not let benchmark data replace your own pipeline truth. External insight should sharpen interpretation, not override internal evidence.
A practical workflow to build and improve your reporting process
The most effective reports come from repeatable operating discipline, not one-time analysis. Reporting should run like a managed business process.
Create a repeatable monthly and quarterly cadence
Build a simple reporting rhythm with clear owners and deadlines.
A strong workflow usually includes:
Extract data from CRM, marketing automation, ad platforms, and analytics tools.
Validate data for duplicate records, stage mapping issues, and missing fields.
Analyze results against prior period, targets, and segment expectations.
Review with stakeholders across marketing, sales, and revenue operations.
Publish the final report with commentary and recommended actions.
Assign ownership clearly:
Marketing operations owns data integrity and dashboard maintenance
Revenue operations aligns definitions across systems
Demand generation or channel owners add performance context
Marketing leadership finalizes narrative and actions
This prevents the common problem where everyone contributes data but no one owns the story.
Review the report as a management tool
The report should become part of operating reviews, not just a monthly deliverable.
Use each cycle to ask:
Which channels generated real pipeline, not just leads?
Where did quality improve or decline?
Which assumptions from last period proved wrong?
What budget changes are now justified?
Which sections of the report were actually used by stakeholders?
That last question matters. Many teams keep producing complex sections no executive reads. Simplify aggressively over time.
End with actions, not just observations
Every reporting cycle should close with decisions. That is the discipline that turns reporting into performance management.
A simple action log is often more valuable than another chart. It creates accountability and makes the report useful for both retrospective review and forward planning.
Build the report faster and make it easier to trust with FineReport
Building this manually is complex; use FineReport to utilize ready-made templates and automate this entire workflow.
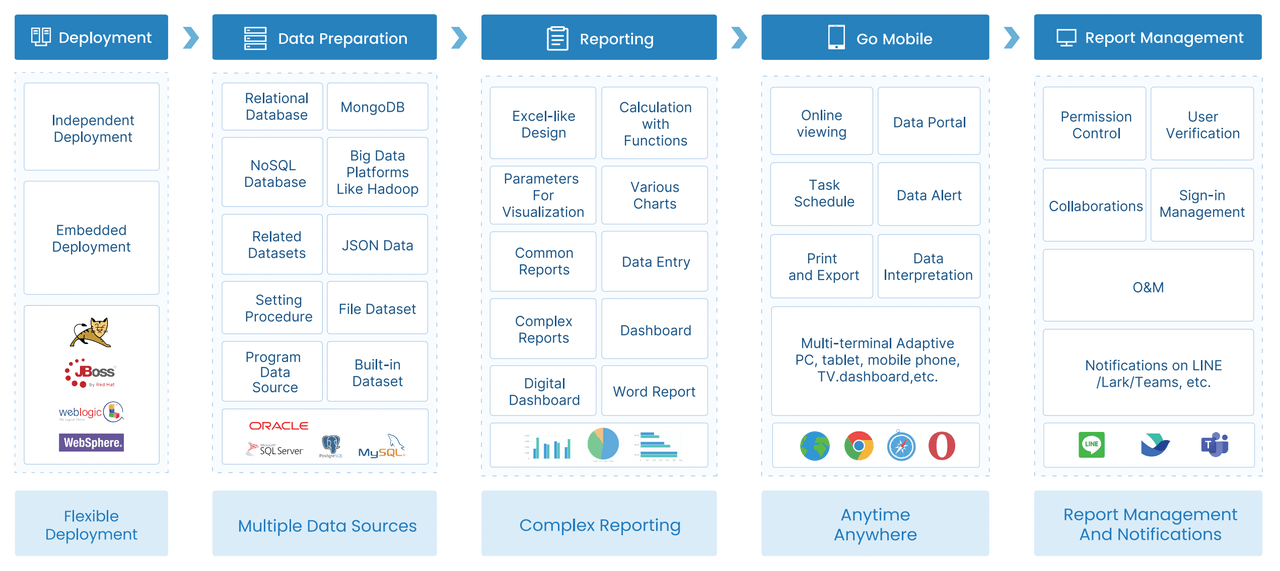
FineReport helps teams move beyond fragmented spreadsheets and disconnected exports by unifying dashboards, KPI logic, and cross-system reporting into a more reliable process. For enterprise teams, that means faster report production, clearer executive views, and fewer debates over whose numbers are right.
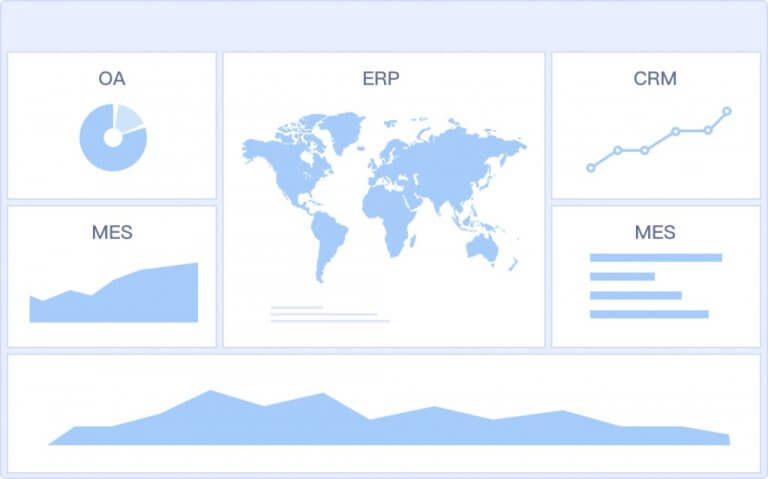
Consolidate CRM, marketing, and sales data into one reporting layer
Standardize KPI definitions across teams
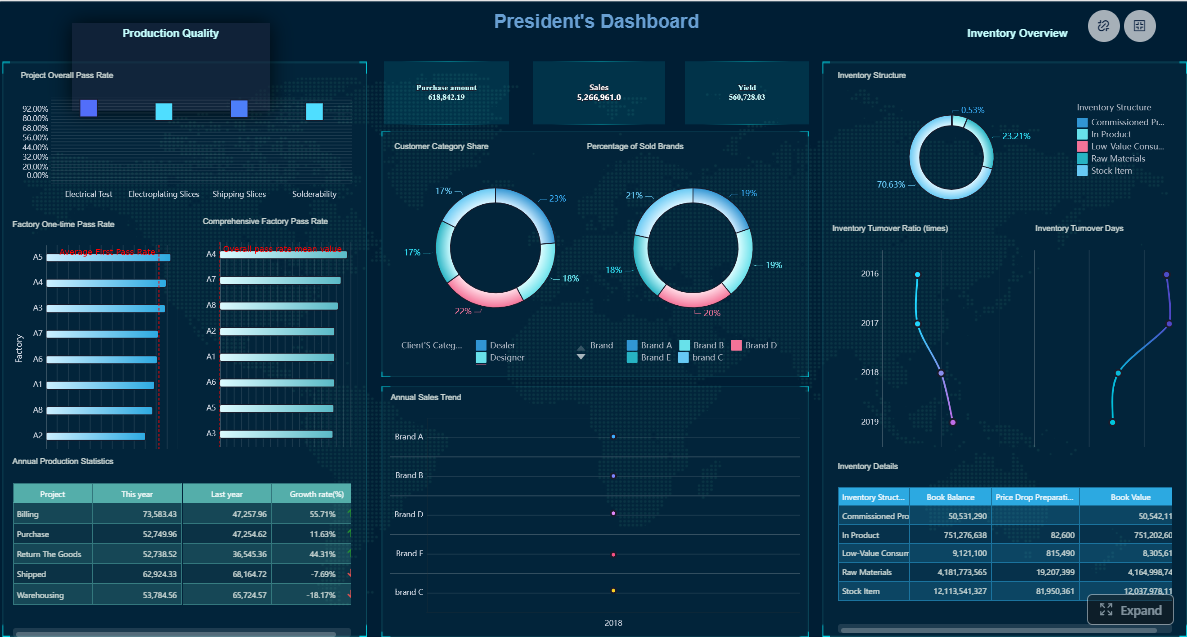
Build executive dashboards for sourced and influenced pipeline
Create drill-down views by channel, campaign, region, or segment
Automate recurring monthly and quarterly reporting
Reduce manual formatting and slide-building time
This is especially valuable when your b2b marketing report needs to support leadership reviews, budget planning, and revenue alignment. Instead of rebuilding charts every month, your team can focus on analysis, explanation, and action.
Get Ready-to-Use Dashboard Templates in Fine Gallery
If your current process still depends on manual exports, spreadsheet stitching, and presentation cleanup, that is not just inefficient. It also increases the risk of inconsistency and weak stakeholder trust. FineReport gives you a more scalable way to build a reporting system that proves marketing’s contribution to pipeline with much less operational friction.
The real test of a modern b2b marketing report is simple: can it help the business make better revenue decisions? If you align definitions, prioritize pipeline metrics, structure the story clearly, and automate the reporting workflow, the answer becomes yes.
A strong B2B marketing report should focus on pipeline contribution, opportunity creation, deal progression, and revenue impact instead of just lead volume. The goal is to show whether marketing is helping the business grow, not simply generating activity.
Lead totals and MQLs can look impressive while still failing to produce qualified pipeline. Executives usually care more about whether those leads convert, influence deals, and contribute to closed revenue.
The most useful metrics include marketing-sourced pipeline, influenced pipeline, lead-to-opportunity conversion rate, win rate, sales velocity, and revenue won. These KPIs connect marketing activity to outcomes that matter to sales and leadership.
They need shared definitions for lifecycle stages, qualification criteria, sourced versus influenced pipeline, and reporting windows. When both teams agree on the rules first, the numbers become more credible and easier to act on.
FineReport can help teams combine funnel, pipeline, and revenue metrics into clear dashboards that are easier for leadership to review. This makes it simpler to spot trends, compare channel performance, and support budget decisions with data.
Product Trial
FineReport
Pixel-perfect reports · Interactive dashboards · Easy data entry · Digital twins