A budget report is the control center for planned spending, actual results, and funding risk. For finance teams, department heads, project managers, and operations leaders, the real value is simple: it turns scattered numbers into fast decisions. If your team is relying on raw spreadsheets, outdated worksheets, or reports that arrive too late to act on, you are not really tracking budget performance—you are documenting problems after they happen.
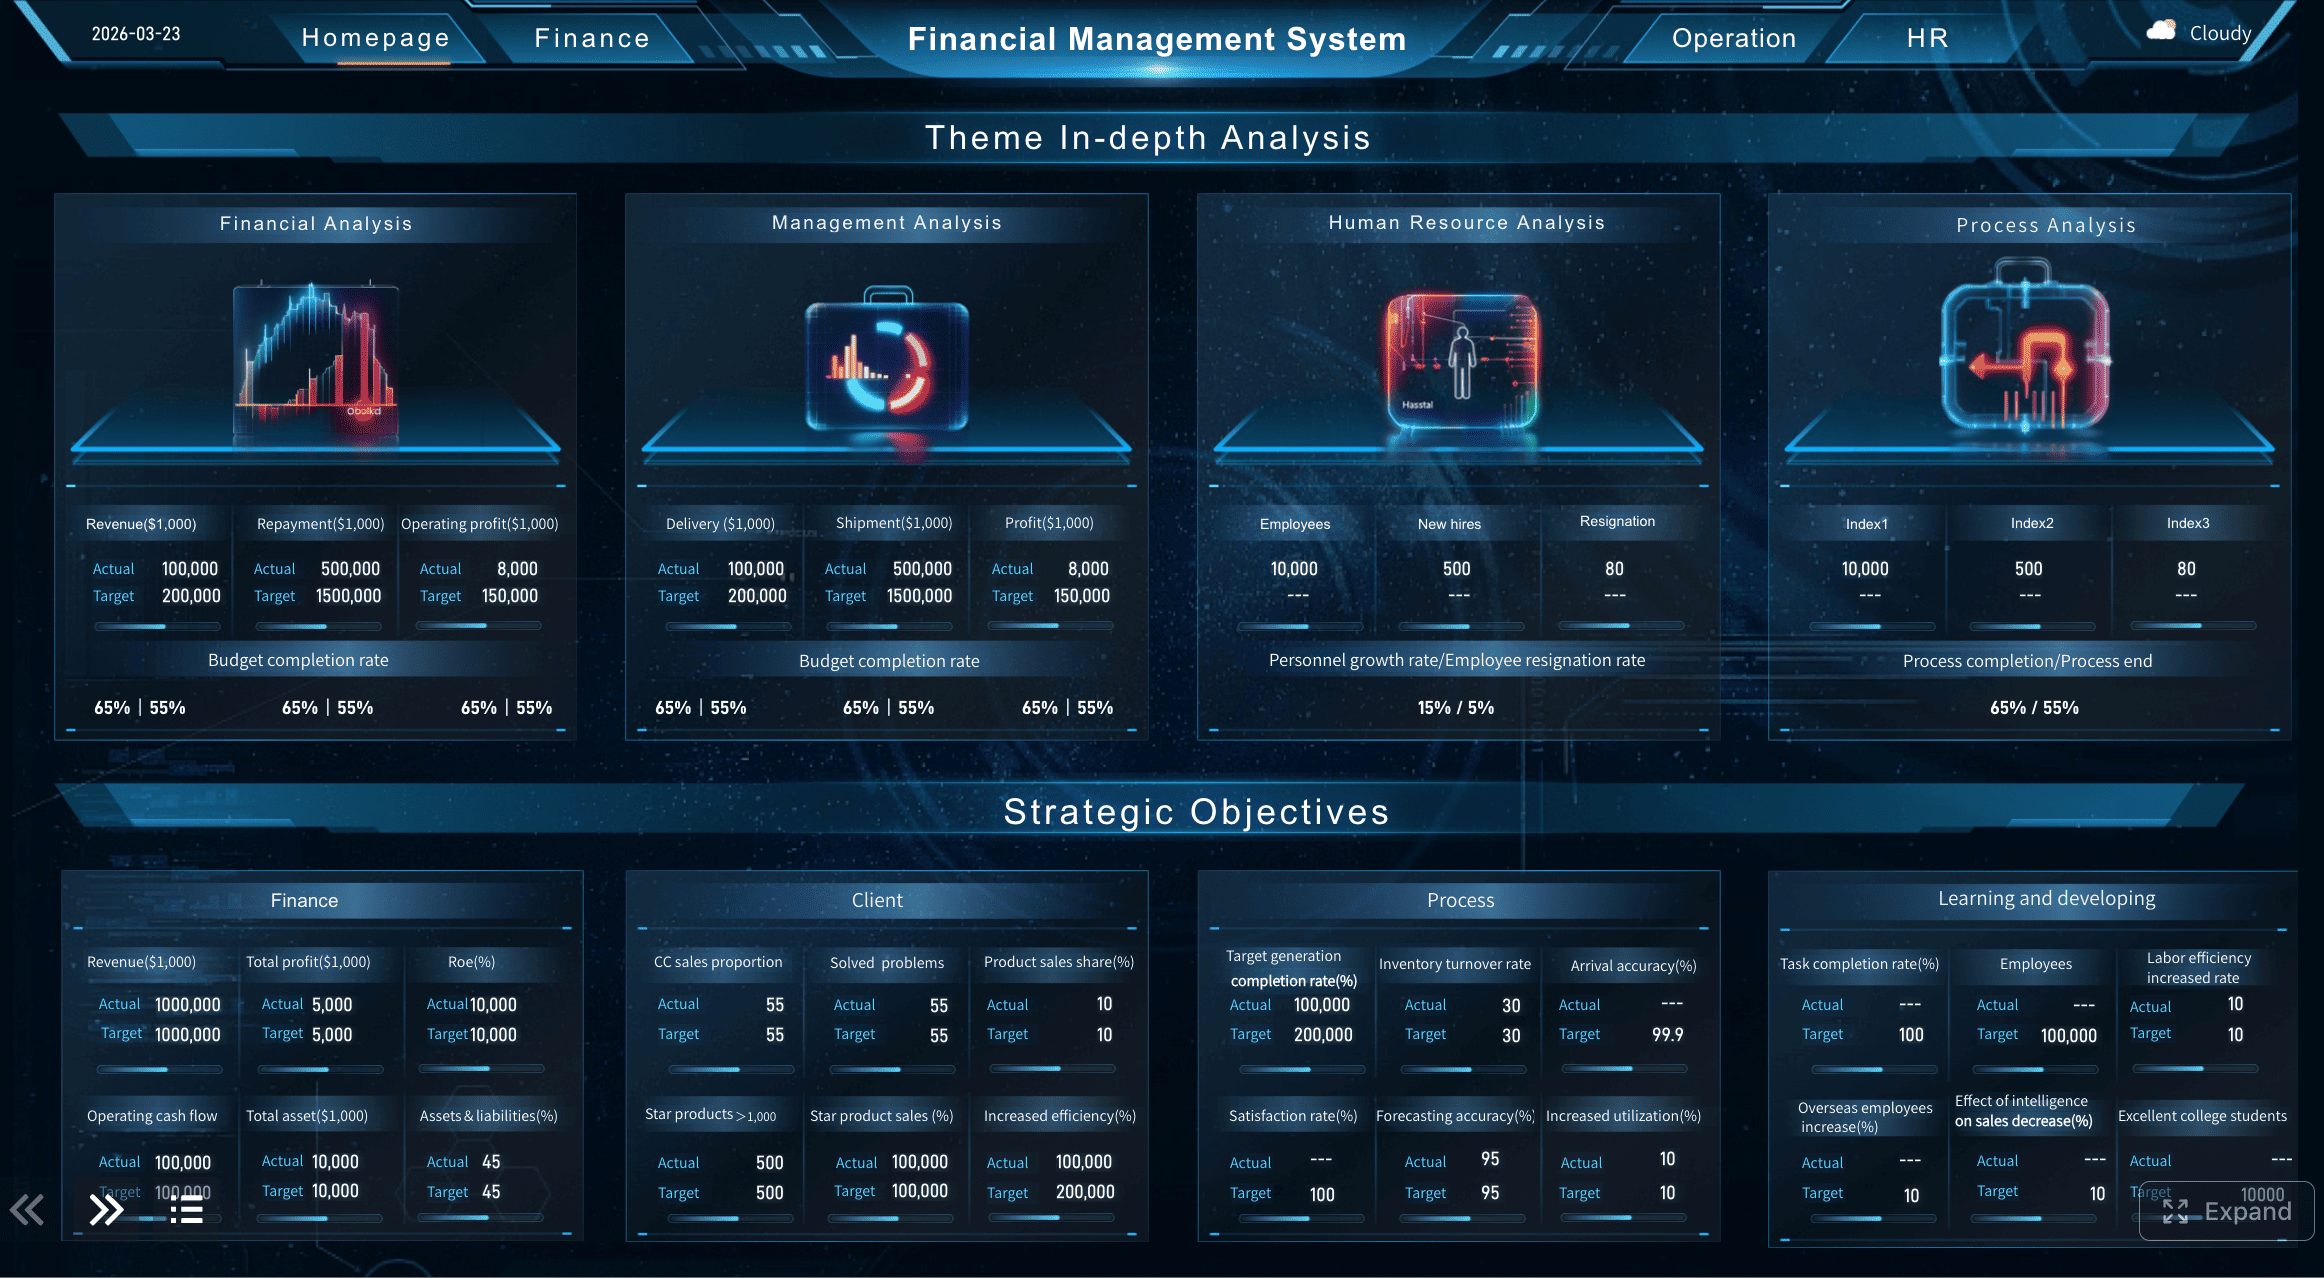
All reports in this article are built with FineReport.
A strong budget report should tell readers three things immediately: how much was planned, how much has been spent, and whether the current pace is sustainable. Decision-makers should not need to open multiple tabs or inspect line-by-line transactions just to understand whether a department, project, or cost center is on track.
For most organizations, the main users of a budget report include:
Finance managers tracking budget compliance and cost control
Department heads reviewing spending by team or function
Project managers monitoring budget consumption against milestones
Operations directors identifying risks before they affect delivery
Executives needing a high-level summary for fast approvals
A clear report improves budget tracking because it shortens the time between signal and action. Instead of waiting until month-end surprises appear, managers can see budget drift early, investigate root causes, and adjust forecasts, purchasing, staffing, or priorities.
It is also important to distinguish between a detailed worksheet and a summary view:
View Type
Purpose
Best For
Detailed worksheet
Stores transactions, categories, formulas, notes, and audit details
Analysts and finance teams doing deep review
Summary budget report
Highlights KPIs, trends, exceptions, and actions
Managers and executives making decisions
A worksheet helps build the data foundation. A summary report helps people act. High-performing teams use both, but they do not confuse one for the other.
Key Metrics (KPIs) every budget report should include
If you want a budget report that supports fast, confident decisions, include these core elements:
Planned budget: The approved amount allocated for a period, project, or department.
Actual spending: The amount already spent based on posted transactions.
Committed spending: Funds already obligated through purchase orders, contracts, or scheduled expenses.
Budget variance: The difference between planned budget and actual or committed spending.
Burn rate: The speed at which funds are being used over time.
Forecast spending: The projected total spend by the end of the reporting period.
Forecast accuracy: How close past forecasts were to actual outcomes.
Remaining budget: The amount still available after actual and committed spending.
Reporting period: The time window covered, such as weekly, monthly, or quarterly.
Owner or accountable team: The person or function responsible for budget performance.
Commentary and next action: Brief explanation of major changes, risks, and recommended responses.
How to create a budget report that is easy to track and update
A budget report should be easy to maintain, not a monthly rescue project. The best reporting setups reduce manual effort, standardize calculations, and make updates predictable.
Start with a simple reporting structure
Begin with a one-page structure that puts the essentials in a single view:
Planned budget
Actual spending
Variance
Remaining funds
Forecast for period-end
Short notes on risks or changes
This structure works because it reflects how managers think. They want to know where they stand, what changed, and what to do next.
Your reporting cadence should match operational reality:
Weekly for volatile projects, campaigns, or fast-moving departments
Biweekly for mid-level oversight with moderate spending activity
Monthly for stable functions and executive review
Quarterly for strategic budget steering, not detailed intervention
If the budget moves quickly, your report should too. A monthly report for a fast-changing project often arrives too late.
Use a template or worksheet to speed up setup
Do not build every budget report from zero. Start with a reusable spreadsheet, worksheet, or reporting template that already contains the right categories and logic. This cuts setup time, reduces formula errors, and creates consistency across teams.
A practical template should include:
Budget category or cost center
Owner
Reporting period
Planned amount
Actual amount
Committed amount
Variance
Remaining amount
Notes and assumptions
Then customize it to your environment. For example, a marketing team may track campaign, channel, agency, and software costs. An operations team may focus on labor, materials, maintenance, and logistics. The structure stays the same; the categories adapt to the business.
This is where reporting platforms like FineReport become useful. Instead of maintaining disconnected worksheets, teams can standardize templates, connect live data sources, automate calculations, and distribute dashboard-based budget reports that update with less manual effort.
The best budget report is not the one with the most data. It is the one that makes action obvious.
Include only the figures and notes that answer these questions:
Are we on budget?
If not, where is the issue?
Is the issue temporary or structural?
What should we change now?
That means you should leave out excessive detail that slows the reader down. Long transaction dumps belong in supporting worksheets, not in the main report.
Make room for short business commentary such as:
Assumptions behind the current forecast
Changes in scope or demand
One-time expenses
Risks likely to affect the next period
Recommended next steps
A number without context creates confusion. A number with brief interpretation creates alignment.
Budget Report KPI 1: Budget variance
Budget variance is usually the first KPI leaders look at because it shows the gap between what was planned and what actually happened. It is the fastest way to spot overspending, underspending, and allocation issues.
What variance tells you
At its most basic level, variance compares planned amounts against actual results. This can be calculated at total budget level or by category.
Simple formula:
Budget variance = Planned budget - Actual spending
Timing differences between planned and actual expenses
A negative variance often signals budget pressure. A positive variance may look good, but it can also mean delayed work, postponed purchases, or unrealistic planning assumptions.
How to review variance in context
Not all variance deserves escalation. A seasoned manager separates noise from pattern.
Review variance using these filters:
One-time exceptions: Vendor true-ups, emergency repairs, or approved off-cycle purchases
Recurring issues: Repeated labor overruns, chronic software overuse, or underestimated material costs
Timing effects: Expenses pulled forward or delayed into another reporting period
Category concentration: Whether a few categories are driving most of the deviation
A smart approach is to drill from total variance into category-level variance. If one department is stable but one cost category keeps missing plan, that is where action should happen.
Budget Report KPI 2: Burn rate
If variance tells you where you stand now, burn rate tells you how quickly you are moving toward budget exhaustion. It is one of the most practical metrics for ongoing budget tracking.
Why burn rate matters
Burn rate measures how fast funds are being used over time. This helps teams determine whether the current spending pace can be sustained through the full reporting period.
Simple formula:
Burn rate = Total spending to date / Number of elapsed periods
Depending on the use case, the period may be days, weeks, or months.
Burn rate helps answer questions such as:
Are we spending faster than planned?
Will the budget last through the quarter or project lifecycle?
Is the current pace aligned with delivery milestones?
Do we need to reallocate resources now?
For project-based environments, burn rate is especially useful because it connects financial control to execution progress. Spending too fast early in the cycle often creates constraints later when critical work remains.
When burn rate becomes a warning sign
Burn rate becomes a genuine warning sign when trends break expected patterns. Watch closely for:
Sudden acceleration in spending without a matching business justification
Seasonal spikes that may be normal but still require planning
Delayed expenses that make prior periods look healthier than reality
Front-loaded costs that reduce flexibility later
Flat periods followed by sharp catch-up spending, often caused by late invoices or procurement delays
The right response is not always cost reduction. Sometimes the answer is better scheduling, more accurate accruals, or revised forecasting. The point of burn rate is early visibility.
These two KPIs work best together. Forecast accuracy tells you how reliable your planning process is. Remaining budget tells you how much room you still have to operate.
Forecast accuracy
Forecast accuracy compares projected spending with actual outcomes. It is one of the strongest indicators of budget maturity. If your forecasts are routinely off, then even a well-designed budget report will not support good decisions.
Simple formula:
Forecast accuracy = 1 - |Forecast - Actual| / Actual
Used over time, this metric helps finance and operations teams improve planning assumptions, resource estimates, and spending models.
To improve forecast accuracy:
Review assumptions at each reporting cycle
Incorporate known commitments, not just posted transactions
Separate fixed costs from variable costs
Adjust for seasonality, project phase, or business growth
Compare forecast error by category, not only in total
A forecast should be a living estimate, not a frozen guess from the start of the year.
Remaining budget
Remaining budget is the clearest indicator of near-term financial capacity. It shows how much funding is still available after actual spending and known commitments.
This KPI is essential because a budget may appear healthy on actuals alone while major committed costs are still pending. That creates false confidence.
Use remaining budget to support decisions such as:
Whether to approve new spending
Which initiatives should be prioritized
Whether funds can be reallocated
When escalation or scope reduction is necessary
In mature reporting environments, remaining budget should be visible at both summary level and category level so managers can see where flexibility still exists.
Actionable best practices for implementing a budget report
The difference between an average budget report and a high-value one usually comes down to operating discipline. Here are proven best practices I would recommend to any finance or operations leader.
1. Standardize the reporting logic before you automate
Make sure every team defines budget, actuals, commitments, variance, and forecast the same way. If departments use different rules, your dashboard will look polished but remain unreliable.
Totals are useful, but action usually comes from exceptions. Flag categories that exceed thresholds such as:
Variance above 10%
Burn rate above plan for two consecutive periods
Forecast error above tolerance
Remaining budget below a critical threshold
This helps managers focus on what needs intervention instead of scanning every row.
3. Add commentary directly inside the report
Do not force leaders to read numbers in one file and explanations in another. Add a short note field for each major variance or risk.
Good commentary includes:
What changed
Why it changed
Whether it is one-time or recurring
What action is recommended
This is especially important when presenting to executives who need context fast.
4. Match report frequency to budget volatility
Not every budget requires the same review rhythm. High-change environments need short feedback loops. Stable functions need consistency more than frequency.
A practical model:
Weekly for projects with high cash movement or cost variability
Monthly for department operating budgets
Quarterly for strategic budget reviews and reforecasting
5. Use dashboard tools to reduce manual consolidation
If teams are copying data across multiple spreadsheets every cycle, errors and delays are inevitable. A reporting platform like FineReport can help centralize data, automate refreshes, standardize templates, and publish visual budget reports that stakeholders can actually use.
Common mistakes and how to make your budget report more useful
Even experienced teams undermine budget tracking with reporting habits that make interpretation harder than it should be.
Mistakes to avoid
Reporting too much detail without clear takeaways
A report overloaded with line items, formulas, and raw transaction dumps slows decisions. Readers need summary signals first, then drill-down access if needed.
Updating too infrequently to catch issues early
A delayed budget report turns management into historical review. If the report arrives after corrective options are gone, its value drops sharply.
Tracking totals without explaining major changes
A number alone does not tell the story. If a category is 18% over budget, stakeholders need to know whether it was caused by scope growth, timing shifts, supplier changes, or poor planning.
Ways to improve the report over time
Standardize the layout so readers can scan each update quickly
Consistency matters. When the layout stays stable, users know exactly where to find variance, burn rate, forecast, and remaining budget every cycle.
Add brief commentary for trends, risks, and recommended actions
Even two or three lines of commentary can dramatically improve report usefulness. It shortens back-and-forth questions and improves accountability.
Refine the template as reporting needs change
Budget reporting is not static. As your team matures, you may need to add commitment tracking, owner accountability, rolling forecasts, or exception alerts. Update the template intentionally rather than letting ad hoc fields accumulate over time.
A good rule: if readers ask the same question every reporting cycle, the report should evolve to answer it directly.
Final takeaway: build a budget report for action, not just recordkeeping
A high-performing budget report does more than document spending. It helps teams control outcomes while there is still time to act. If you focus on the four KPIs that matter most—budget variance, burn rate, forecast accuracy, and remaining budget—you create a reporting system that supports better planning, faster intervention, and stronger financial discipline.
Start simple. Keep the structure tight. Use commentary to explain exceptions. And if manual spreadsheet work is slowing your team down, move toward a dashboard-based reporting approach that improves visibility without increasing reporting burden.
FineReport is a practical option for teams that want to turn budget worksheets into dynamic, decision-ready reports with standardized templates, automated updates, and clear executive dashboards.
A useful budget report should show planned budget, actual spending, variance, remaining budget, and a forecast for the end of the period. It should also highlight risks or unusual changes so managers can act quickly.
The most important KPIs are planned budget, actual spending, budget variance, and burn rate. Together, they show how much was approved, what has been used, how far off plan you are, and whether spending is happening too fast.
The best update frequency depends on how quickly spending changes. Fast-moving projects often need weekly reporting, while stable departments may only need monthly updates.
A budget worksheet is a detailed working file that stores transactions, formulas, and notes. A budget report is a summary view that turns that data into KPIs, trends, and decisions for managers or executives.
Yes, many teams use reporting tools like FineReport to connect live data, standardize templates, and automate calculations. This reduces manual work, improves accuracy, and makes budget tracking more timely.
Product Trial
FineReport
Pixel-perfect reports · Interactive dashboards · Easy data entry · Digital twins