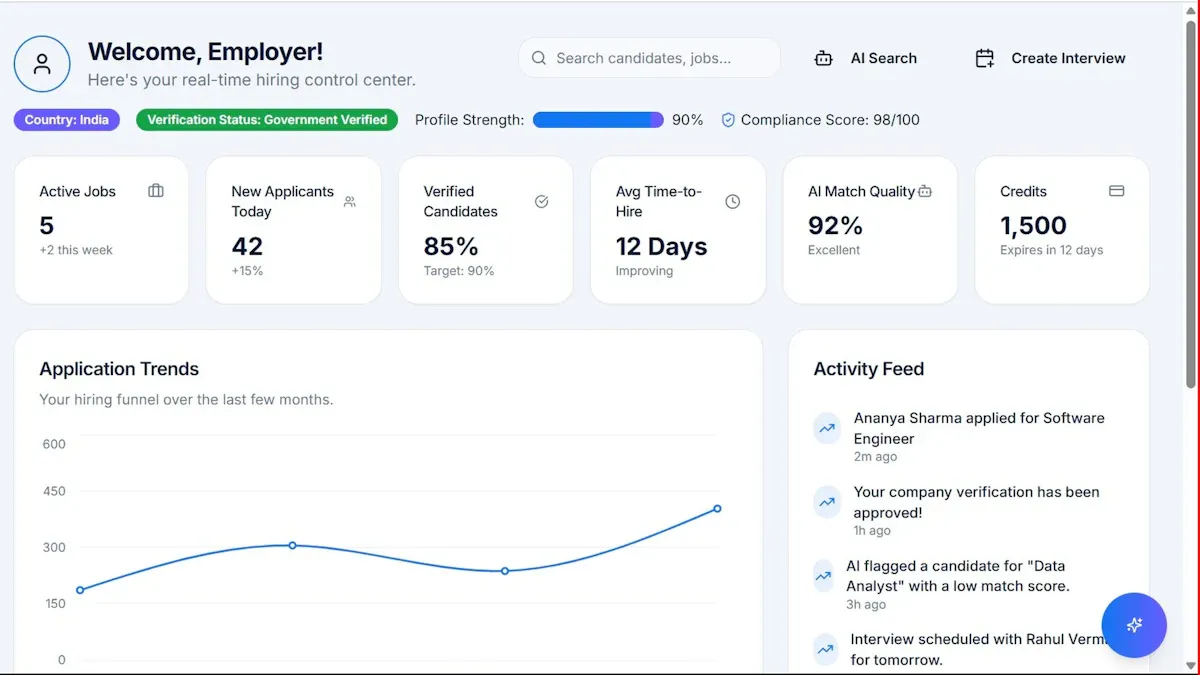
A web analytics report should do more than count visits, sessions, and pageviews. For revenue-focused teams, its real job is to explain how traffic turns into leads, pipeline, sales, and long-term customer value. If you are a marketing leader, ecommerce manager, operations director, or analyst, the pain is familiar: plenty of data, unclear attribution, fragmented dashboards, and too little insight into what actually drives revenue. A strong report closes that gap by connecting acquisition, behavior, conversion, and commercial outcomes in one decision-ready view.
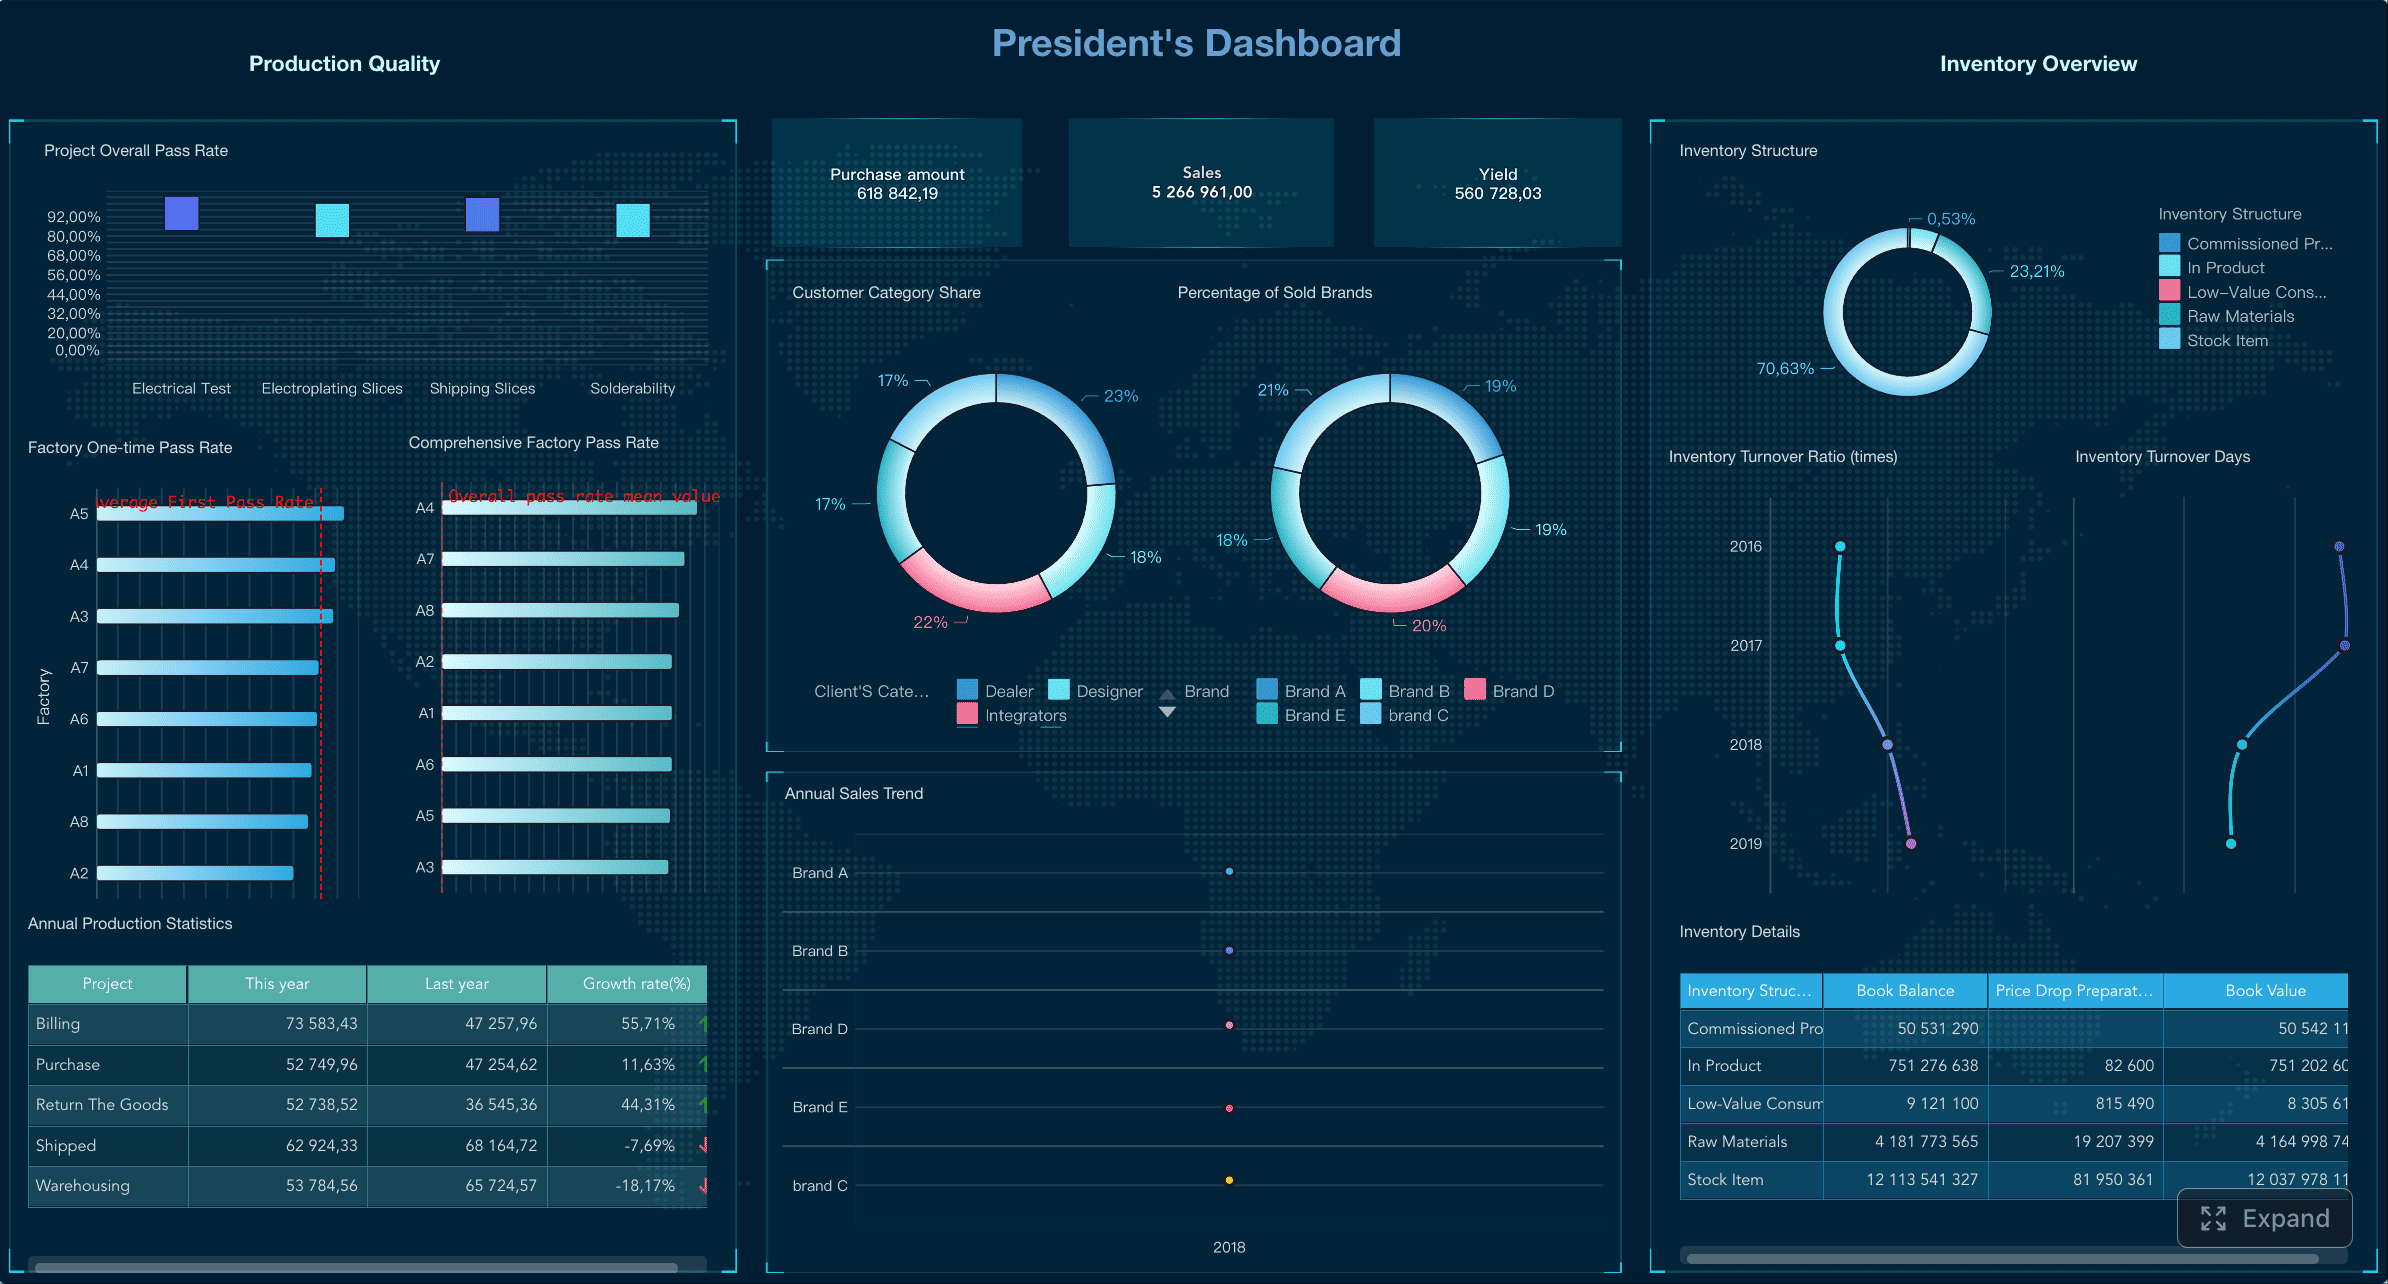
All reports in this article are built with FineReport.
What a web analytics report should answer for revenue-focused teams
A revenue-oriented web analytics report is not just a traffic summary. It is a management tool that helps teams decide where to invest, what to fix, and which opportunities to scale.
At a minimum, the report should distinguish between tracking traffic and explaining business contribution. Tracking traffic tells you how many visitors arrived. Explaining contribution tells you which channels, campaigns, pages, and audience segments moved people toward a commercial outcome.
A useful report should answer questions such as:
- Which traffic channels drive the highest-converting visitors?
- Which campaigns generate revenue efficiently, not just clicks?
- Which landing pages produce qualified leads or purchases?
- Which audience segments show the highest intent and value?
- Where do users drop off before converting?
- How much revenue is influenced by organic, paid, email, referral, and direct traffic?
- Which changes from the previous period require action now?
For cross-functional teams, alignment matters as much as analysis. Marketing may care about campaign performance, sales may care about lead quality, ecommerce may care about average order value and cart abandonment, and leadership may care about revenue impact and return on investment. The best web analytics report serves all of them with a shared structure and consistent definitions.
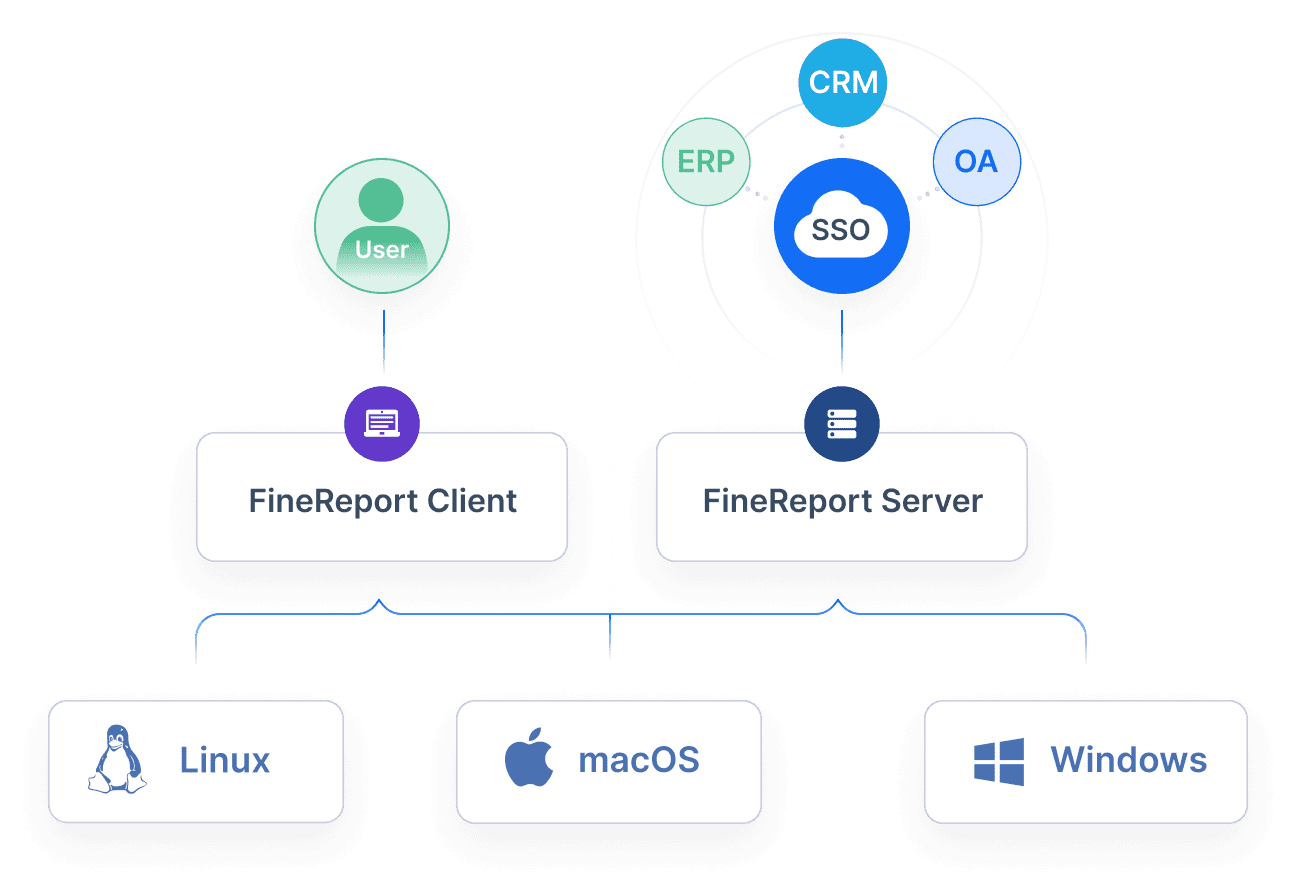
This is where FineReport fits naturally. It helps enterprises build role-based dashboards, combine web data with CRM and sales records, and standardize reporting across teams without relying on static exports alone.
Choose the right metrics before you build the web analytics report
Before building any charts, define the business logic. Most reporting problems begin when teams select metrics based on what is easy to pull rather than what is useful for decisions.
Start with business goals and conversion actions
Begin with the company’s primary business goals. A B2B team may focus on demo requests, qualified leads, and pipeline influenced. An ecommerce team may prioritize purchases, revenue, average order value, and repeat purchase rate. A content-led business may track newsletter signups, trial activations, and assisted conversions.
Separate primary conversions from secondary conversions:
- Primary conversions: purchase, submitted sales form, booked demo, paid subscription
- Secondary conversions: newsletter signup, brochure download, account creation, product video completion
- Revenue events: completed order, subscription renewal, upsell, closed-won opportunity
- Assisted actions: return visits, product page views, cart additions, pricing page visits, multi-touch campaign interactions
This step keeps the report tied to commercial outcomes. It also prevents vanity metrics from dominating the story.
Connect channel metrics to conversion performance
A channel should never be judged by traffic alone. A source delivering 20,000 visits may be far less valuable than a source delivering 2,000 visits with stronger purchase intent.
Your web analytics report should compare channel performance across the metrics that matter most:
- Acquisition volume
- Engagement quality
- Conversion rate
- Revenue contribution
- Average order value
- Cost efficiency
- Return on ad spend
This is where web traffic analytics becomes commercially useful. Instead of only showing where visitors came from, it shows which visits turned into measurable value.
Include the essential report views teams use most
Most teams repeatedly rely on a core set of report views. These should be built into your reporting structure from day one.
Key Metrics (KPIs)
- Sessions: Total visits to the site within the reporting period.
- Users: Unique visitors interacting with the website.
- New Users: First-time visitors, useful for acquisition analysis.
- Engaged Sessions / Engagement Rate: Indicator of visit quality and interaction depth.
- Bounce Rate: Share of sessions with minimal engagement; useful when interpreted alongside landing page intent.
- Conversion Rate: Percentage of users or sessions completing a defined goal.
- Primary Conversions: High-value actions directly tied to revenue outcomes.
- Assisted Conversions: Interactions that supported a later conversion but were not the final touch.
- Revenue: Total sales or attributed commercial value generated.
- Average Order Value (AOV): Average revenue per purchase.
- Revenue per Session: Revenue generated divided by total sessions.
- Cost per Acquisition (CPA): Marketing cost required to generate one conversion.
- Return on Ad Spend (ROAS): Revenue generated for each unit of ad spend.
- Customer Lifetime Value (CLV or LTV): Long-term revenue expected from acquired customers.
- Cart Abandonment Rate: Percentage of users who start checkout but do not complete purchase.
- Lead-to-Customer Rate: Share of leads that ultimately become customers.
- Top Landing Page Conversion Rate: Ability of entry pages to generate next-step action.
- Exit Rate by Key Page: Where users leave the site before converting.
- Retention / Repeat Purchase Rate: How often users return and convert again over time.

Core report views
- Channel performance report: Compares source, medium, campaign, cost, conversions, and revenue.
- Landing page performance report: Evaluates entry pages by intent, bounce behavior, and conversion output.
- Campaign attribution report: Connects UTM-tagged campaigns to assisted and direct outcomes.
- Audience behavior report: Segments performance by device, geography, user type, and cohort.
- Conversion path report: Reveals the sequence of touches leading to conversion.
- Retention trend report: Shows whether acquired users continue generating value after first conversion.
- Executive summary report: Condenses all major performance shifts into a fast decision brief.
Use different web analytics report types based on the objective:
- Diagnosis: When performance drops and you need root-cause analysis
- Optimization: When teams are testing channels, pages, or offers
- Executive reporting: When leadership needs trends, impact, and next actions in one view
How to structure a web analytics report step by step
A strong structure makes the report easier to read, compare, and act on. It should guide stakeholders from high-level results to the underlying drivers.
Build an executive summary first
Always start with the executive summary. Busy stakeholders should not need to interpret raw charts before understanding the story.
Your summary should include:
- Headline revenue results for the period
- Major changes versus the previous period
- Top-performing and declining channels
- Most important conversion shifts
- The three highest-priority actions to take next
A good summary sounds like this: organic traffic grew 18%, but paid social revenue fell 22% due to weaker landing page conversion on mobile. Email generated the highest return on ad spend. Recommendation: shift budget from low-converting social campaigns to branded search and lifecycle email, while fixing mobile form friction on the top paid landing page.
Organize the report into clear sections
After the summary, structure the report into consistent sections. This creates a clean reading flow and simplifies recurring analysis.
A practical section order looks like this:
-
Traffic overview
- Sessions, users, new users, engagement trends
- Period-over-period and year-over-year comparisons
-
Channel analysis
- Source and medium performance
- Conversion rate, revenue, CPA, ROAS by channel
-
On-site behavior
- Landing pages, exit pages, navigation flow, device behavior
- Bounce rate and engagement by page type
-
Conversion analysis
- Funnel performance
- Lead generation, checkout completion, drop-off points
- Assisted conversions and attribution patterns
-
Revenue impact
- Revenue by campaign, channel, landing page, and segment
- AOV, revenue per session, repeat purchase behavior
-
Recommendations
- Clear next steps, owners, estimated impact, and timing
Also include:
- Period comparisons to highlight movement over time
- Annotations for campaign launches, site changes, tracking updates, and promotions
- Segmentation by device, geography, audience type, or customer status
Use a web analytics report template to speed up reporting
A web analytics report template saves time and improves consistency. It standardizes recurring sections, chart formats, naming conventions, and commentary blocks. This matters in enterprise environments where stakeholders compare reports across weeks, markets, business units, or brands.
However, do not confuse a template with a finished analysis. A template should create efficiency, not remove thinking. Leave room for:
- Custom commentary on anomalies
- Campaign-specific analysis
- Notes on tracking limitations
- Strategic recommendations based on findings
FineReport is especially useful here because teams can build reusable reporting templates, automate data refreshes, and customize outputs for executives, marketers, and analysts without rebuilding each report from scratch.
 Get Ready-to-Use Dashboard Templates in Fine Gallery
Best practices for turning web analytics report into action
A report creates value only when it leads to decisions. These best practices help move from observation to execution.
Make the report easy to interpret
Complexity does not impress stakeholders. Clarity does.
Use these principles:
- Write plain-language summaries above or below charts
- Keep metric definitions consistent across the report
- Highlight trends, outliers, and sharp performance shifts visually
- Pair macro outcomes with page-level evidence
- Show why something changed, not just that it changed
For example, instead of saying “Paid search CVR decreased,” say “Paid search conversion rate fell from 3.8% to 2.9%, driven mainly by mobile traffic landing on the spring offer page, where form completion dropped after the design update.”
Avoid common reporting mistakes
Many web analytics reports fail because they create noise or distort causality.
Common mistakes include:
- Attribution gaps between analytics, ad platforms, and CRM systems
- Inconsistent date ranges across sections
- Missing or broken tracking tags
- Overreliance on last-click attribution
- Reporting too many metrics without prioritization
- Treating all traffic growth as positive regardless of quality
- Ignoring assisted conversions and cross-device behavior
When a metric changes unexpectedly, first verify tracking integrity before drawing strategic conclusions.
Add context, benchmarks, and examples
Data without context is easy to misread. Strong reporting compares results against:
- Internal targets
- Prior periods
- Campaign objectives
- Seasonal expectations
- Historical benchmarks
- Segment-level norms
If a landing page conversion rate drops from 5.2% to 4.7%, that may not be alarming during a low-intent seasonal period. But if branded paid traffic falls at the same time while costs rise, the issue becomes commercially significant.
Practical implementation steps from a consultant’s playbook
Here are four concrete steps to implement a web analytics report that teams will actually use:
-
Map every key conversion to a business owner
- Assign ownership for purchases, qualified leads, demo bookings, and retention events.
- This ensures each metric has an operational response, not just a chart.
-
Create a channel-to-revenue model before building visuals
- Define how each source, campaign, and touchpoint will be classified.
- Standardize UTM conventions, attribution rules, and revenue mapping.
-
Build one executive layer and one analyst layer
- Executives need summary, impact, and actions.
- Analysts need drill-down views for diagnosis.
- Do not force both audiences into one cluttered dashboard.
-
End each reporting cycle with named actions
- Every major finding should translate into an owner, due date, and expected outcome.
- This is how reporting becomes a growth engine rather than a retrospective document.
Example workflow of web analytics report: from raw data to revenue recommendations
The most effective reporting workflows are repeatable. They move from collection to diagnosis to action in a disciplined way.
Analyze your site traffic with a revenue lens
Start by reviewing source quality, not just source volume. Then examine how that traffic behaves once it lands on the site.
A typical workflow looks like this:
-
Pull traffic and conversion data by source
- Organic, paid search, paid social, email, referral, direct, affiliates
-
Evaluate landing page intent
- Does the content match the campaign promise or keyword intent?
- Are high-cost campaigns sending traffic to pages with weak conversion paths?
-
Review user paths
- Identify common routes from entry to conversion
- Spot unnecessary steps, friction points, and dead ends
-
Analyze conversion drop-off
- Forms, cart, checkout, pricing, signup, and booking flows
- Compare by device and audience segment
-
Segment for hidden opportunities
- Device
- Geography
- New vs returning users
- Campaign cohort
- Audience type
- Product category
This process reveals where value is created or lost. For example, desktop traffic from organic search may convert well on educational pages, while paid social mobile traffic may bounce quickly from promotional landing pages with slow load time or poor message match.
Turn findings into prioritized actions
The final step is where many teams stop too early. Insight is not enough. The report must recommend action in priority order.
A practical recommendation table should include:
| Finding | Recommended Action | Owner | Expected Impact | Follow-Up Metric |
|---|---|---|---|---|
| Paid social drives high traffic but low conversion | Reduce budget on weak ad sets and retest audience targeting | Performance Marketing Manager | Lower wasted spend, improve CPA | Conversion rate, CPA |
| Top landing page has strong traffic but high bounce on mobile | Redesign mobile hero, shorten form, improve page speed | CRO Lead / Web Team | More qualified conversions | Mobile CVR, bounce rate |
| Email generates highest ROAS | Expand lifecycle workflows and resend to engaged non-converters | CRM Manager | Higher repeat revenue | Revenue per email session |
| Organic blog posts assist conversions but underreport in last-click | Add assisted conversion view in executive report | Analytics Lead | Better budget allocation | Assisted revenue share |
| Checkout abandonment increased after release | Audit tracking and payment UX | Ecommerce Operations | Recover lost orders | Cart abandonment rate |
FineReport can support this workflow by combining dashboards, drill-down analysis, scheduled report delivery, and role-based views in one reporting environment. That is especially valuable when recommendations depend on data from web analytics, CRM, and revenue systems together.
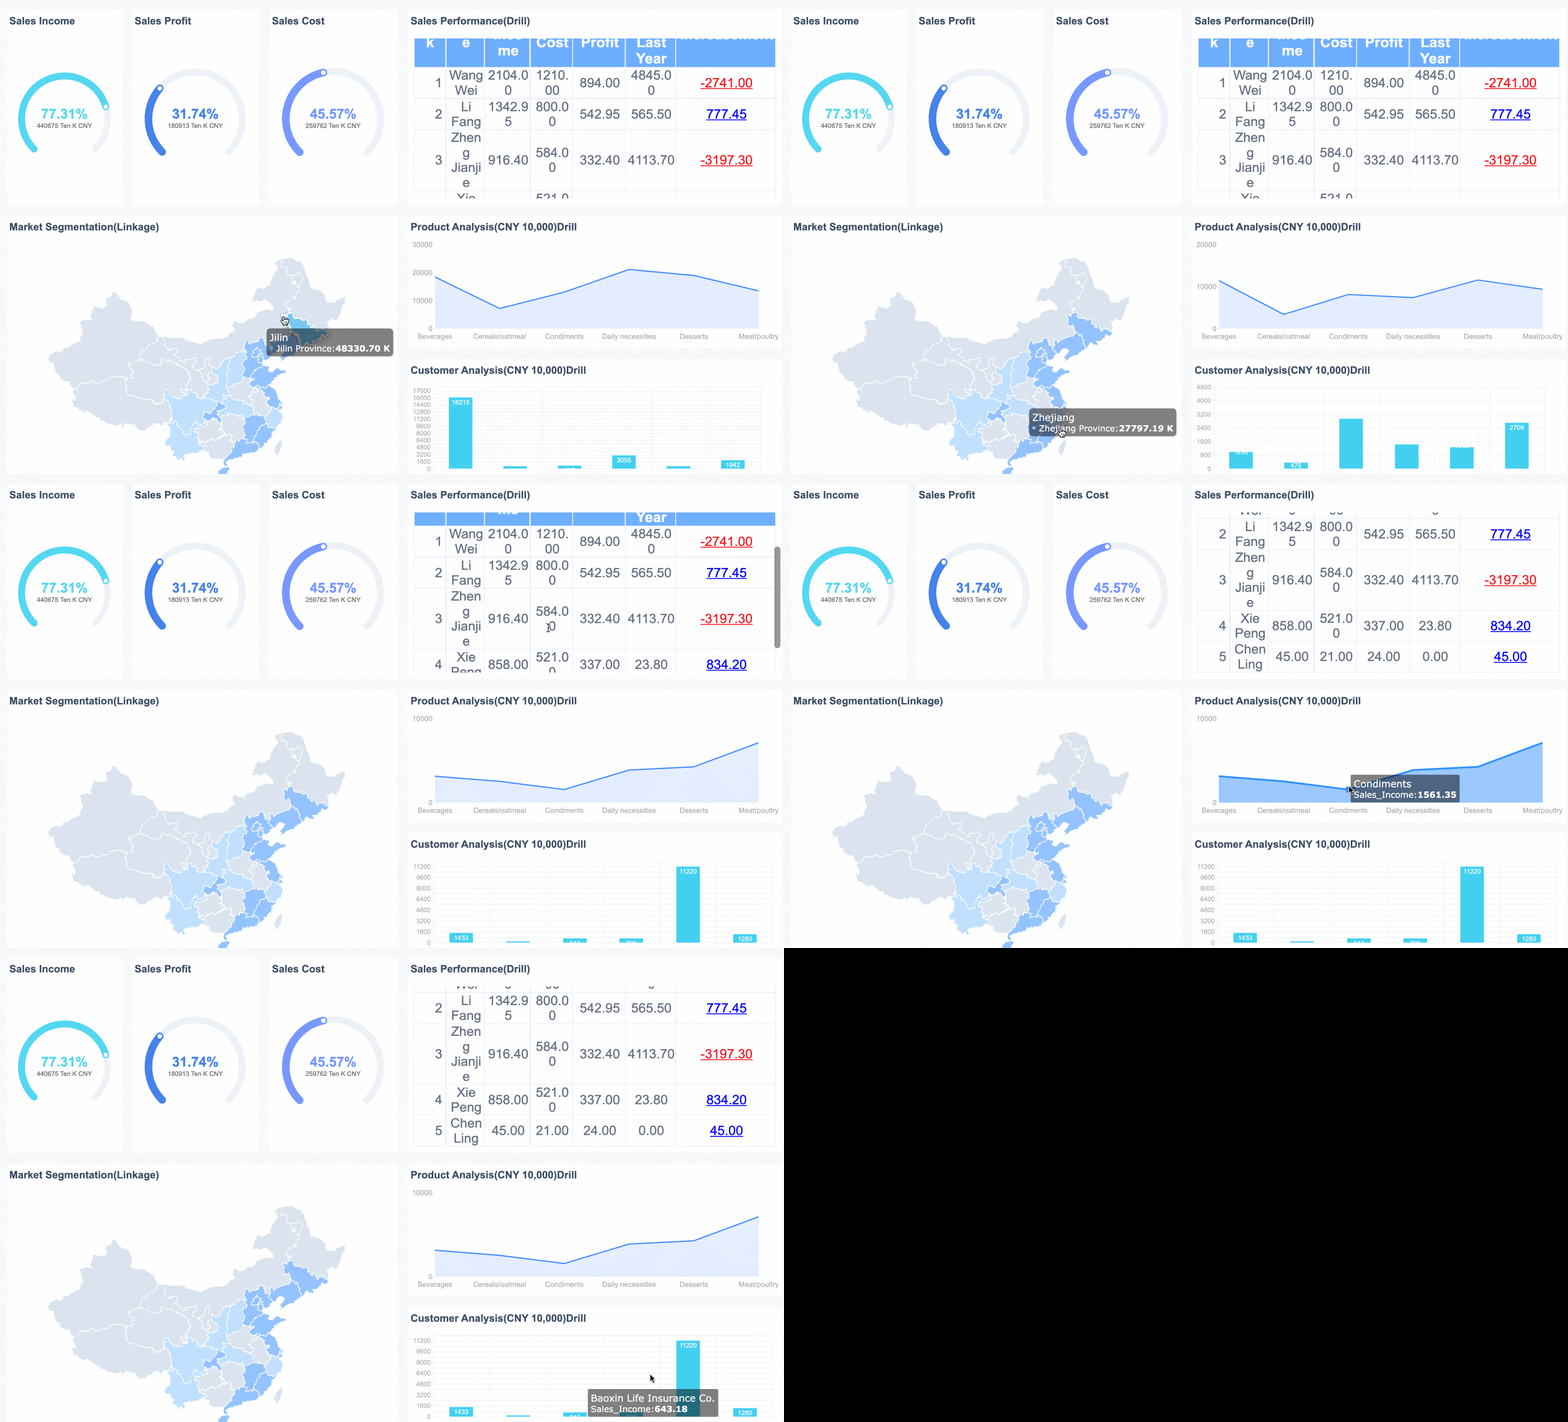 FineReport Drill-down Analysis
What to include in your final web analytics report cadence
A good report is not a one-off document. It is part of a reporting cadence that supports decisions consistently over time.
Choose frequency based on business rhythm:
- Weekly: fast-moving campaigns, ecommerce promotions, paid media optimization
- Biweekly: growth teams balancing experimentation with execution
- Monthly: executive reviews, broader performance trends, strategic planning
- Quarterly: deeper attribution reviews, cohort analysis, and budget reallocations
Your reporting cadence should include:
- A standard time frame for comparisons
- A stable KPI definition library
- Archived versions for historical review
- Notes on experiments, campaign launches, and tracking changes
- A clear record of decisions made and actions planned
Each final web analytics report should end with three things:
- Decisions made
- Actions assigned
- Questions to investigate next
That closing discipline turns reporting into a management system. It helps teams learn from trends, preserve institutional memory, and improve faster with each cycle.
Final takeaway
A high-performing web analytics report does not merely summarize traffic. It explains how traffic contributes to revenue, where the funnel breaks, which channels deserve more investment, and what teams should do next. When structured properly, it becomes one of the most practical tools for aligning marketing, sales, ecommerce, and leadership around measurable growth.
If you want to build scalable, enterprise-ready web analytics reporting with executive dashboards, reusable templates, and cross-system integration, FineReport is a strong fit for turning raw data into revenue decisions.
FAQs
It should connect traffic sources, user behavior, conversions, and revenue in one view. The most useful reports include channel performance, landing page results, funnel drop-off, conversion rate, revenue contribution, and efficiency metrics like CPA or ROAS.