An operating expense report is the management tool businesses use to track the ongoing costs of running daily operations, from payroll and rent to software subscriptions and maintenance. For finance leaders, operations managers, and business owners, this report is not just bookkeeping. It is how you spot cost creep, control margins, defend budgets, and make faster decisions before small inefficiencies become material profit leaks.
Click To Try The Dashboard
All reports in this article are built with FineReport
What an Operating Expense Report Is and Why It Matters
An operating expense report summarizes the day-to-day business costs required to keep a company functioning. It typically covers a defined reporting period, most often monthly, and organizes spending into categories so stakeholders can see where money is going and whether expenses are aligned with plan.
Unlike a broad financial package, this report is focused on operational spending visibility. Its purpose is practical: monitor recurring expenses, compare actual spending to budget, and identify unusual changes quickly enough to act.
Many teams confuse an operating expense report with other finance documents. They overlap, but they answer different questions:
Operating expense report: What did we spend to run the business this period?
Budget report: What did we plan to spend, and where are we over or under?
Cash flow statement: How did cash move in and out of the business overall?
Balance sheet: What do we own and owe at a point in time?
Income statement: How did revenue, costs, and expenses affect profitability?
The operating expense report is more detailed than a high-level income statement and more action-oriented than a balance sheet. It helps managers control expenses at the source rather than simply reviewing results after the month closes.
Who uses an operating expense report
An effective operating expense report supports multiple decision-makers:
Business owners: to protect margins and monitor overhead
Finance teams: to validate classifications, close faster, and improve forecasting
Department managers: to control spending within their teams
Operations directors: to identify cost drivers across sites, units, or business functions
Investors and executives: to evaluate efficiency, scalability, and cost discipline
Key Metrics (KPIs)
For an operating expense report to be decision-ready, it should include these core KPIs:
Total operating expenses: The full amount spent on operations during the reporting period.
Expense by category: Spending grouped by rent, payroll, utilities, software, marketing, and other standard buckets.
Budget vs actual variance: The difference between planned and actual spending.
Variance percentage: The size of over- or underspending expressed as a percentage.
Month-over-month change: How each expense category moved compared with the prior month.
Year-over-year change: Whether expenses are trending up or down compared with the same period last year.
Expense ratio: Operating expenses divided by revenue, used to evaluate cost efficiency.
Cost per employee: Total operating expenses or selected categories divided by headcount.
Cost per location: Operating expenses allocated across branches, stores, plants, or offices.
Top cost drivers: The largest categories contributing to total spend.
Recurring vs one-time expenses: A split that helps teams separate structural costs from anomalies.
Department-level spend: Spending assigned to teams or business units for accountability.
What to Include in an Operating Expense Report
A useful operating expense report must be complete enough for analysis but structured enough for rapid review. The best reports standardize fields and categories so that every month is comparable.
Core expense categories
Most reports start with standard operating categories. Common examples include:
Rent and lease payments
Payroll and employee benefits
Utilities
Software and SaaS subscriptions
Insurance
Office supplies
Marketing and advertising
Repairs and maintenance
Customer service expenses
Professional fees
Travel and local transportation
Shipping related to operations
A strong report also distinguishes among different cost behaviors:
Recurring costs: Predictable expenses such as rent, salaries, software renewals, and insurance
Variable costs: Expenses that rise or fall with activity, such as support staffing, utilities, or shipping
One-time operating costs: Unusual but still operational items, such as emergency repairs or temporary contractor support
This distinction matters because recurring increases often signal structural cost growth, while one-time spikes may not require permanent budget changes.
Time period, totals, and comparisons
An operating expense report should always be tied to a clear reporting period. In most companies, monthly reporting is the standard because it balances timeliness with enough data to identify patterns.
Each report should include:
Reporting month or period
Category subtotals
Grand total operating expenses
Prior-period comparisons
Budget-versus-actual figures
Variance amounts and percentages
Without comparisons, the report is just a list of transactions. With comparisons, it becomes a management tool. A marketing line that rises 18% may be acceptable if sales grew faster. The same increase may be a concern if revenue stayed flat.
Accuracy is what gives this report credibility. Supporting data should make it possible to verify transactions, resolve disputes, and prepare for audit or management review.
Include fields such as:
Vendor or payee name
Payment date
Department or cost center tag
General ledger code
Transaction notes
Receipt or invoice reference
Approval status
Payment method
These details are especially important in larger organizations where multiple departments submit expenses and finance must validate classifications before close.
How to Read an Operating Expense Report
Reading an operating expense report well is not about scanning totals. It is about identifying cost behavior, isolating drivers, and understanding what the numbers imply for profitability and operational efficiency.
Begin with the categories that consume the most money. In most businesses, the biggest lines are usually payroll, occupancy, technology, logistics, or marketing.
Look for:
Largest expense categories
Steady upward movement over several periods
Sharp one-month spikes
Seasonal patterns
Repeated overruns in the same department
A single month may not tell the full story. Three to six periods often reveal whether a change is random, seasonal, or structural. For example, utility costs may jump seasonally, while software costs often rise due to unchecked subscription growth.
Evaluate against revenue and operating profit
Operating expenses should never be interpreted in isolation. Compare them with:
This gives context. A company may spend more in absolute terms while still improving efficiency if revenue grows faster. On the income statement, operating expenses usually appear below gross profit and before operating income. That placement matters because these costs directly shape the profit generated from core operations.
If gross profit is stable but operating income is shrinking, operating expenses are often the first place to investigate. This is where the operating expense report becomes essential for root-cause analysis.
Use ratios and benchmarks
Ratios turn raw spending into comparable performance indicators. Useful benchmarks include:
Benchmarks help teams identify whether a high number is actually a problem. A rising payroll line may be justified if output per employee also improves. A flat expense total may still be inefficient if revenue declines.
Examples of Operating Expenses and Common Reporting Mistakes
A lot of reporting errors happen not because teams lack data, but because they classify or interpret costs incorrectly. This is where finance discipline has a direct impact on management quality.
Wages and salaries for administrative or support staff
Office rent
Electricity, water, and internet
Software subscriptions
Customer service payroll or tools
Routine shipping related to operations
Cleaning and janitorial services
Routine repairs and maintenance
Insurance premiums
Advertising and promotional spend
Office and facility supplies
It is equally important to know what usually does not belong in an operating expense report:
Capital expenditures, such as equipment purchases, major system implementations, or property improvements
Debt principal payments
Interest expense, in many reporting structures
Owner distributions or dividends
Large one-time investments that create long-term assets
This separation is essential because capital spending and financing costs are managed differently and should not distort the view of day-to-day operating performance.
Common mistakes to avoid
The most common reporting mistakes include:
Misclassifying capital expenses as operating expenses
This inflates current-period operating costs and hides the true investment profile of the business.
Omitting small recurring charges
Individually minor subscriptions, service fees, and platform add-ons often accumulate into significant overhead.
Failing to separate direct costs, administrative costs, and non-operating items
This weakens profitability analysis and makes the report harder to use for decision-making.
Using inconsistent categories month to month
If one month labels a cost as software and the next as admin expense, trend analysis becomes unreliable.
Ignoring department or cost center tags
Without accountability, it becomes difficult to identify who owns overspending.
How to Report Operating Expenses More Accurately
Better reporting does not always require a major finance transformation. In many cases, accuracy improves quickly when companies standardize inputs, automate recurring steps, and review results with discipline.
Build a simple reporting process
As a consultant, I recommend keeping the process simple, repeatable, and governed. Follow these best practices:
Standardize expense categories
Create a fixed chart of categories for all departments.
Define which items belong under each category.
Document what counts as operating expense versus CapEx or non-operating cost.
Set a monthly reporting calendar
Use consistent cut-off dates.
Define deadlines for submissions, approvals, and reconciliation.
Close the same way every month to improve comparability.
Require supporting documentation
Make vendor invoices, receipts, and notes mandatory.
Tag every expense by department, location, or cost center.
Use approval workflows to reduce miscoding and duplicate entries.
Use one reporting system consistently
Whether using accounting software, spreadsheets, or BI tools, keep logic centralized.
Avoid multiple disconnected files with conflicting formulas.
Establish a single source of truth for actuals, budgets, and variances.
Automate recurring checks
Flag missing documentation.
Highlight budget overruns automatically.
Detect duplicate vendors, unusual spikes, and category anomalies before management review.
These steps help finance teams move from reactive reconciliation to proactive cost management.
The report only adds value if it leads to action. A disciplined monthly review should answer:
Which categories exceeded budget?
Which increases were expected versus avoidable?
Which vendors should be renegotiated?
Which subscriptions, services, or processes can be eliminated?
Which departments need tighter cost controls next month?
Use the findings to:
Cut waste
Adjust departmental budgets
Renegotiate vendor terms
Consolidate duplicate tools
Refine forecasts
Escalate unusual trends early
The companies that manage operating expenses best are not necessarily the ones spending the least. They are the ones that understand their cost structure early enough to act with confidence.
Use FineReport to Build and Automate Your Operating Expense Report
Building this manually is complex; use FineReport to utilize ready-made templates and automate this entire workflow. For enterprise teams, the challenge is not just collecting expense data. It is unifying finance, departmental, and transactional data into one reliable operating expense report with drill-down visibility, budget comparison, workflow control, and executive-ready dashboards.
Connect data from ERP, accounting, and operational systems
Standardize expense classifications across departments
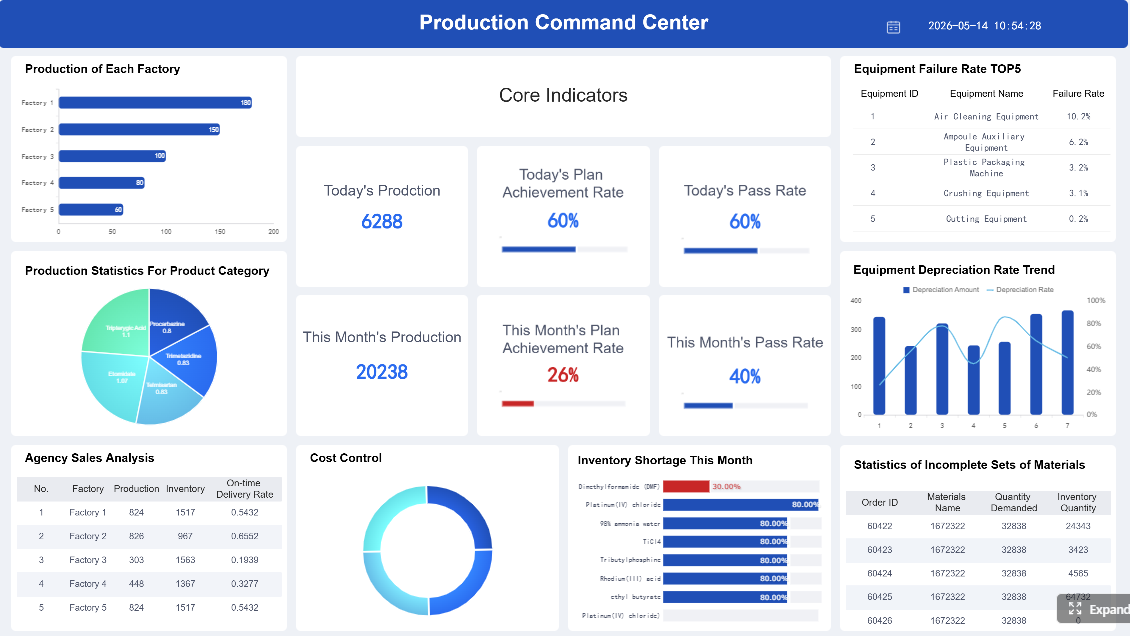
Build monthly operating expense dashboards with variance analysis
Automate distribution, approval, and refresh cycles
Drill from summary totals into transaction-level details
Create management-friendly views for finance, operations, and executives
Get Ready-to-Use Dashboard Templates in Fine Gallery
If your current process depends on spreadsheets, manual consolidation, or disconnected finance exports, you are likely spending too much time assembling the report and not enough time using it. FineReport changes that by turning expense reporting into an automated decision system.
An operating expense report helps businesses track the costs of running daily operations over a set period. It is mainly used to monitor spending, compare actual expenses to budget, and catch unusual cost changes early.
A strong report should include total operating expenses, spending by category, budget versus actual results, and period-over-period comparisons. Many teams also add department-level spend, recurring versus one-time costs, and top cost drivers.
An income statement shows overall profitability by combining revenue, costs, and expenses. An operating expense report is more focused on the details of day-to-day operating costs so managers can control spending more directly.
Operating expenses usually include payroll, rent, utilities, software subscriptions, insurance, marketing, maintenance, and office-related costs. These are the ongoing expenses required to keep the business running.
Start by reviewing total expenses and the largest categories, then compare actual spending to budget and prior periods. Focus on major variances, rising trends, and whether increases are recurring or one-time.
Product Trial
FineReport
Pixel-perfect reports · Interactive dashboards · Easy data entry · Digital twins