

Digital Transformation Challenges: Overcoming Data Fragmentation Across Global Supply Chains
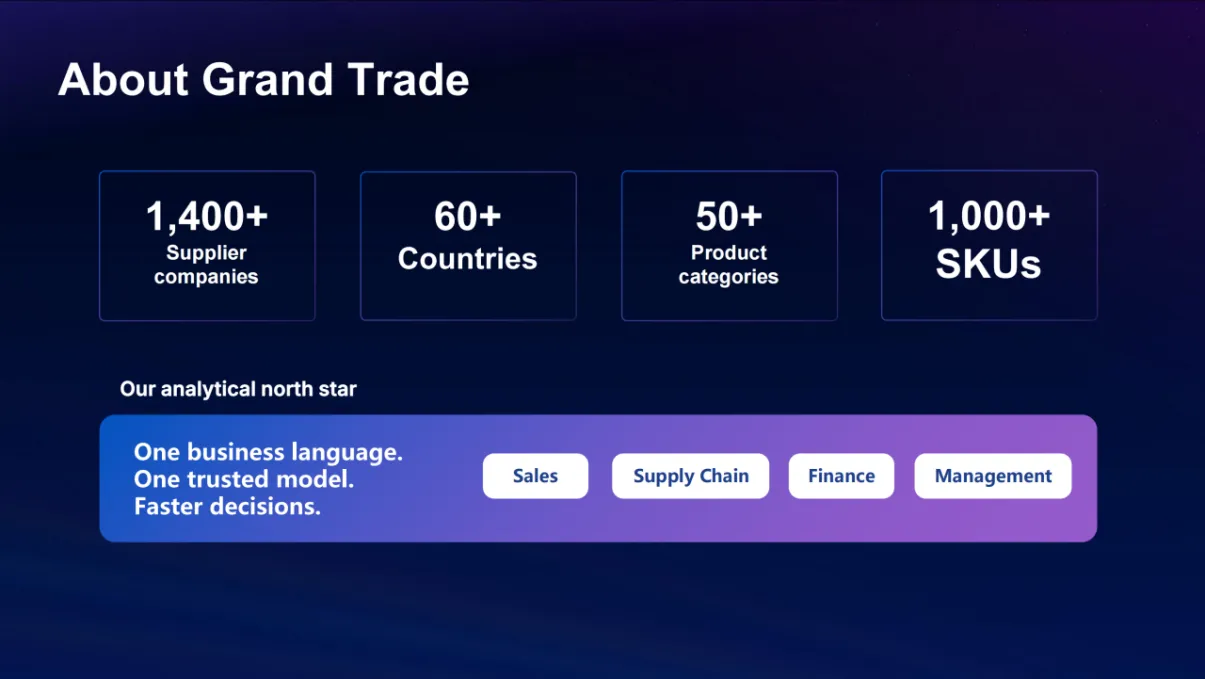
Grand-Trade JSC is one of the leading suppliers of food and non-food products imported from different countries to Russian companies, mainly retail chains.Its business spans more than 60 countries worldwide, serving over 1,400 supplier companies and covering more than 50 product categories and 1,000 SKUs.
Grand Trade has established a clear “Analytics North Star”: one business language, one trusted model, and faster decisions. Its goal is to enable sales, supply chain, finance, and management teams to make day-to-day decisions based on consistent, reliable information.
However, as the business continued to expand, its internal data architecture faced new challenges. Different teams maintained their own Excel files and different versions of data sources, while most data consolidation relied on manual work, resulting in lengthy reporting cycles.
The same KPI could be calculated in different ways, revenue and gross margin were defined using different logic, product hierarchies were duplicated, and dimensions were inconsistent.Bringing these disparate data sources together and establishing consistent KPI definitions became a major challenge for both the IT and business teams.
The Hidden Costs of Digital Transformation: Eroding Trust, Efficiency Bottlenecks, and Data Quality Issues
Under the traditional data architecture, cross-system data integration and report generation relied heavily on manual work and external vendors, creating three major concerns:
• High Communication Costs and a Crisis of Trust:
The same KPI was calculated differently across reports, with duplicated product hierarchies and inconsistent dimensions. Kirill Zelvyansky, BI and DWH Lead at Grand Trade, explains: “On the surface, this looks like a reporting problem, but the deeper issue is trust.
When people spend time debating which numbers are correct, real business conversations end before they even begin.” Low levels of trust slowed down every decision.
• Analytical Capacity Consumed by Data Extraction and Efficiency Bottlenecks:
Grand Trade reviewed its analytical workload for 2024–2025 and found that as much as 45% of analytical capacity was consumed by ad hoc data extracts, while 16% was devoted to report automation, 13% each to routine reporting and market analysis, 10% to budget planning, and just 3% to coordination and communication.
Nearly half of the team's analytical capacity was spent on repetitive, routine data extraction and reporting, severely limiting the time available for in-depth analysis and high-value machine learning (ML) use cases.
• The High Cost of Poor Data Quality:
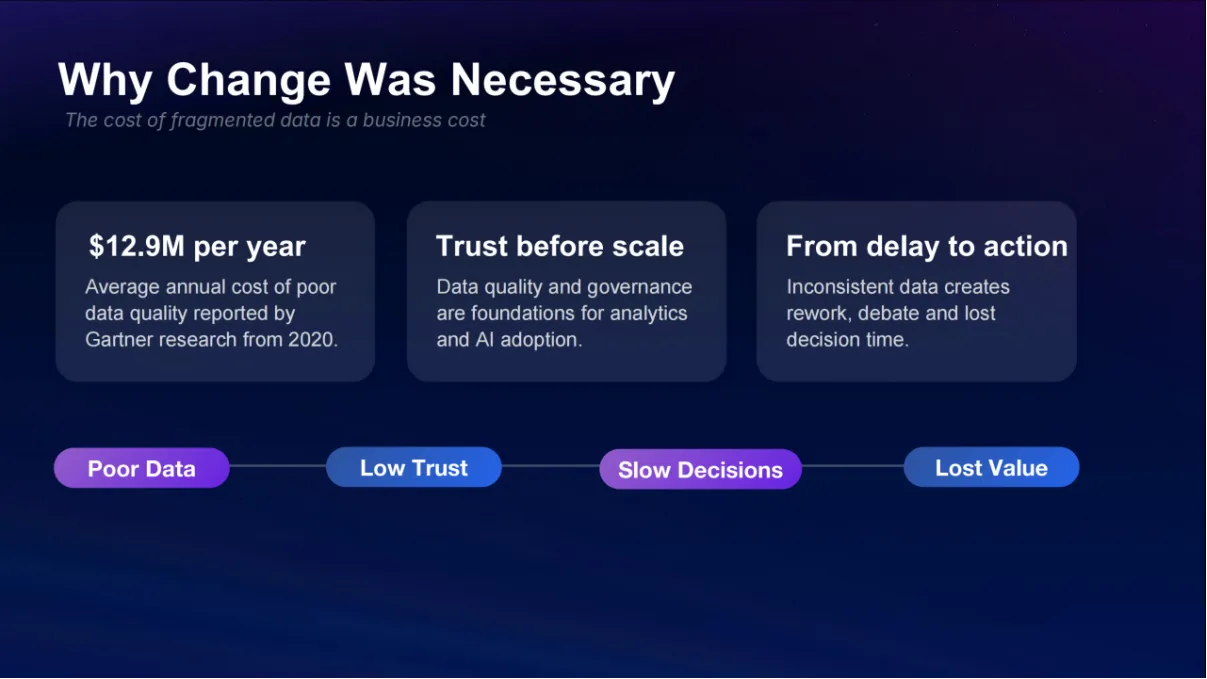
Poor data quality costs organizations an average of $12.9 million annually. Inconsistent data leads to rework, disputes, and lost decision-making time. The challenge for businesses has never been about producing more reports, but about reaching a shared understanding of data, calculation definitions, and accountability.
Implementing FineBI and FineReport to Build a Unified Analytical Data Model and Governance Framework
To break down data silos and improve internal development agility, Grand Trade decided to adopt FineBI and FineReport as its enterprise data hub.
Early in the project, Grand Trade made a key decision: “Build trust first, then scale analytics.” Data quality and governance are the foundation of analytics and AI applications. To this end, the company established five strategic pillars for data: data governance, master data management, metadata management, self-service analytics, and data as a product.
In designing its architecture, Grand Trade followed the principle of “trusted data flow.” ERP, CRM, WMS, financial systems, and supplier data were integrated as source systems. ETL/ELT processes were used for data ingestion and transformation, with data quality validation, cleansing, and enrichment embedded throughout. A centralized, scalable data warehouse (DWH) was established, with a unified analytical data model (Unified Model) built on top of it.
FineBI then provided interactive self-service analytics, while FineReport supported governed, enterprise-grade reporting and dashboards, empowering sales, finance, supply chain, and management teams.Throughout the architecture, data governance and metadata management were embedded across all layers. Through a data catalog, glossary, data lineage, ownership, and metadata, Grand Trade ensures that “trusted data unlocks greater possibilities.”
By implementing a data catalog, Grand Trade connected technical metadata with business context, enabling users to independently answer key questions: What does this KPI mean? Where does the data come from? How is it transformed? Who owns it? Is it approved for use? This significantly reduced communication costs.
At the same time, Grand Trade used FineBI to create a “guardrailed self-service analytics” experience, simplifying the user journey into four steps: Explore → Analyze → Share → Act.
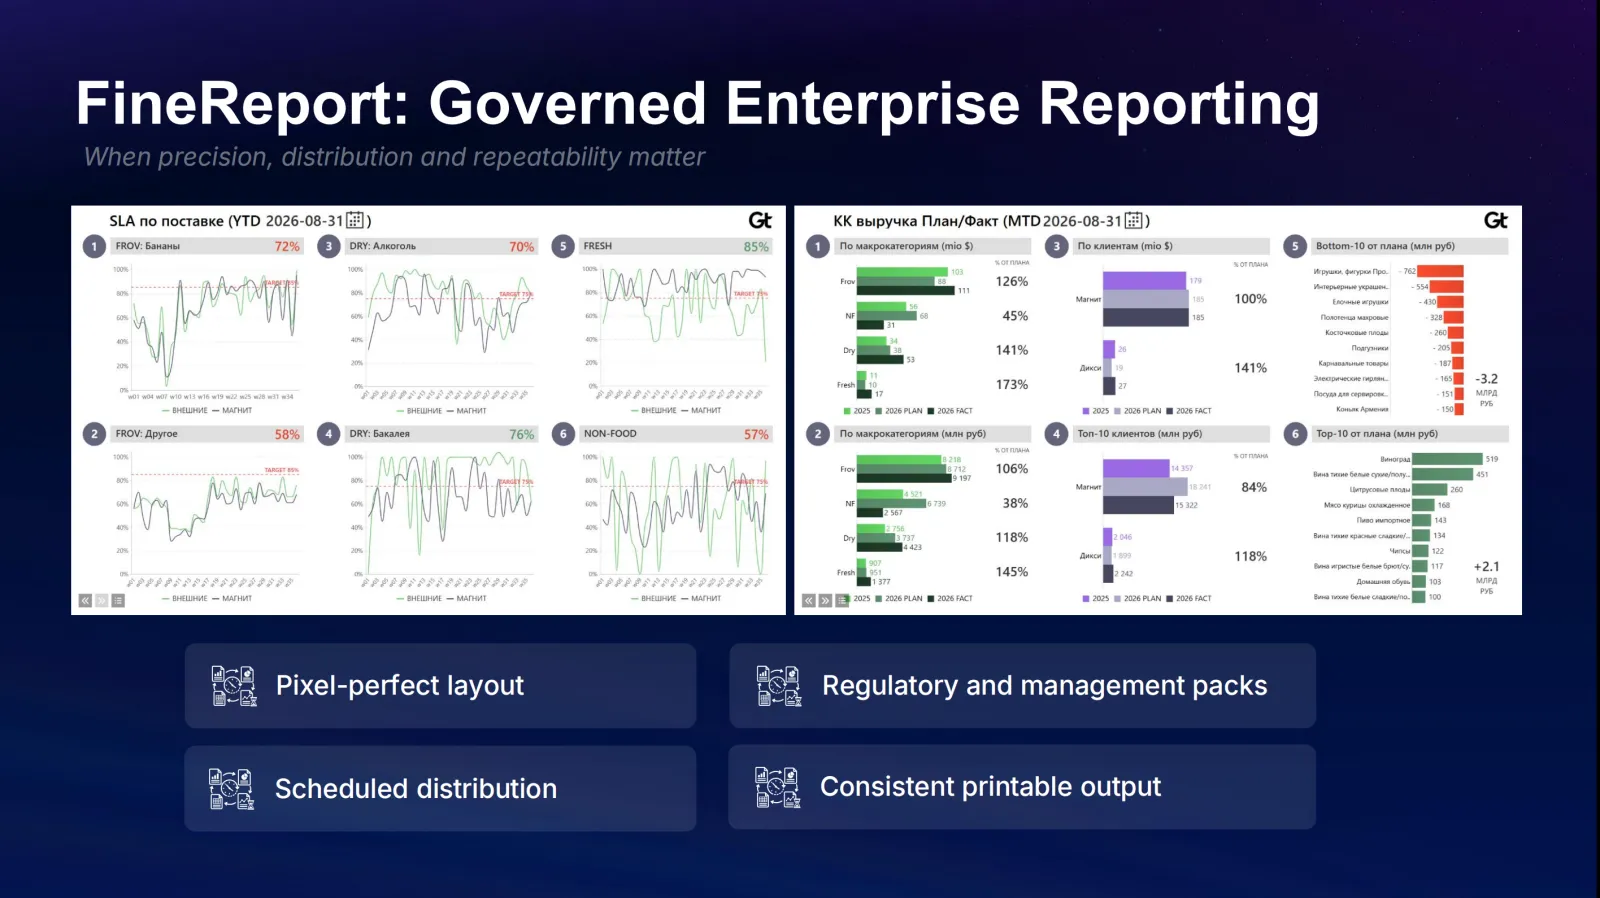
Within a framework of certified datasets and shared KPI definitions, users can freely filter data, drill down into details, compare results, and share insights.When accuracy, distribution, and repeatability are critical, FineReport is used for scenarios such as SLA attainment analysis by product category and planned versus actual revenue comparisons, delivering highly consistent report formatting and precise, controlled distribution.
Driving Business Value: Transforming Manual Data Extraction into an Engine for Business Enablement
With FineBI and FineReport, Grand Trade’s data team successfully freed up analytical capacity previously consumed by repetitive data extraction, redirecting its efforts toward high-value business enablement. This transformation delivered two key benefits:
• Self-Service Analytics: Reducing Costs and Improving Efficiency:
A single governed data foundation supports multiple business scenarios, including sales performance (revenue, gross margin, targets, and channel dynamics), inventory analysis (stock levels, availability, aging, and turnover), financial control (plan vs. actual performance, profitability, and cost visibility), supplier analytics and SLA tracking, trade marketing, and executive dashboards.
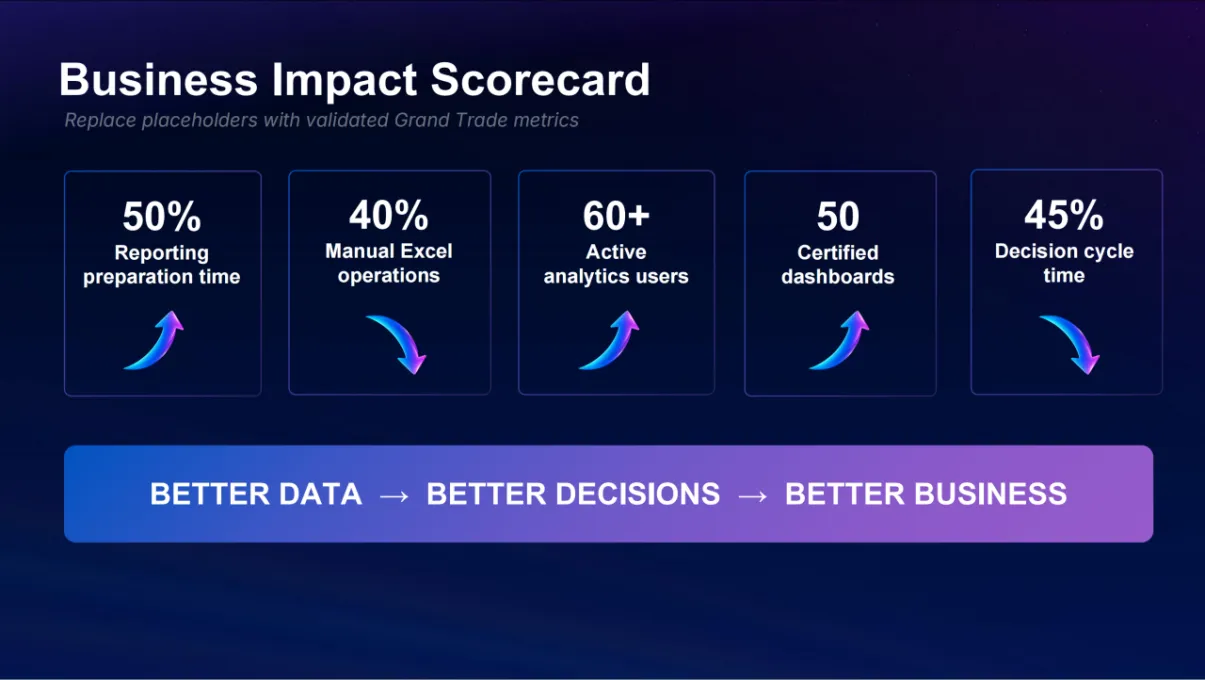
The transformation delivered significant results: reporting preparation time was reduced by 50%, manual excel operations decreased by 40%, the number of active analytics users grew to over 60, 50 certified dashboards were established, and decision cycle time were shortened by 45%.
• Data Democratization: Improving Decision Quality and Speed:
The platform supports more than 376 active analytics users, a 3.1-fold increase from 120 in the previous year. Monthly visits exceed 900, and the dashboard library contains over 70 dashboards, including 50 certified dashboards.
Kirill Zelvyansky explains: “For me, the most important result is not the number of dashboards, but that the platform is becoming part of everyday business operations. People come back to it and rely on it.”
By establishing a unified data hub, Grand Trade has not only optimized existing processes but also gained greater control over its future data innovation, no longer constrained by data silos and inconsistent definitions.
Looking ahead to 2026–2027, Grand Trade plans to move from trusted reporting toward decision intelligence by progressively introducing a Lakehouse architecture, AI-driven analytics, predictive forecasting, and natural language analytics, while continuing to evolve its semantic layer.As Kirill Zelvyansky puts it: “Data doesn’t create value. Better decisions do.”