
What is Ad Hoc Reporting?
Ad Hoc Reporting vs. Standard Reporting
Ad hoc reporting is often confused with standard reports, dashboards, and BI reporting. They can use the same data, but they serve different moments.
Standard Report
Main purpose
Repeat a known reporting structure
Typical question
What happened this period?
Best use
Monthly reviews, compliance packs, and executive updates
Ad Hoc Reporting
Main purpose
Answer a new or urgent question
Typical question
Why did this happen, and what should we check next?
Best use
Exceptions, investigations, one-time decisions, and follow-up analysis
A standard financial report may show revenue, cost, profit, cash flow, and budget variance every month. An ad hoc report might investigate why one region's gross margin fell even though revenue increased.
A sales report may summarize pipeline, quota attainment, win rate, and forecast accuracy. An ad hoc sales report might compare stalled enterprise deals by stage, owner, industry, and competitor mention.
A dashboard may show the signal. Ad hoc reporting explains the question behind the signal. The two work best together: use dashboards to notice change, and use ad hoc reports to investigate meaning.
Benefits of Ad Hoc Reporting
Businesses do not wait for the end of the month to create new questions. A campaign underperforms today. A supplier delay appears this morning. A sales region misses target before the forecast meeting. A customer segment behaves differently after a policy change.
Ad hoc reporting helps teams respond without rebuilding the whole reporting system.
- Faster investigation: Teams can answer unexpected questions without waiting for IT or the next scheduled report.
- Better decision context: A short ad hoc report can connect a metric change to segment, time, product, region, owner, or source-system detail.
- Less spreadsheet chaos: When ad hoc reporting happens inside a governed BI environment, users can explore data without exporting every question to separate files.
- More useful meetings: Instead of debating a fixed report that does not answer the current question, teams can bring targeted evidence into the discussion.
- Reusable learning: A one-time report can become a recurring view if the question repeats.
- Stronger reporting culture: Users learn how metrics behave, where data comes from, and which questions require deeper validation.
The real value is not producing more reports. It is reducing the gap between a business question and a trusted answer.
Don’t just collect data. Visualize what matters.
Download the KPI Dashboard Guide to strengthen your ad hoc reporting foundation:
- 10 essential steps to turn business questions into focused KPI views
- How to choose charts that make ad hoc answers easier to read
- 15 top-notch dashboard templates for 2026 you can study before building reusable report views

Use Cases of Ad Hoc Reporting by Team
Ad hoc reporting appears in almost every department because every team faces questions that recurring reports cannot predict.
Finance ad hoc reporting
Finance teams use ad hoc reporting to investigate budget variance, cash movement, cost spikes, margin changes, revenue recognition questions, and forecast risk.
Examples:
- Compare actual spending vs. budget by department, vendor, and cost category.
- Find which product mix changes affected gross margin.
- Investigate why accounts receivable aging increased in one region.
- Build a one-time view for leadership before a board meeting.
This complements recurring financial reporting, not replaces it. The monthly finance pack remains stable. The ad hoc report answers the unexpected question inside the month.
Sales ad hoc reporting
Sales teams use ad hoc reporting to diagnose pipeline risk, forecast gaps, win-rate changes, territory performance, rep activity, and deal quality.
Examples:
- Break down stalled opportunities by stage, deal size, industry, and owner.
- Compare win rate before and after a pricing change.
- Identify which territories need pipeline generation before quarter-end.
- Study whether discounting improved close rate or reduced margin.
This connects naturally to sales reporting and scheduled sales reviews.
Marketing ad hoc reporting
Marketing teams use ad hoc reporting to explain campaign changes, channel mix, conversion problems, lead quality, attribution gaps, and landing page performance.
Examples:
- Compare campaign ROI by channel, audience, offer, and region.
- Investigate why traffic increased but qualified leads declined.
- Study conversion changes after a landing page update.
- Check whether a webinar created pipeline or only registrations.
This supports a recurring marketing report by adding flexible follow-up analysis.
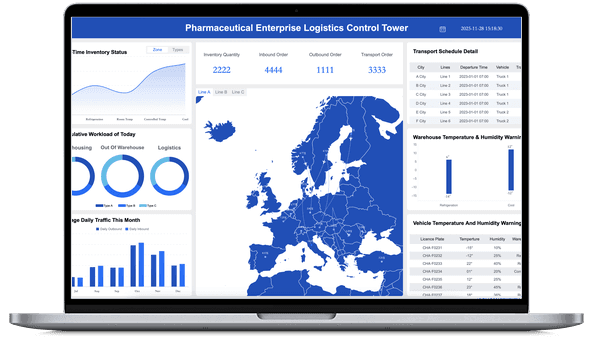
Operations and supply chain ad hoc reporting
Operations teams use ad hoc reporting to investigate bottlenecks, inventory movement, supplier performance, SLA misses, production delays, and quality exceptions.
Examples:
- Find which supplier, plant, or material caused delivery risk.
- Compare defect rates by line, shift, batch, and product.
- Investigate why fulfillment time increased in one warehouse.
- Create a temporary exception report during a shortage or disruption.
For recurring process reviews, these questions may later become enterprise reporting assets.
HR and management ad hoc reporting
HR and management teams use ad hoc reporting to study headcount, turnover, hiring progress, workforce cost, training completion, and employee distribution.
Examples:
- Compare turnover by department, tenure, manager, and location.
- Investigate hiring cycle time by role type.
- Check workforce capacity before approving a new project.
- Build a one-time report for leadership planning.
The common pattern across teams is simple: a stable report tells people what usually matters. An ad hoc report helps them understand what matters now.
Ad Hoc Reporting Demo Examples and Templates
Ad hoc reporting is easier to understand when you study examples. The demo cards below are not meant to be copied exactly. Use them as learning material for question design, metric grouping, drill-down paths, and visual hierarchy.
Operation and Management
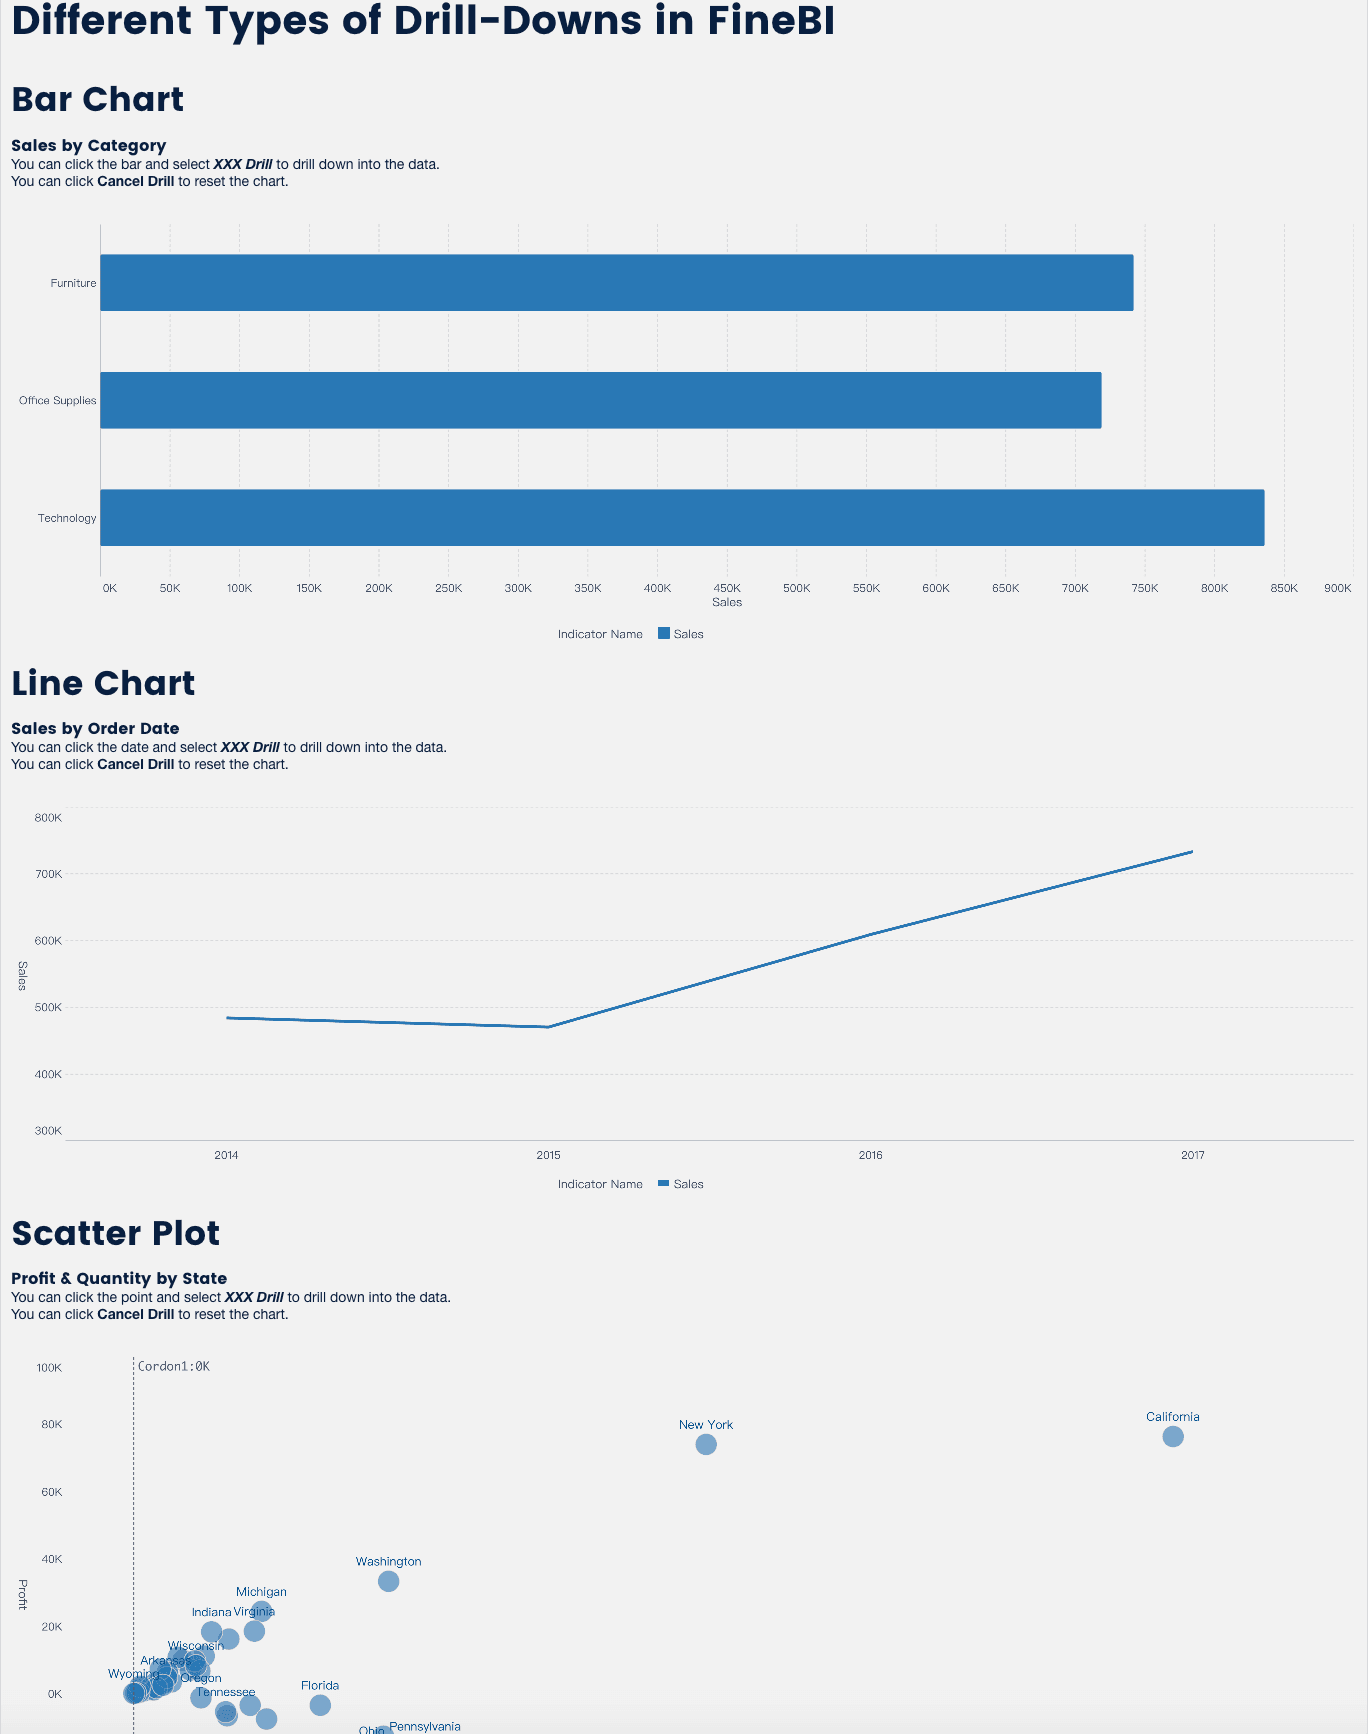
Drill-down Analysis
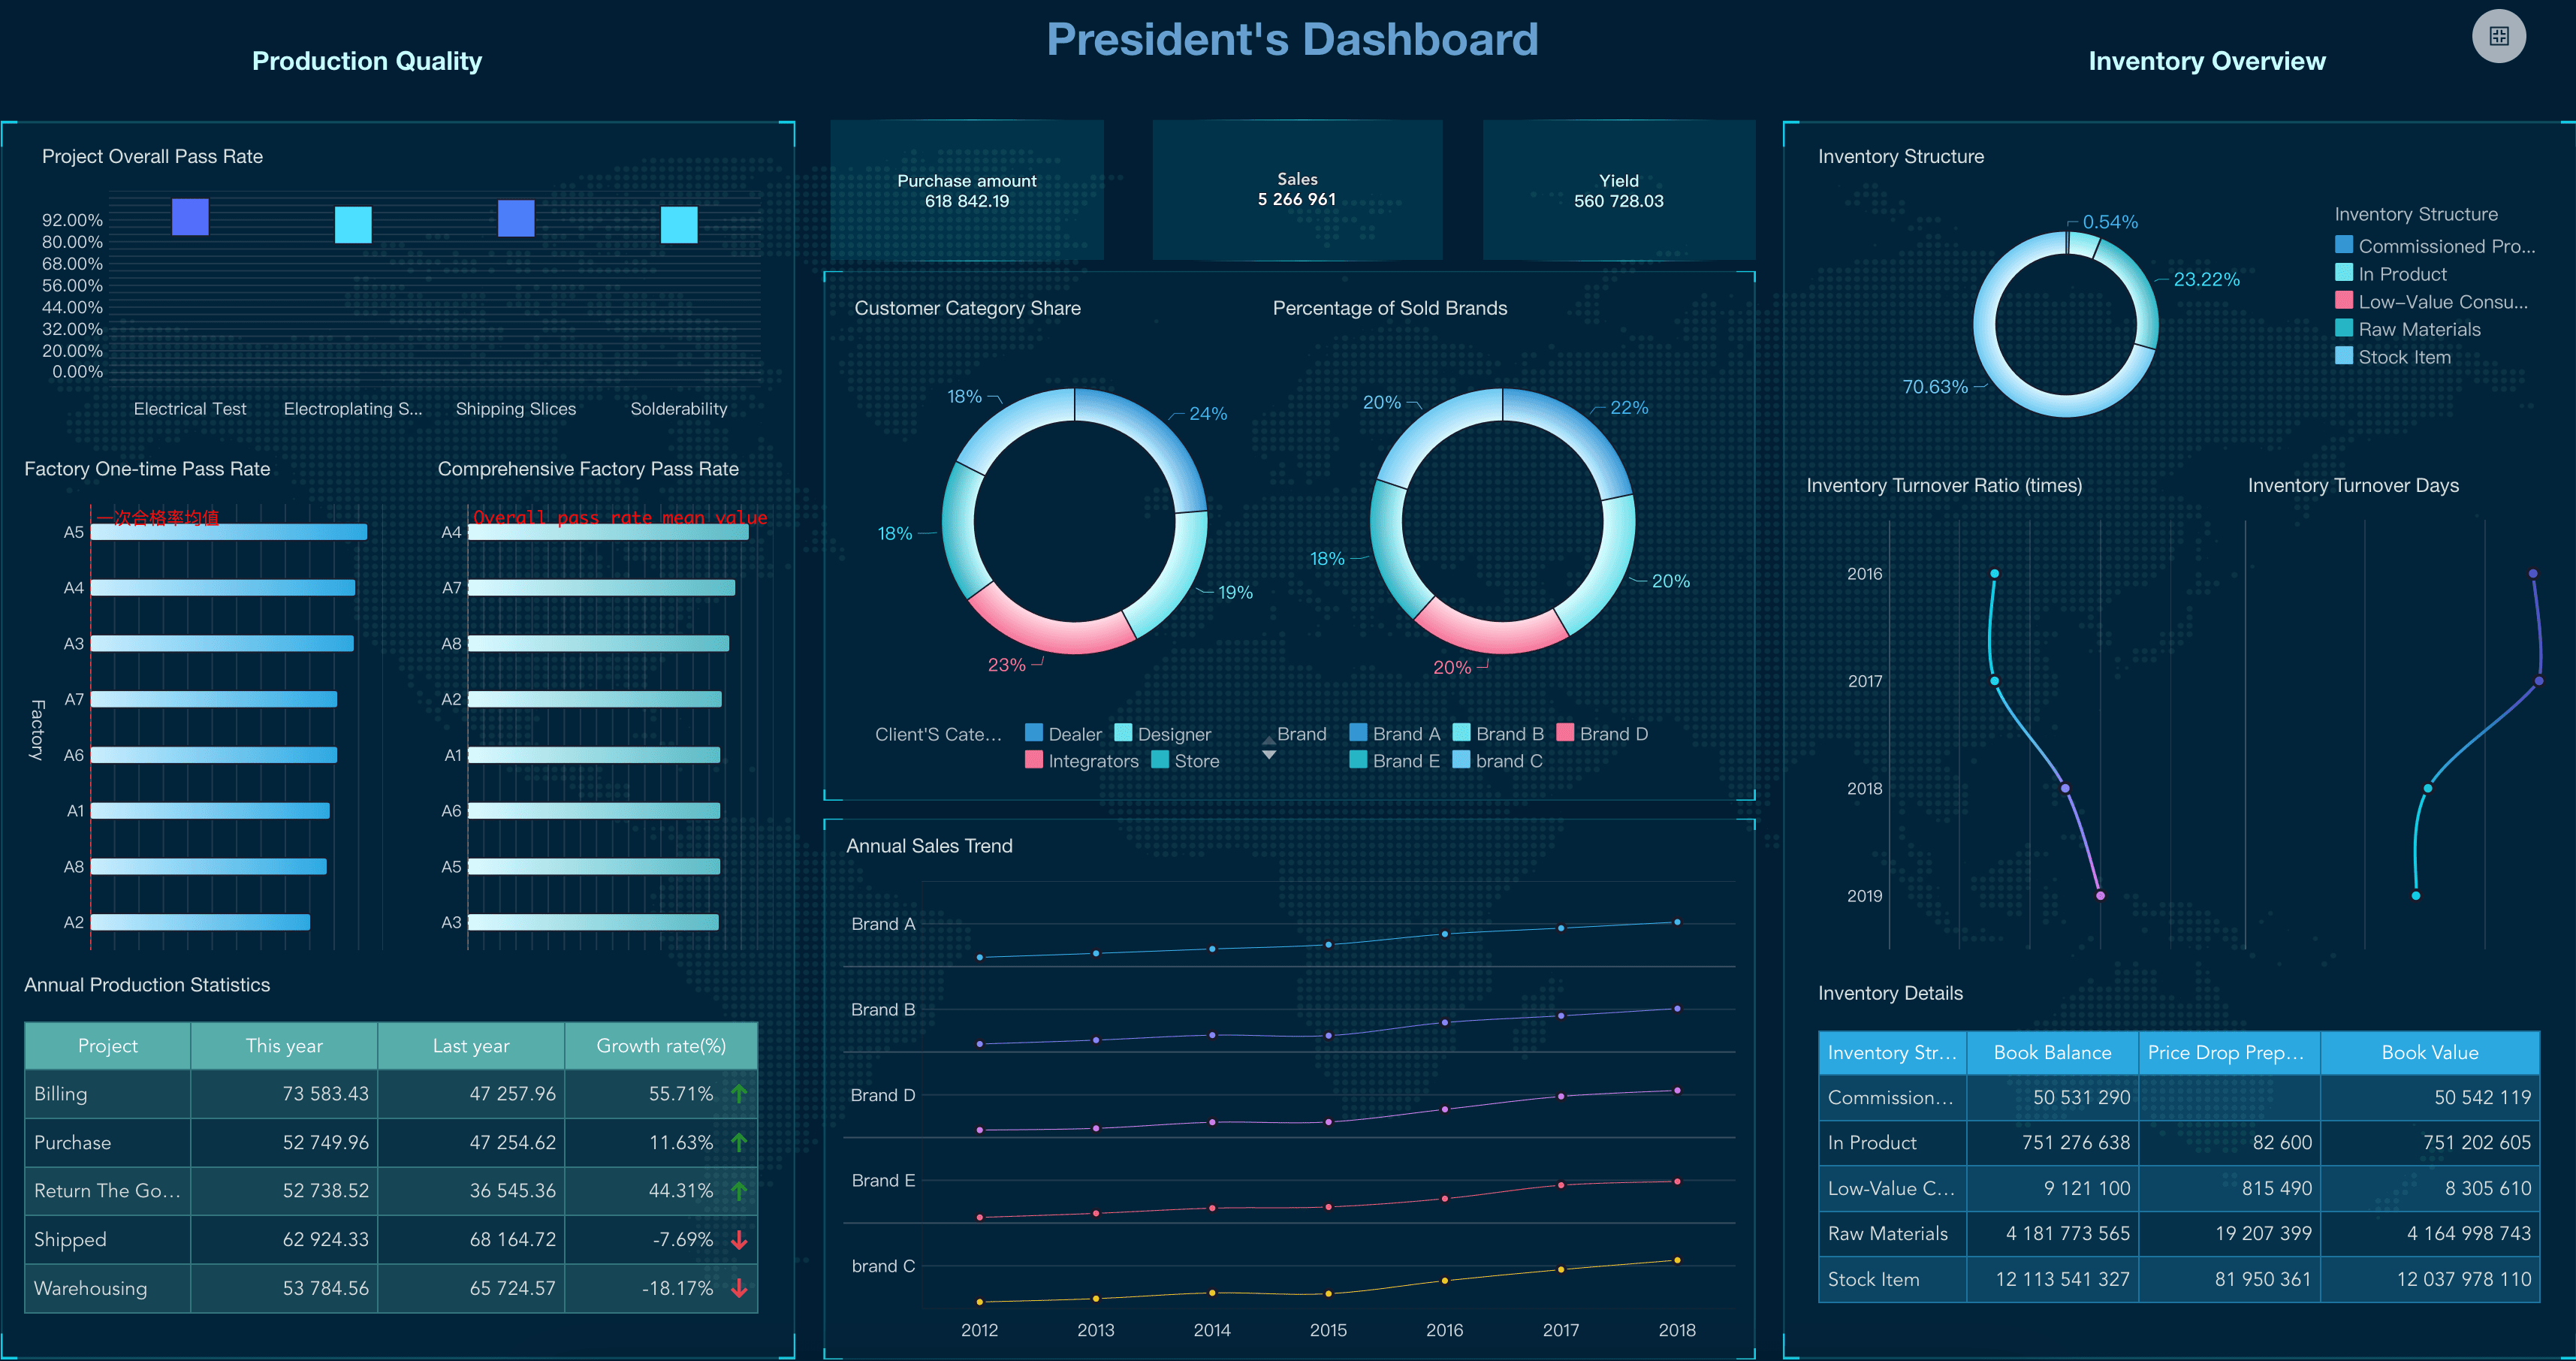
Executive Dashboard
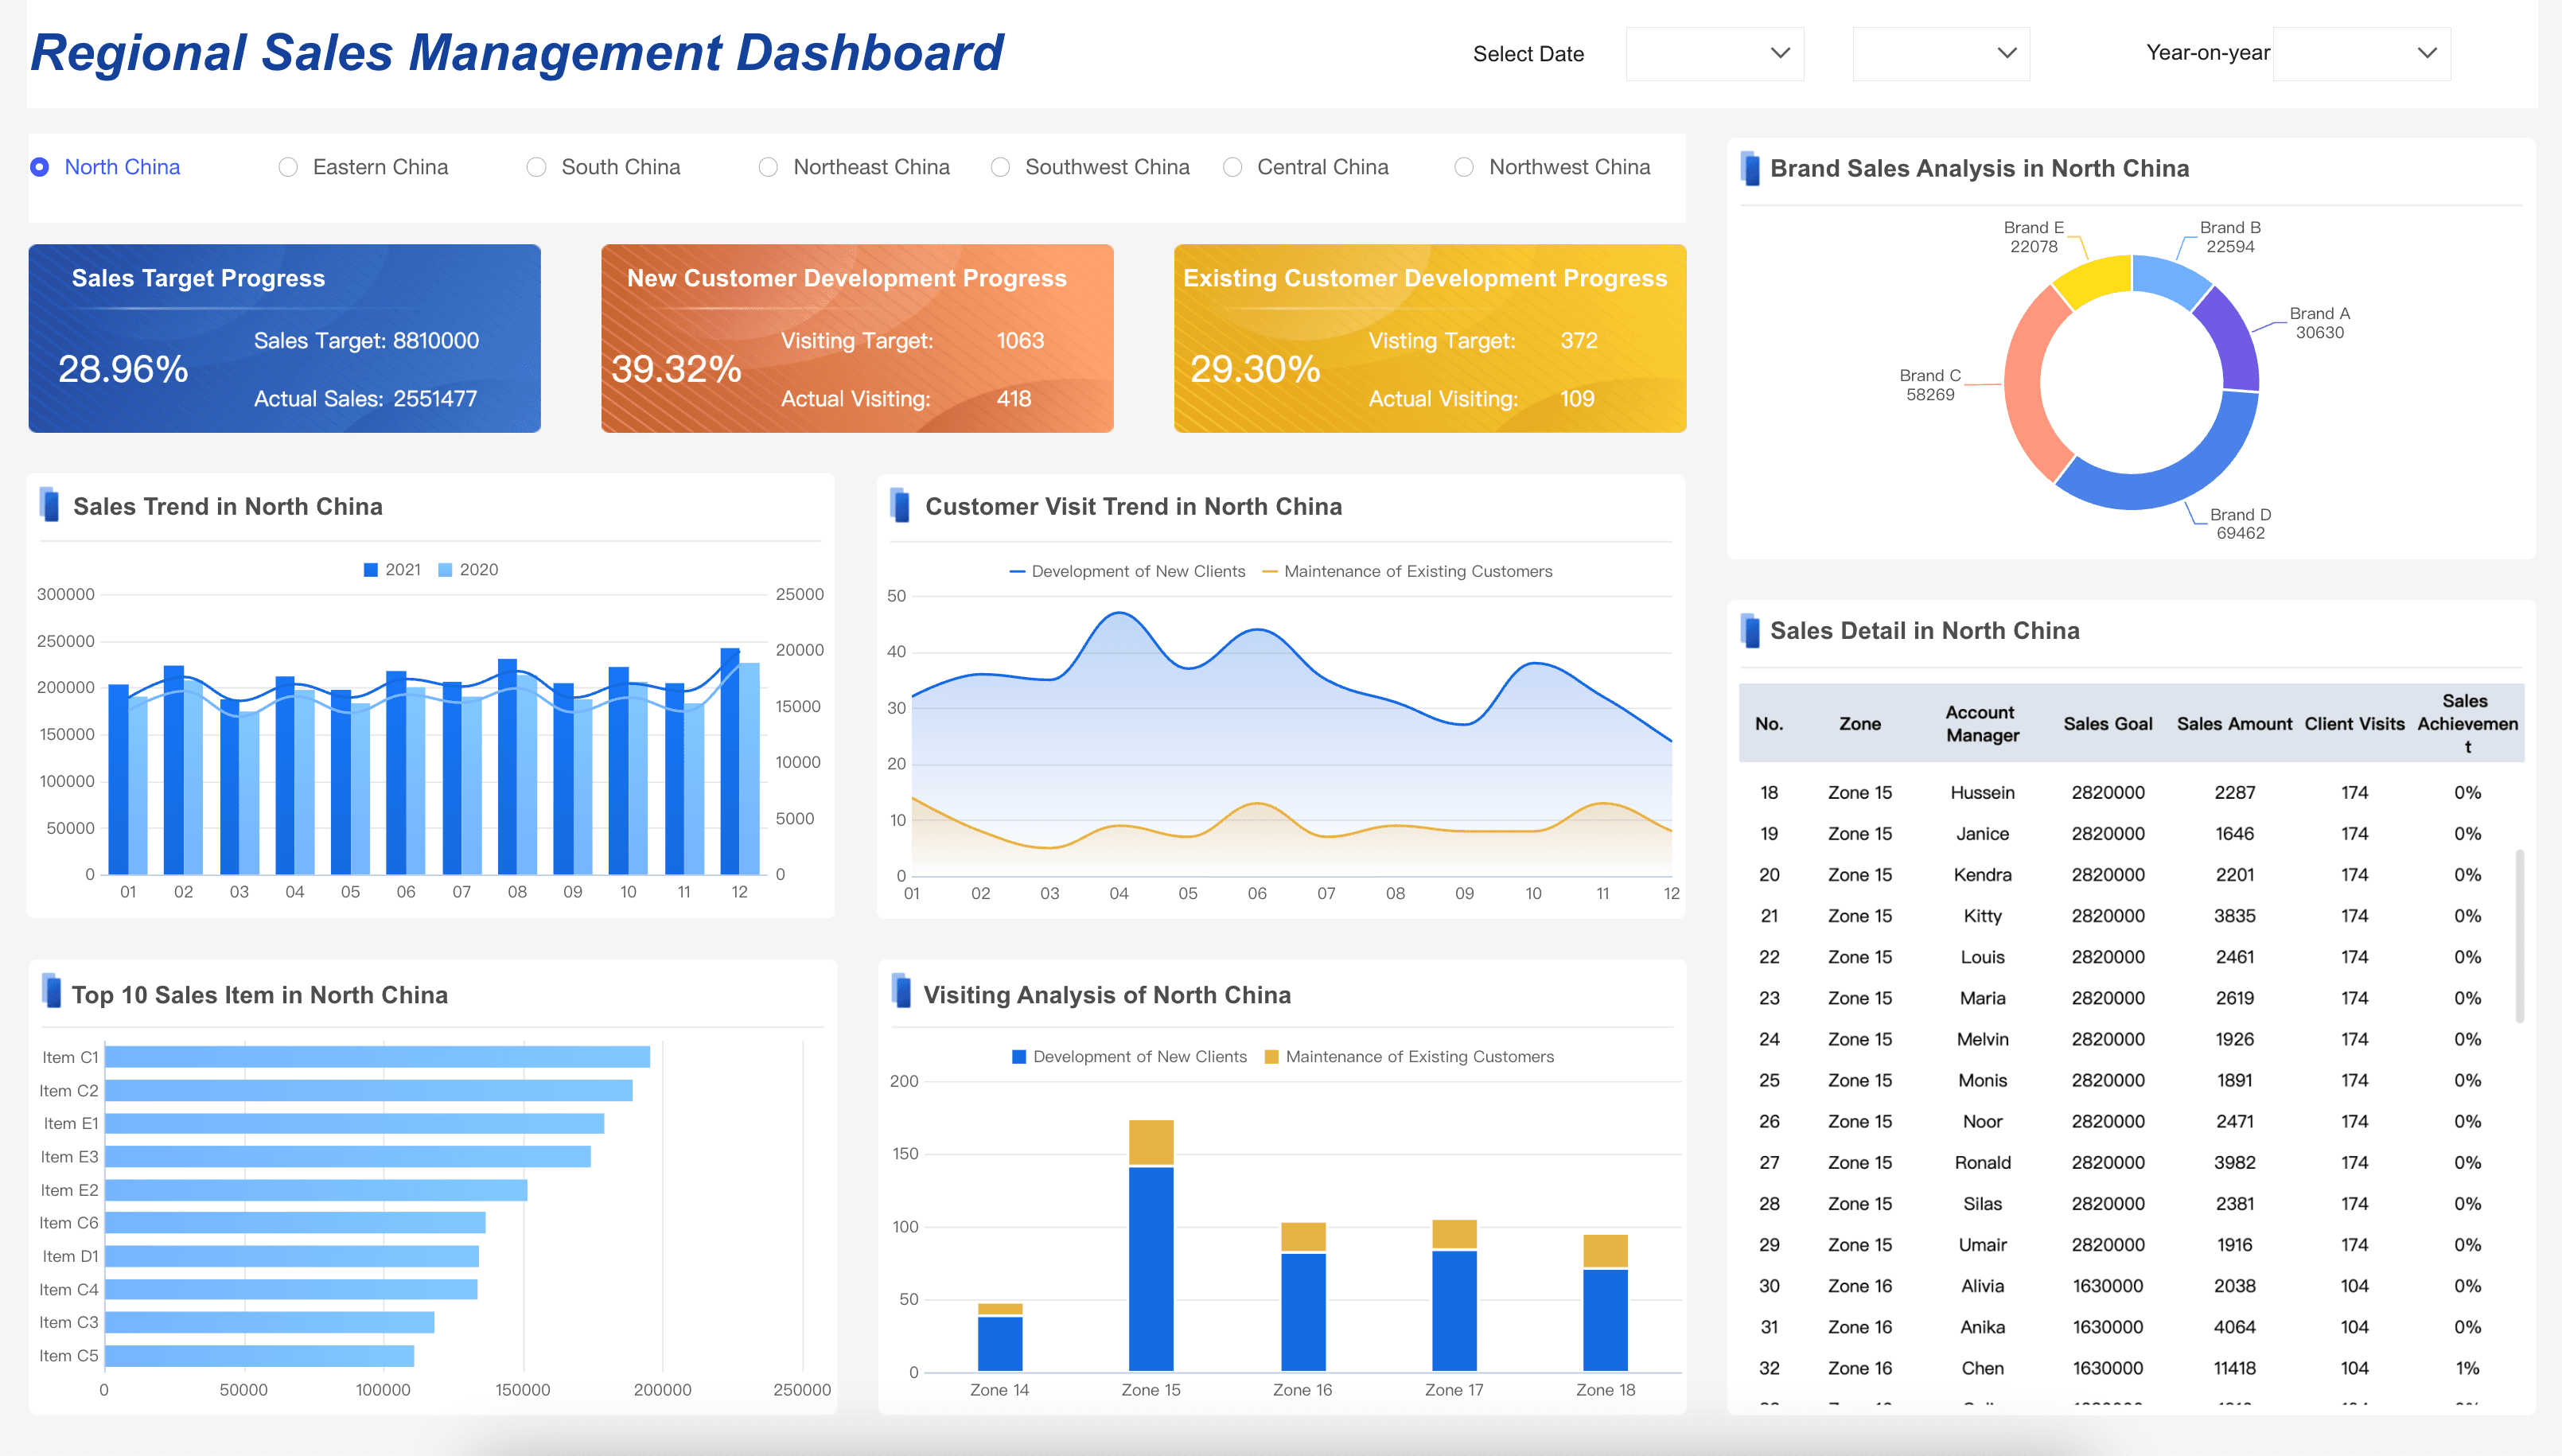
Sales Management Dashboard
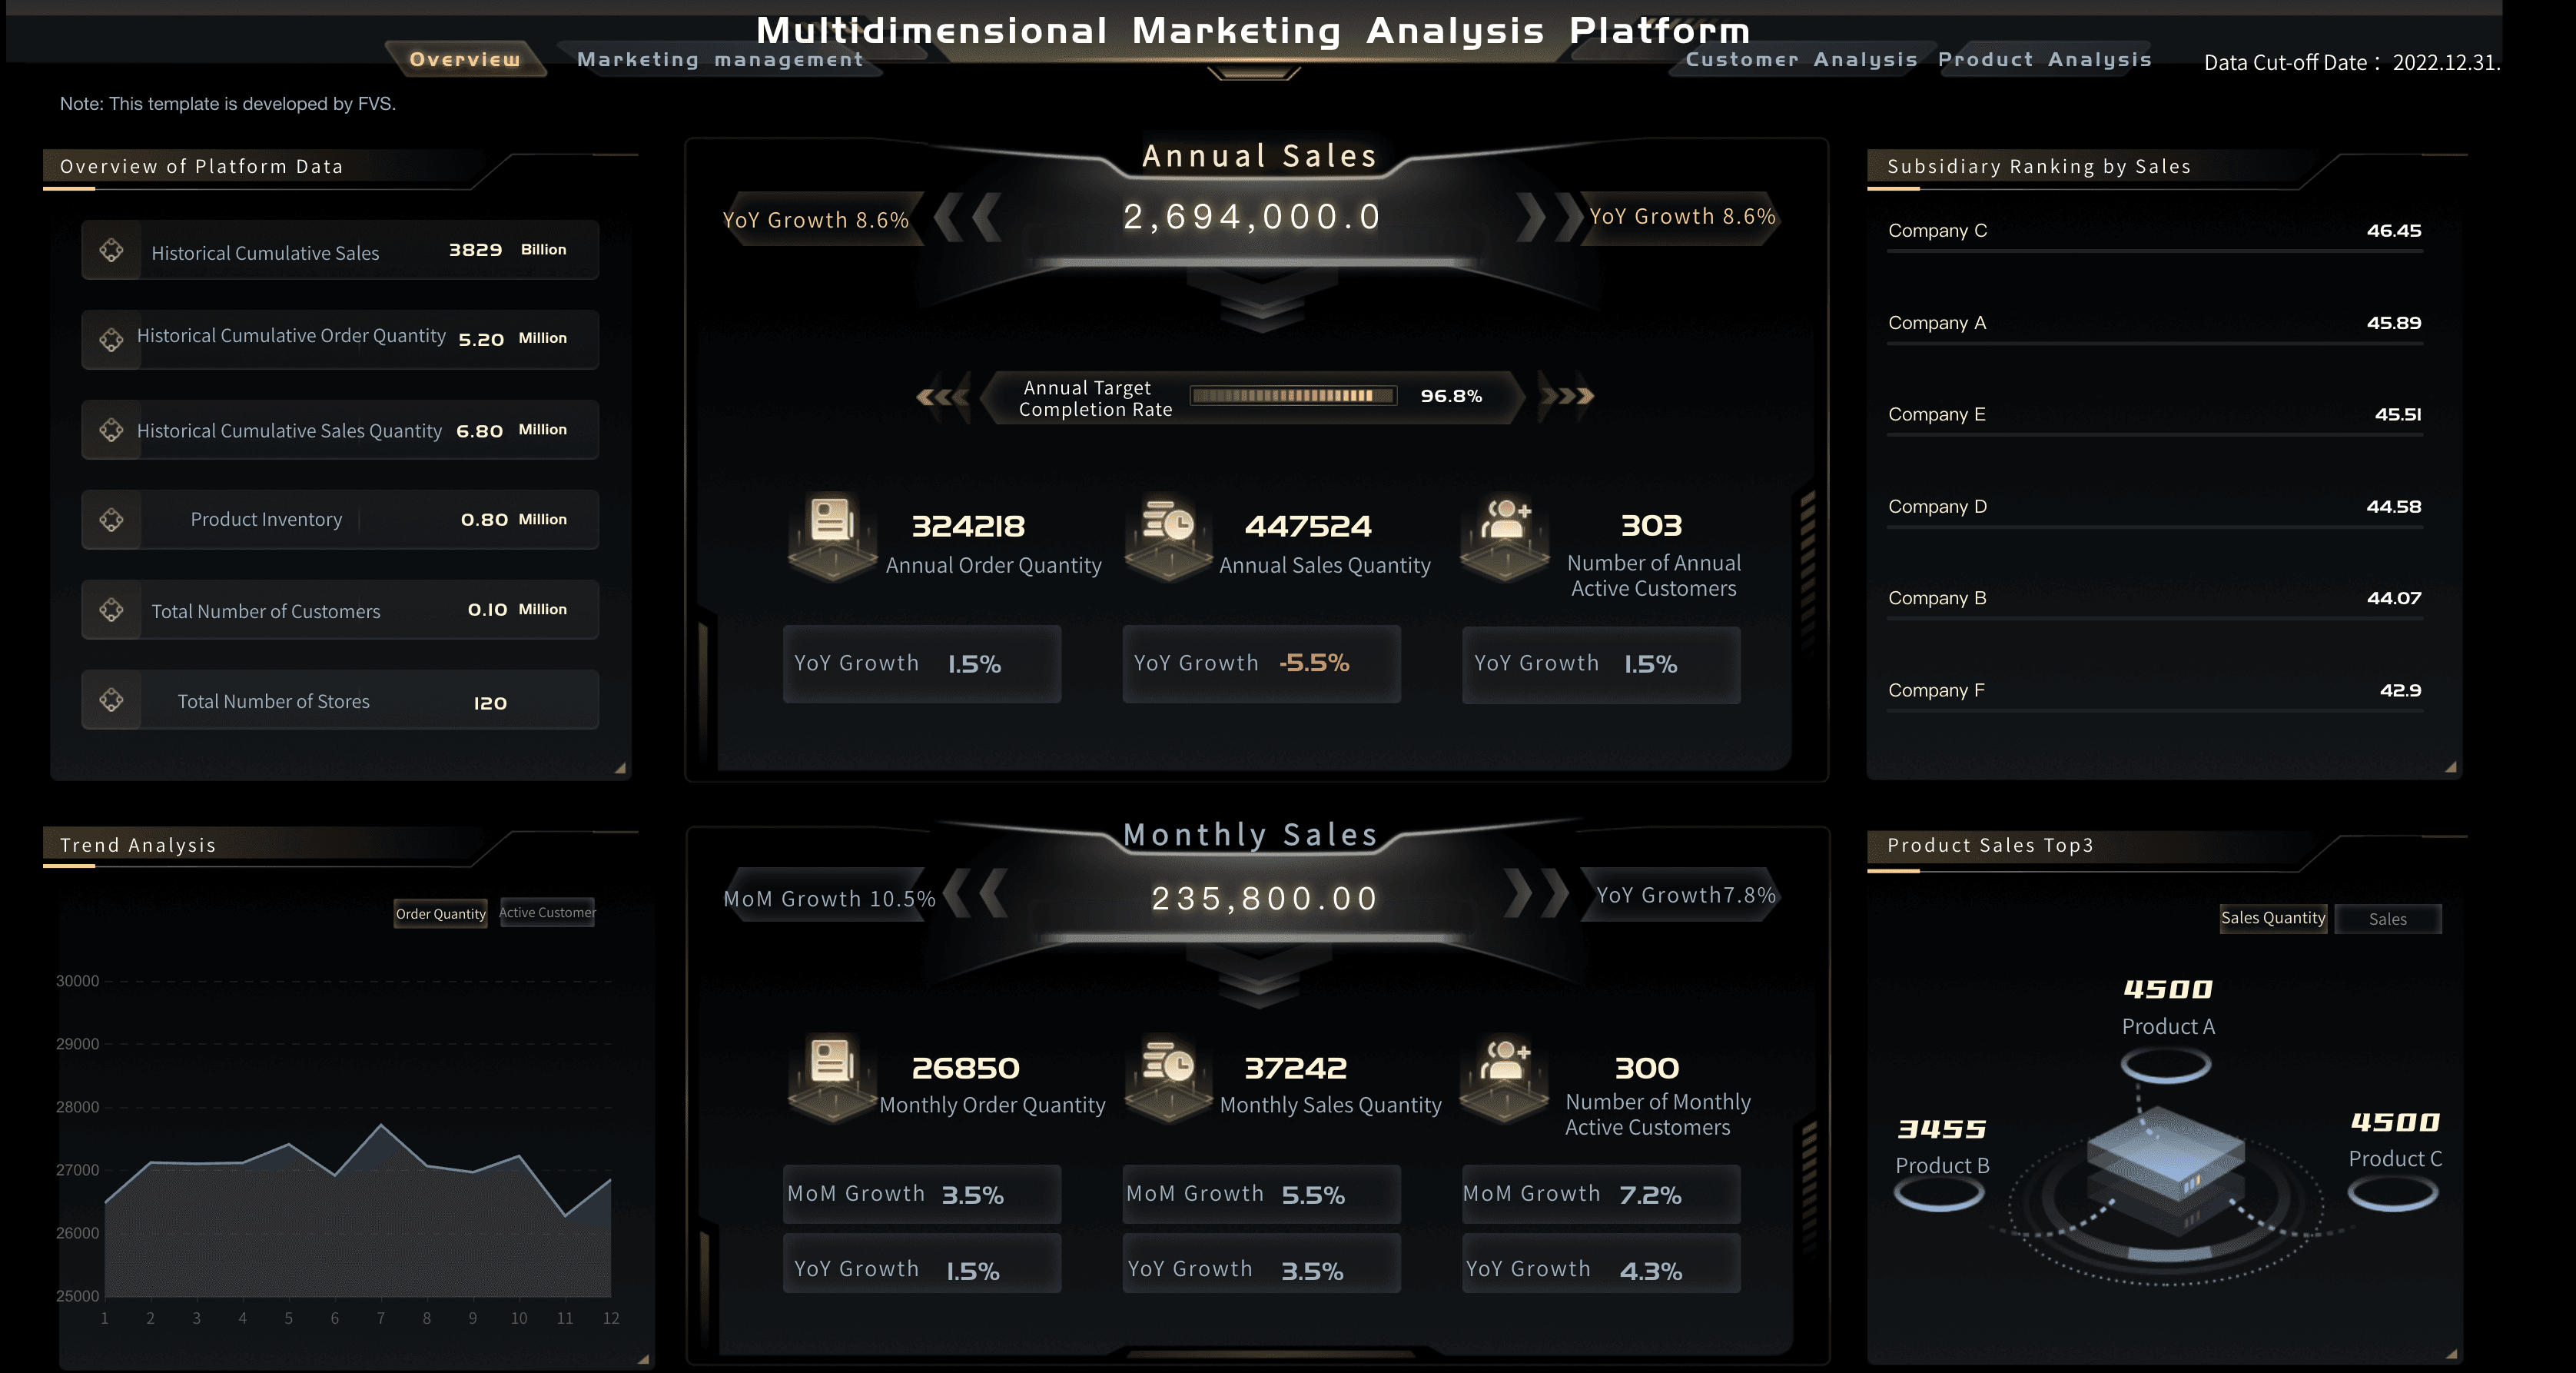
Marketing Analytics Platform
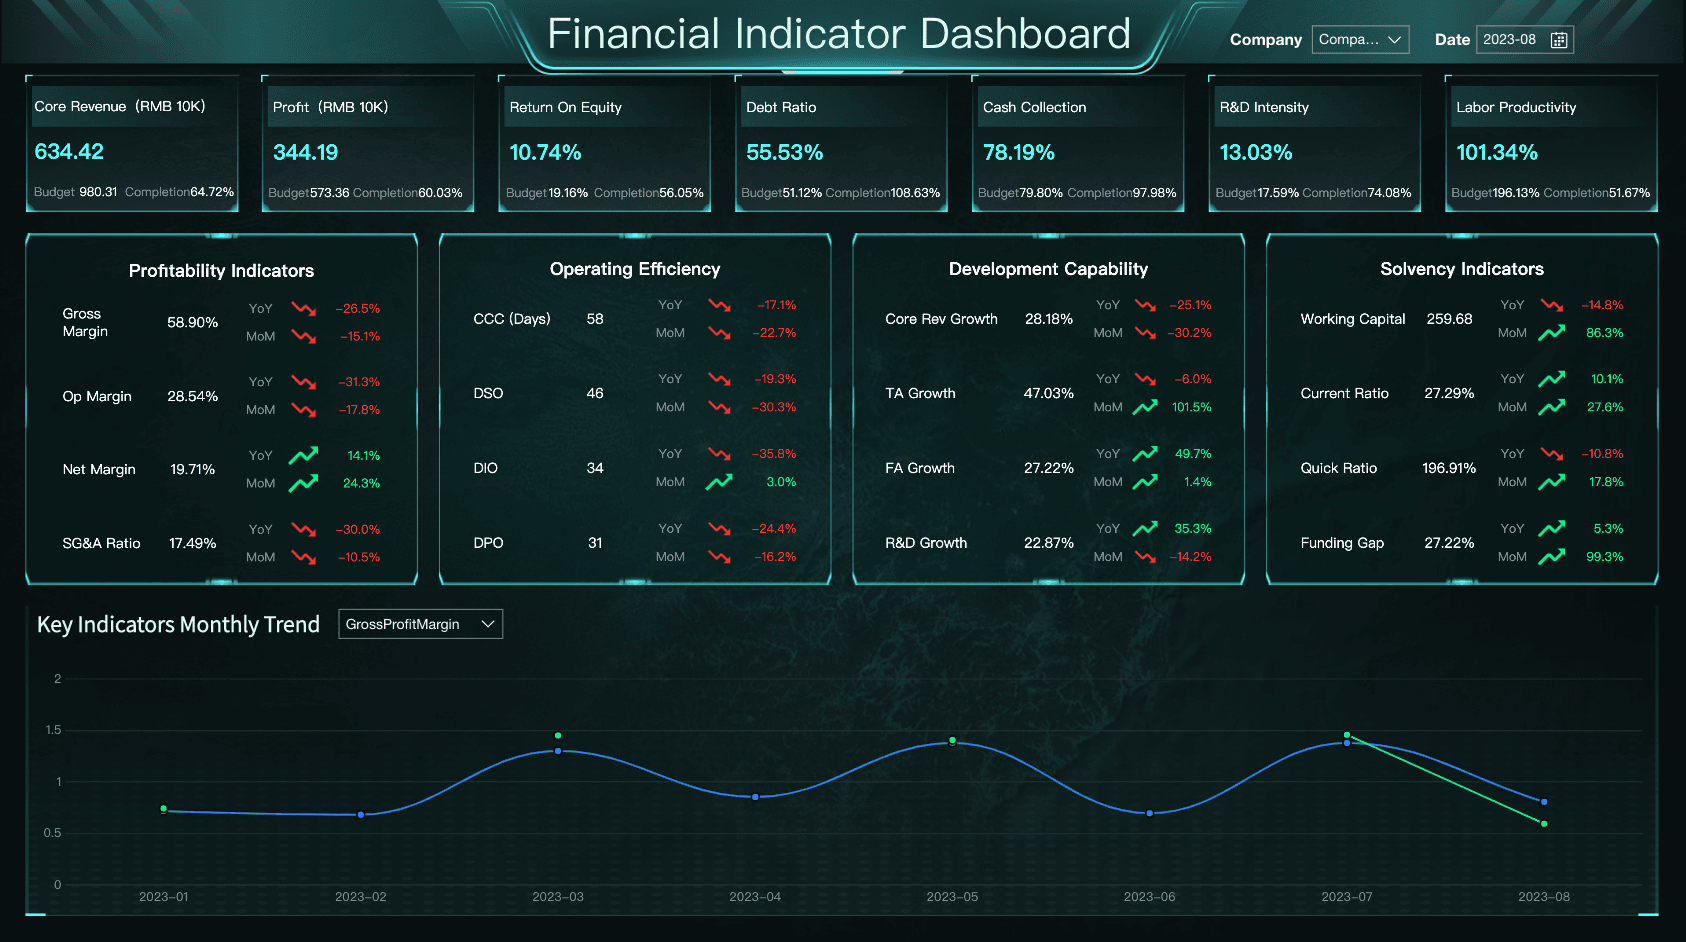
Financial Metrics Dashboard

Budget Control Dashboard
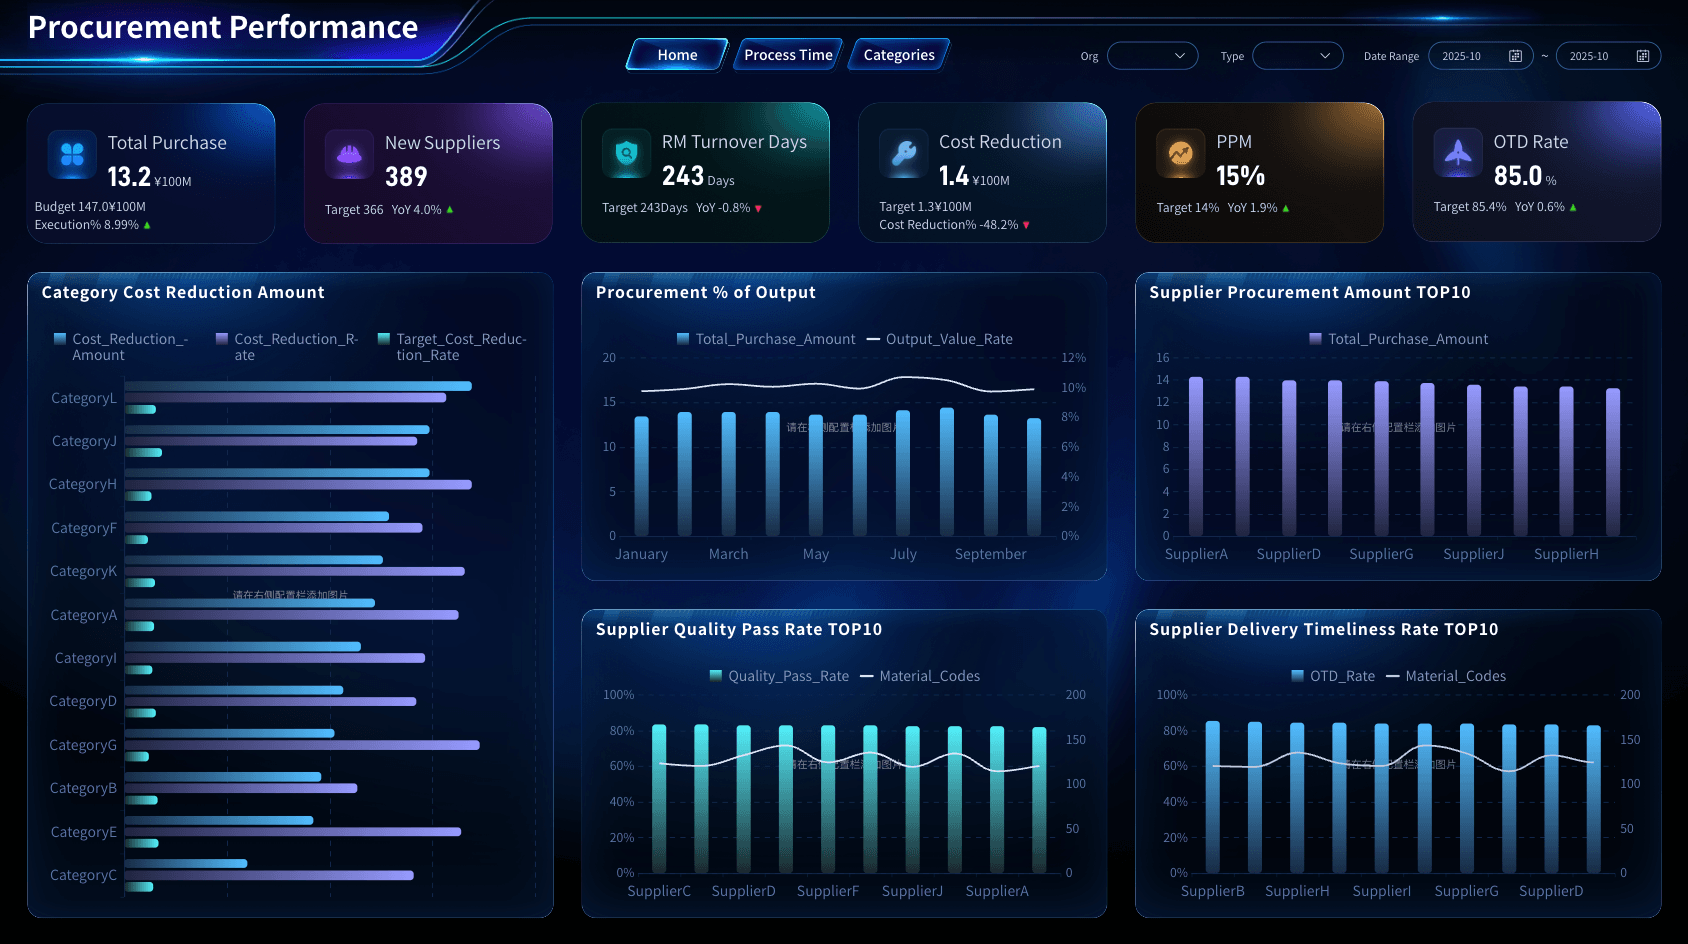
Procurement Category Management
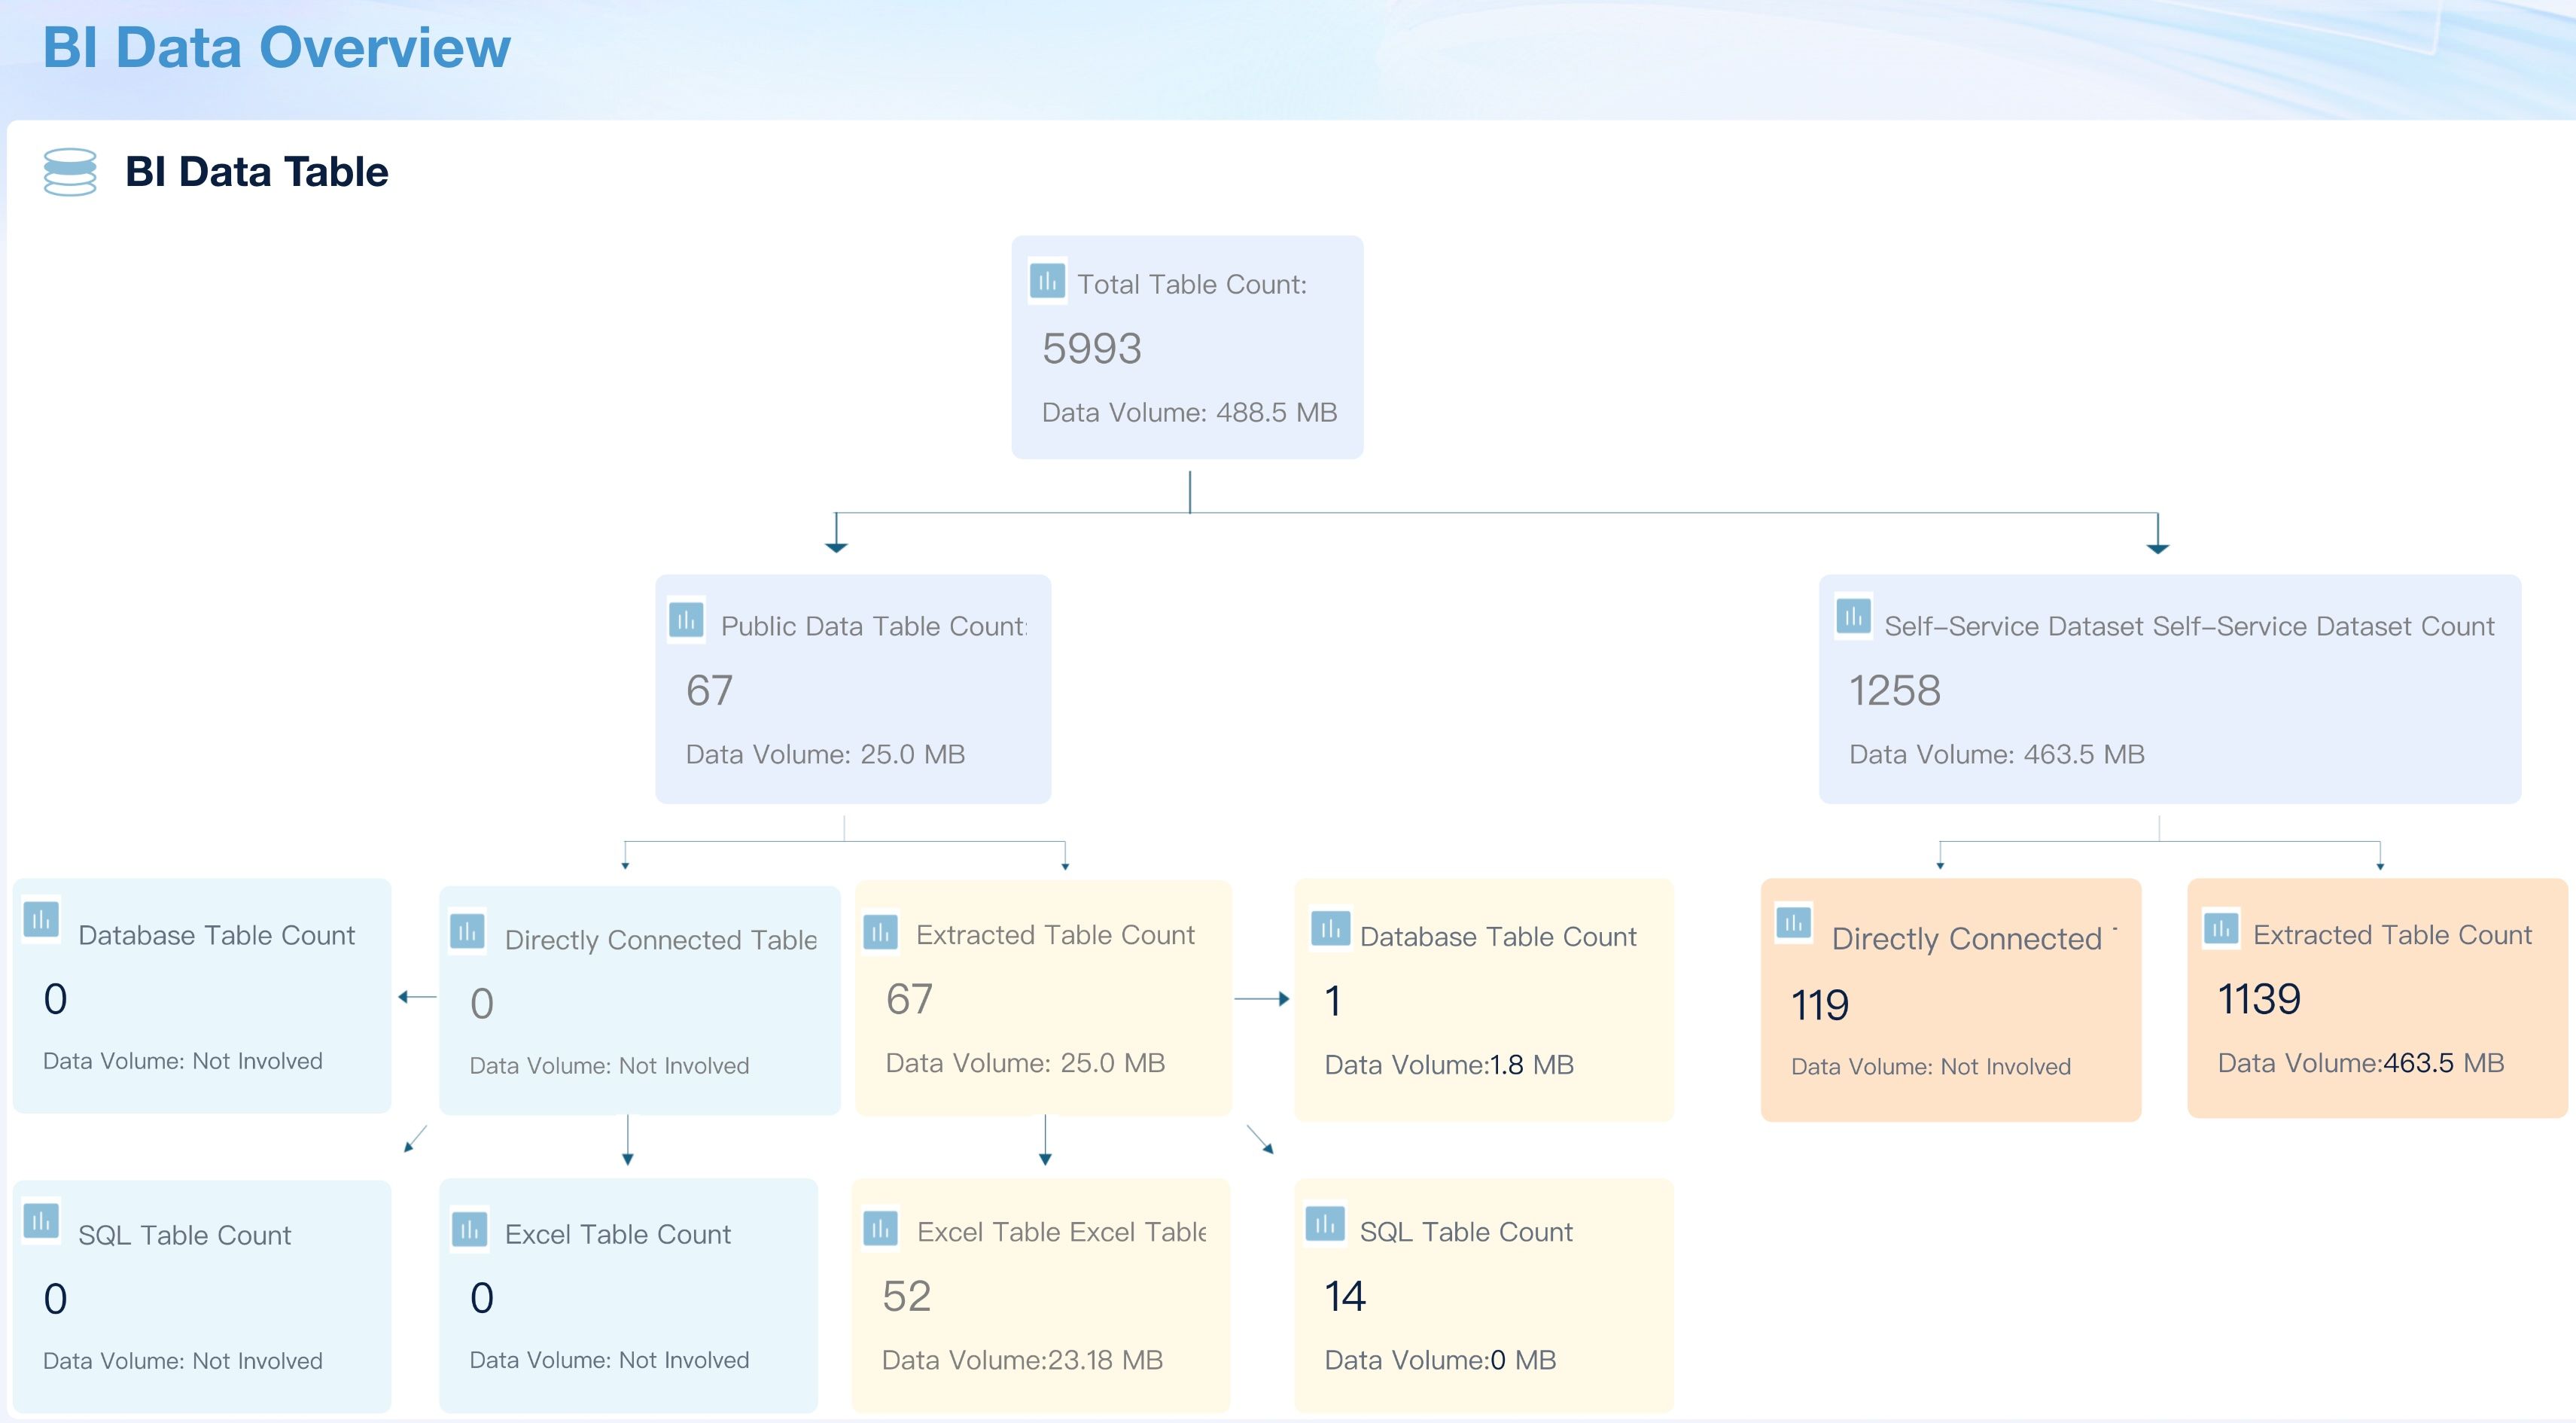
Inventory Movement Analysis Dashboard
Here is how to read these examples through an ad hoc reporting lens:
- Use the FineBI Operation and Management demo to study data governance, system usage, and platform monitoring questions.
- Use Drill-down Analysis to understand how users move from summary to detail without losing context.
- Use Executive Dashboard patterns when the ad hoc question needs a leadership-ready summary.
- Use Sales Management Dashboard when the question involves pipeline, region, owner, or revenue movement.
- Use Marketing Analytics Platform when the question involves campaign attribution, conversion, and channel performance.
- Use Financial Metrics Dashboard and Budget Control Dashboard when the question involves cost, margin, cash, or variance.
- Use Procurement Category Management and Inventory Movement Analysis Dashboard when the question involves supplier, inventory, or supply chain exceptions.
Ad Hoc Reporting Workflow
A useful ad hoc report should move quickly, but it should still follow a disciplined workflow. The goal is to answer the question without creating a second data quality problem.
- Clarify the decision. Ask what the report will help decide. "Why did revenue drop?" is broad. "Which region and product line contributed most to this week's revenue gap?" is usable.
- Define the audience. Executives need summary and implication. Managers need drivers and owner-level detail. Analysts need source fields and assumptions.
- Choose the metric and comparison. Decide whether the report compares actual vs. target, current vs. previous period, region vs. region, product vs. product, or segment vs. segment.
- Select trusted data. Use governed datasets where possible. If a spreadsheet is required, label its owner, upload date, and known limitations.
- Filter and group carefully. Document filters such as period, region, channel, customer type, product line, currency, and business unit.
- Visualize the first answer. Use simple charts first: scorecards for headline values, line charts for trends, bars for comparisons, tables for exact detail, and funnels for conversion.
- Add interpretation. Explain what changed, where it changed, how large the change was, and what may have caused it.
- Share the result with context. Include source, refresh time, assumptions, and next recommended checks.
- Decide whether to reuse it. If the question repeats, convert the ad hoc report into a dashboard view, scheduled report, or documented analysis template.
This workflow also helps teams decide when ad hoc reporting should become a recurring business intelligence report. If the same urgent question appears every week, it is no longer ad hoc. It is a reporting requirement.
Ad Hoc Reporting With FineBI + Dora
After the reporting method is clear, FineBI + Dora can support ad hoc reporting as a learning workflow, not just a product feature.
FineBI can support the governed BI layer:
- Connect business data from systems and spreadsheets.
- Build reusable datasets, dimensions, filters, and metric definitions.
- Create dashboards, reports, and analysis views for different teams.
- Support drill-down, cross-filtering, and visual exploration.
- Manage access permissions so users explore only the data they are allowed to see.
Dora can support the AI action layer above trusted BI assets. As a data agent, Dora can help users ask natural-language questions, search existing dashboards and reports, generate chart-style answers, draft structured report summaries, push recurring briefings, and follow up on exceptions. Dora should not replace the data foundation or make business decisions alone. It works best when it operates on governed datasets, KPI definitions, business rules, permissions, Skills, and human review.
For an ad hoc reporting scenario, two useful Dora digital employees could be:
- Ad Hoc Analysis Assistant: Helps business users translate a question into filters, dimensions, comparisons, charts, and follow-up checks based on trusted FineBI assets.
- Reporting Follow-up Secretary: Turns an ad hoc finding into a short briefing, sends it to the right owner, tracks open questions, and prepares a summary for the next review.
Example chat-style prompts:
- "Show me why revenue missed target this week. Break it down by region, product line, and sales owner."
- "Create an ad hoc report for campaigns with rising spend but falling qualified leads."
- "Compare inventory risk by warehouse, supplier, and material category, then list the top exceptions."
- "Generate a dashboard-style view of budget variance and explain which departments need follow-up."
 Natural-language Query
A closed-loop AI workflow could look like this:
- Retrieve trusted assets: Dora searches FineBI dashboards, datasets, KPI definitions, field mappings, and permission rules.
- Translate the question: It maps natural language to a governed metric, dimension, time period, and comparison logic.
- Generate the first view: It creates a chart, table, or structured report draft using the configured data assets.
- Explain likely drivers: It highlights the segment, period, product, owner, or source that contributed most to the change.
- Push to the right owner: It sends the finding to a department lead, analyst, or responsible user for review.
- Follow up and summarize: It tracks unresolved questions and turns confirmed learning into a reusable report pattern.
This is the practical value of enterprise AI agents in reporting. The point is not to improvise answers from disconnected tables. The point is to make ad hoc reporting faster while keeping it tied to trusted BI assets, semantic rules, permissions, and reviewable workflows.
For IT teams, this shifts work from manually building every one-off report to maintaining the data model, semantic layer, governance rules, and reusable Skills. For business users, it reduces the wait between a question and a useful first answer. For executives, it creates a clearer path from "what changed?" to "who needs to act?"
Related learning paths include AI assistant for business, AI agent workflow, and the broader dashboard examples library for visual report design.
Ad Hoc Reporting Hub
This ad hoc reporting guide should work as one spoke in a broader reporting hub. Use the report hub to understand the category, then move into specific report types based on the job to be done.
Ad hoc reporting is the flexible layer inside this cluster. A financial report creates the official view of financial performance. A finance ad hoc report investigates a specific variance. A sales report creates the standard sales review. A sales ad hoc report investigates one pipeline risk. A marketing report creates the monthly performance story. A marketing ad hoc report investigates one campaign, channel, or conversion issue.
For dashboard-connected reporting, pair this guide with the dashboard hub, dashboard design, KPI dashboard, sales dashboard, marketing dashboard, HR dashboard, and business intelligence dashboard guides.
When the goal is tool selection, continue with business reporting tools, reporting software, reporting tools, and ad hoc reporting and analysis.
Future spokes in the same reporting cluster can cover status report, report builder, reporting, sales reporting, and department-specific ad hoc reporting examples. Keep each spoke focused on one search intent so the hub explains the category while each supporting page answers a narrower reporting problem.
FAQs
Ad hoc reporting is on-demand report creation for a specific business question. Instead of using only a fixed report or scheduled dashboard, users create a focused report to investigate a new issue, exception, segment, or decision.
An example is a sales manager asking for a one-time report that compares stalled deals by region, stage, owner, industry, and deal size after the pipeline forecast changes. If the question becomes recurring, the ad hoc report can later become a standard dashboard or scheduled report.
Standard reporting follows a known structure and cadence, such as weekly sales reports or monthly finance reports. Ad hoc reporting is created for a new or urgent question that the standard report does not answer fully.
A dashboard is usually built for ongoing monitoring and exploration. Ad hoc reporting is built for a specific question or investigation. In practice, a dashboard often reveals a change, and an ad hoc report investigates why the change happened.
Finance, sales, marketing, operations, supply chain, HR, IT, and executive teams all use ad hoc reporting. The common need is the same: a stakeholder has a question that does not fit neatly into an existing report.
Ad hoc reporting needs trusted data sources, shared metric definitions, reusable dimensions, permission control, refresh-time visibility, and enough context for interpretation. Without these foundations, flexible reporting can create inconsistent answers.
FineBI can provide the governed BI layer for data connection, metric modeling, dashboards, drill-down, and permissions. Dora can act as the AI Data Agent layer that helps users ask questions, generate first views, summarize findings, push follow-ups, and reuse confirmed analysis patterns.
