
What is a Sales Report?
Sales Report vs Sales Dashboard
-
Sales Dashboards are real-time monitoring tools designed for continuous operational awareness. They answer what is happening now through interactive visualizations, enabling sales teams to track live pipeline health, spot at-risk deals, and adjust tactics on the fly.
-
Sales Reports are periodic, structured documents built for deeper analysis and stakeholder communication. They answer why it happened and what to do next by combining historical trends, variance explanations, and narrative context into a shareable format that drives strategic reviews and forecasting.
Use dashboards to watch. Use reports to understand and decide.
More resources:
- Dive deeper on the questions, "What is a Report?" & "What is a Financial Report?"
- Download interactive sales report templates
Don't just collect data. Visualize what matters.
Get a deeper exploration to master:
- End-to-end report design from data connection to automated scheduling
- Advanced layout techniques for pixel-perfect, print-ready enterprise reports
- Built-in formulas, parameters, and drill-downs to build interactive reports without code

Why Are Sales Reports Critical?
Organizations generate massive amounts of sales data every day. Without structured reporting, valuable insights remain hidden across multiple systems.
Sales reports help businesses:
-
Improve Revenue Visibility: Monitor total revenue, recurring revenue, average deal size, and sales growth trends from a centralized platform.
-
Optimize Sales Performance: Identify top-performing sales representatives, high-converting channels, and profitable customer segments.
-
Enhance Forecast Accuracy: Analyze pipeline health, deal progression, and forecasted revenue to reduce uncertainty and improve planning.
-
Support Strategic Decision-Making: Provide executives and managers with reliable insights for budgeting, territory planning, staffing, and growth strategies.
-
Increase Operational Efficiency: Automate data collection and report generation, eliminating manual spreadsheet consolidation and reducing reporting time.
Types of Sales Reports
Different business rhythms demand different sales report formats.
- Weekly Activity Reports: Track rep-level outputs including calls, emails, meetings booked, and pipeline additions. Used by frontline managers to coach behavior and maintain momentum.
- Monthly Performance Reports: Summarize revenue attainment, win rates, deal velocity, and quota progress by team or region. The backbone of sales operations reviews.
- Quarterly Business Review (QBR) Reports: Comprehensive analyses combining financial results, market dynamics, competitive positioning, and strategic recommendations for executive audiences.
- Forecast & Pipeline Reports: Project future revenue based on stage-weighted pipeline values, historical conversion rates, and deal-level risk assessments. Critical for financial planning.
- Territory & Segment Analysis Reports: Break down performance by geography, industry vertical, product line, or customer tier to uncover growth pockets and underperforming segments.
How to Build an Effective Sales Report
- Define the Decision First. Every report should answer a specific business question: "Are we on track for Q3?" "Which territory is underperforming and why?" Start with the decision, then select only the metrics that inform it.
- Standardize Metrics & Definitions. Ensure "closed-won," "pipeline value," and "sales cycle length" are calculated identically across all data sources. Inconsistent definitions destroy trust in reports.
- Balance Data with Narrative. Numbers alone don't drive action. Pair every key metric with contextual commentary explaining variances, external factors, and recommended next steps.
- Automate Distribution. Manual report generation consumes hours each cycle. Connect your reporting tool to CRM and ERP data sources for scheduled, auto-refreshed delivery to stakeholders.
- Review & Retire. Audit report usage quarterly. If a report hasn't influenced a decision in 90 days, revise or retire it. Reporting bloat is as damaging as reporting gaps.
Sales Report Examples & Templates
Different business goals require different types of sales reports. From tracking daily revenue to monitoring pipeline performance and forecasting future growth, sales report templates help organizations gain visibility into key metrics and make informed decisions.
Explore the following sales report examples to discover how businesses use reporting to analyze sales performance, identify opportunities, and drive revenue growth.
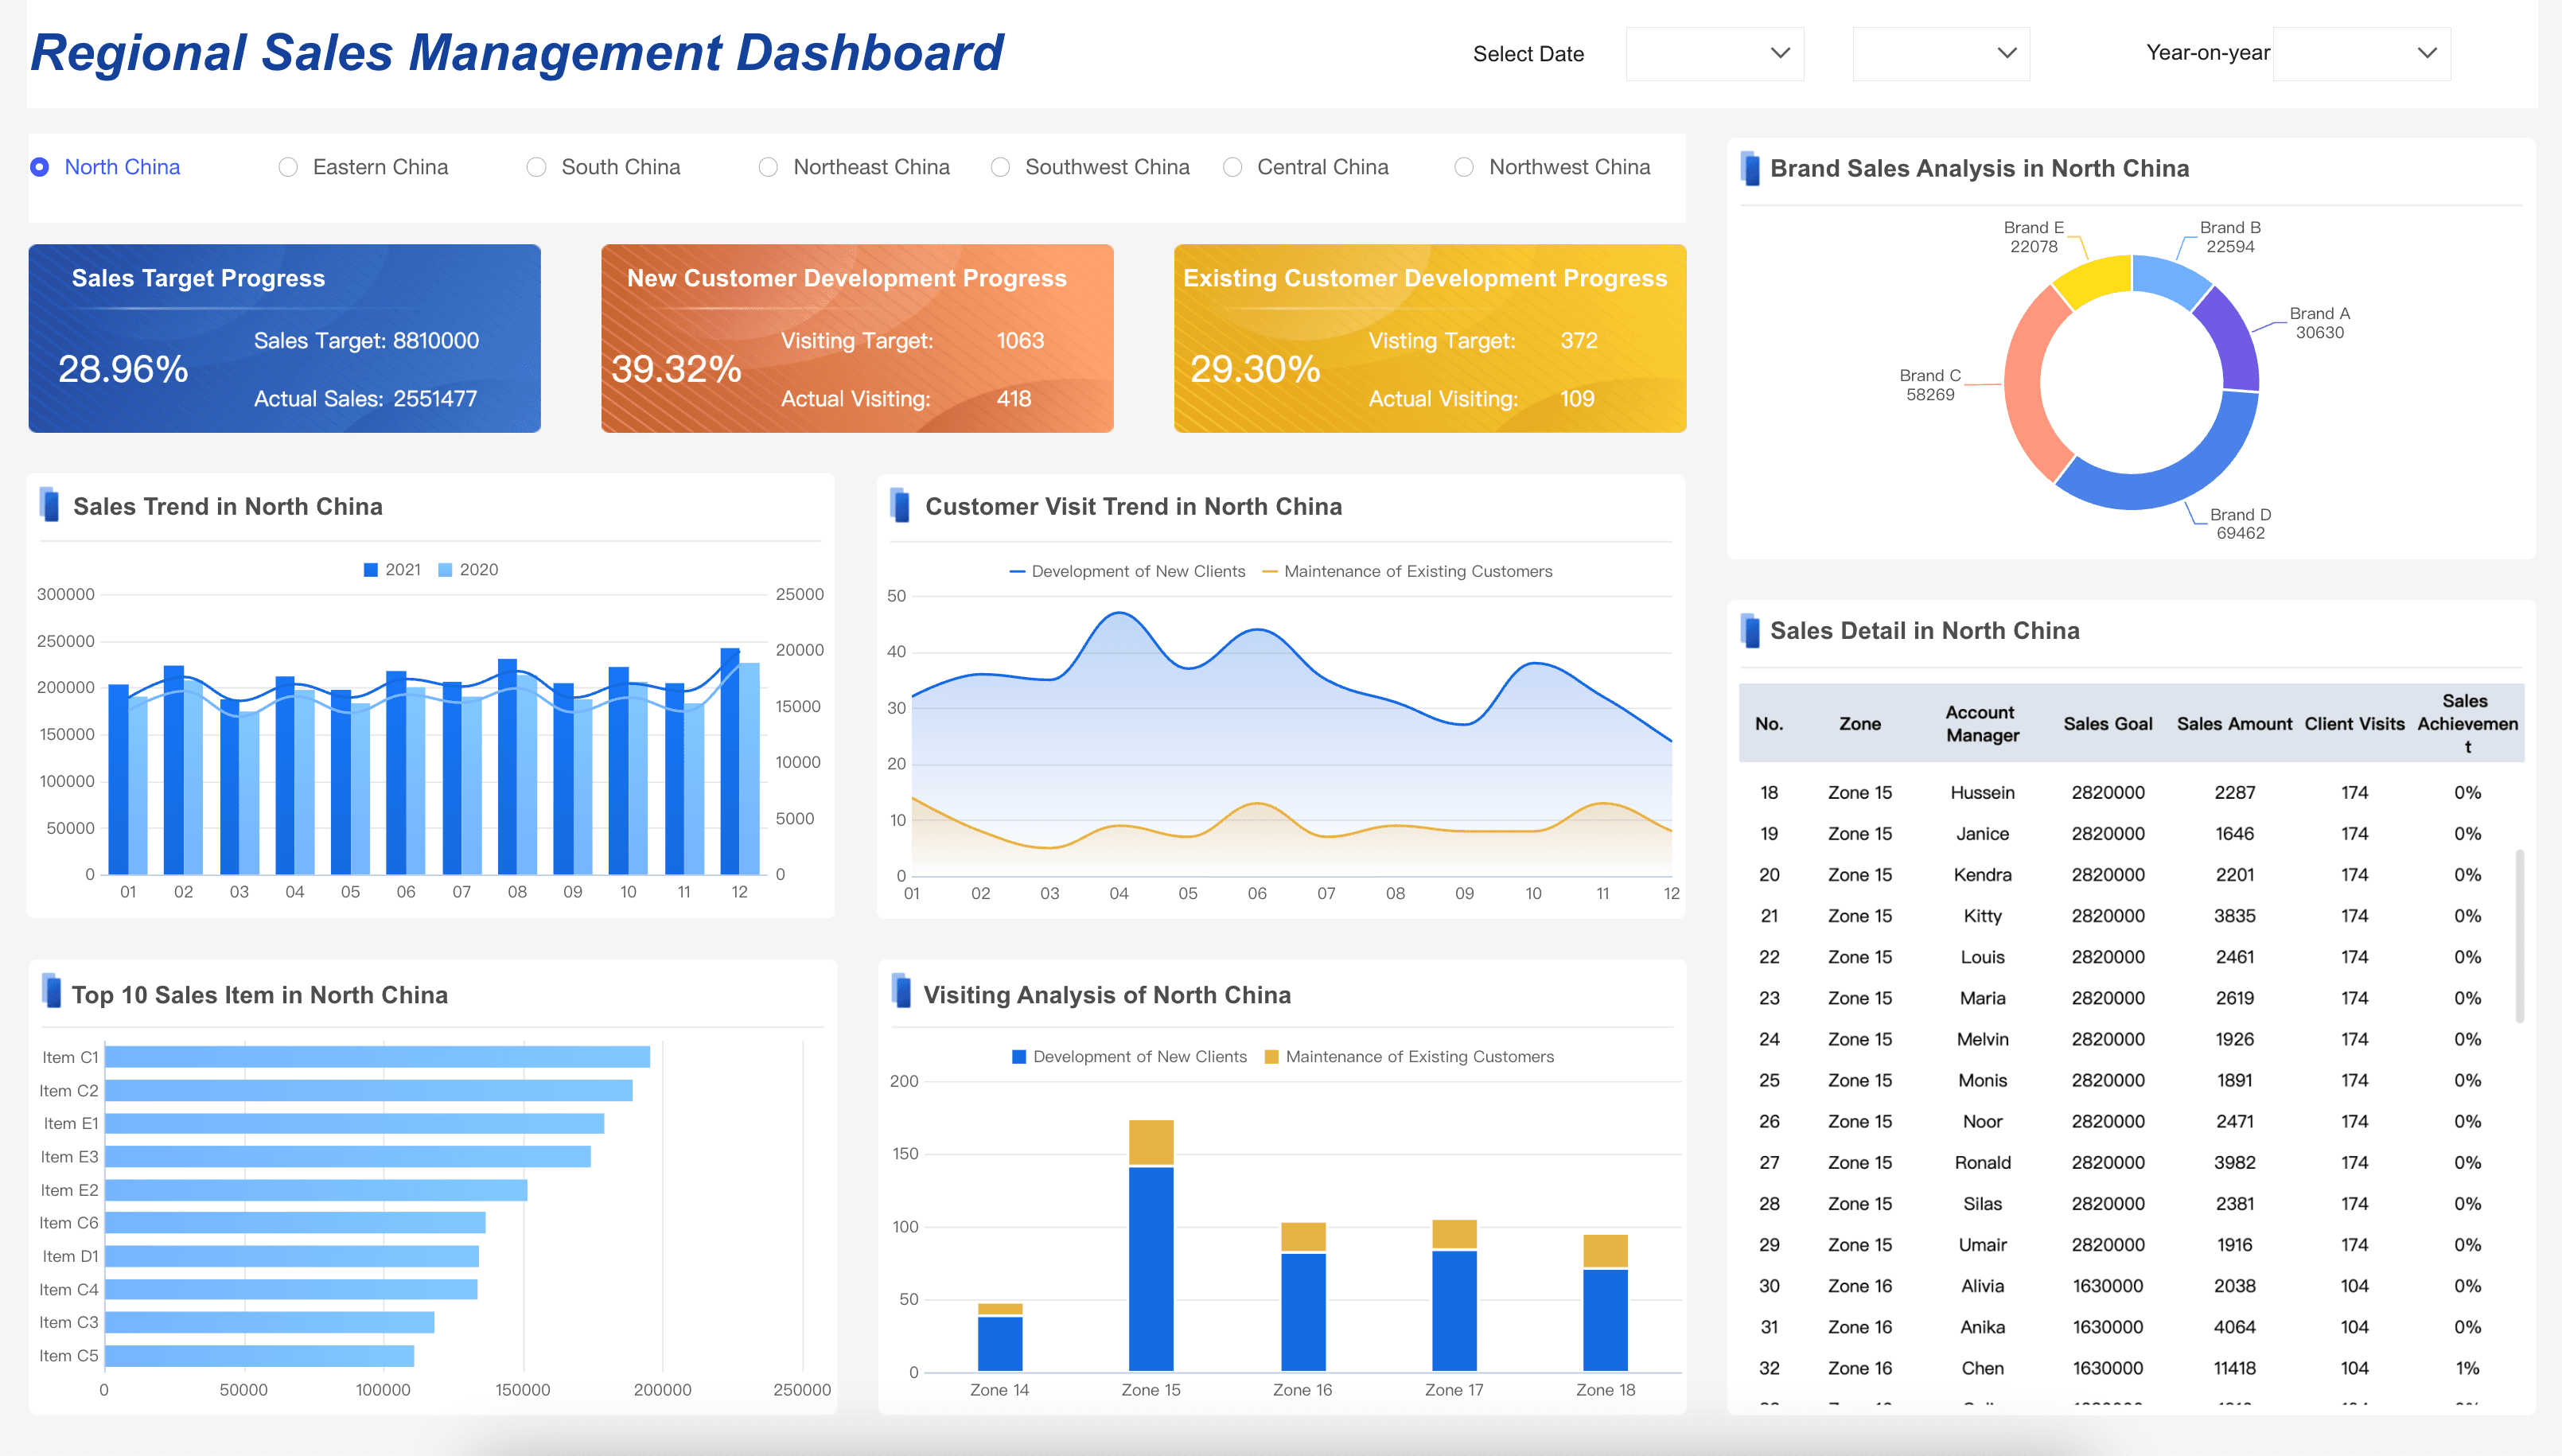
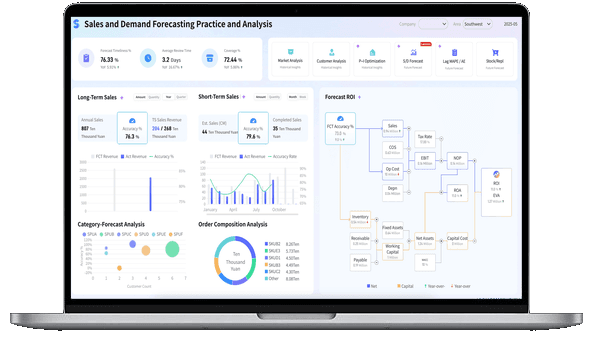
Sales Management Dashboard
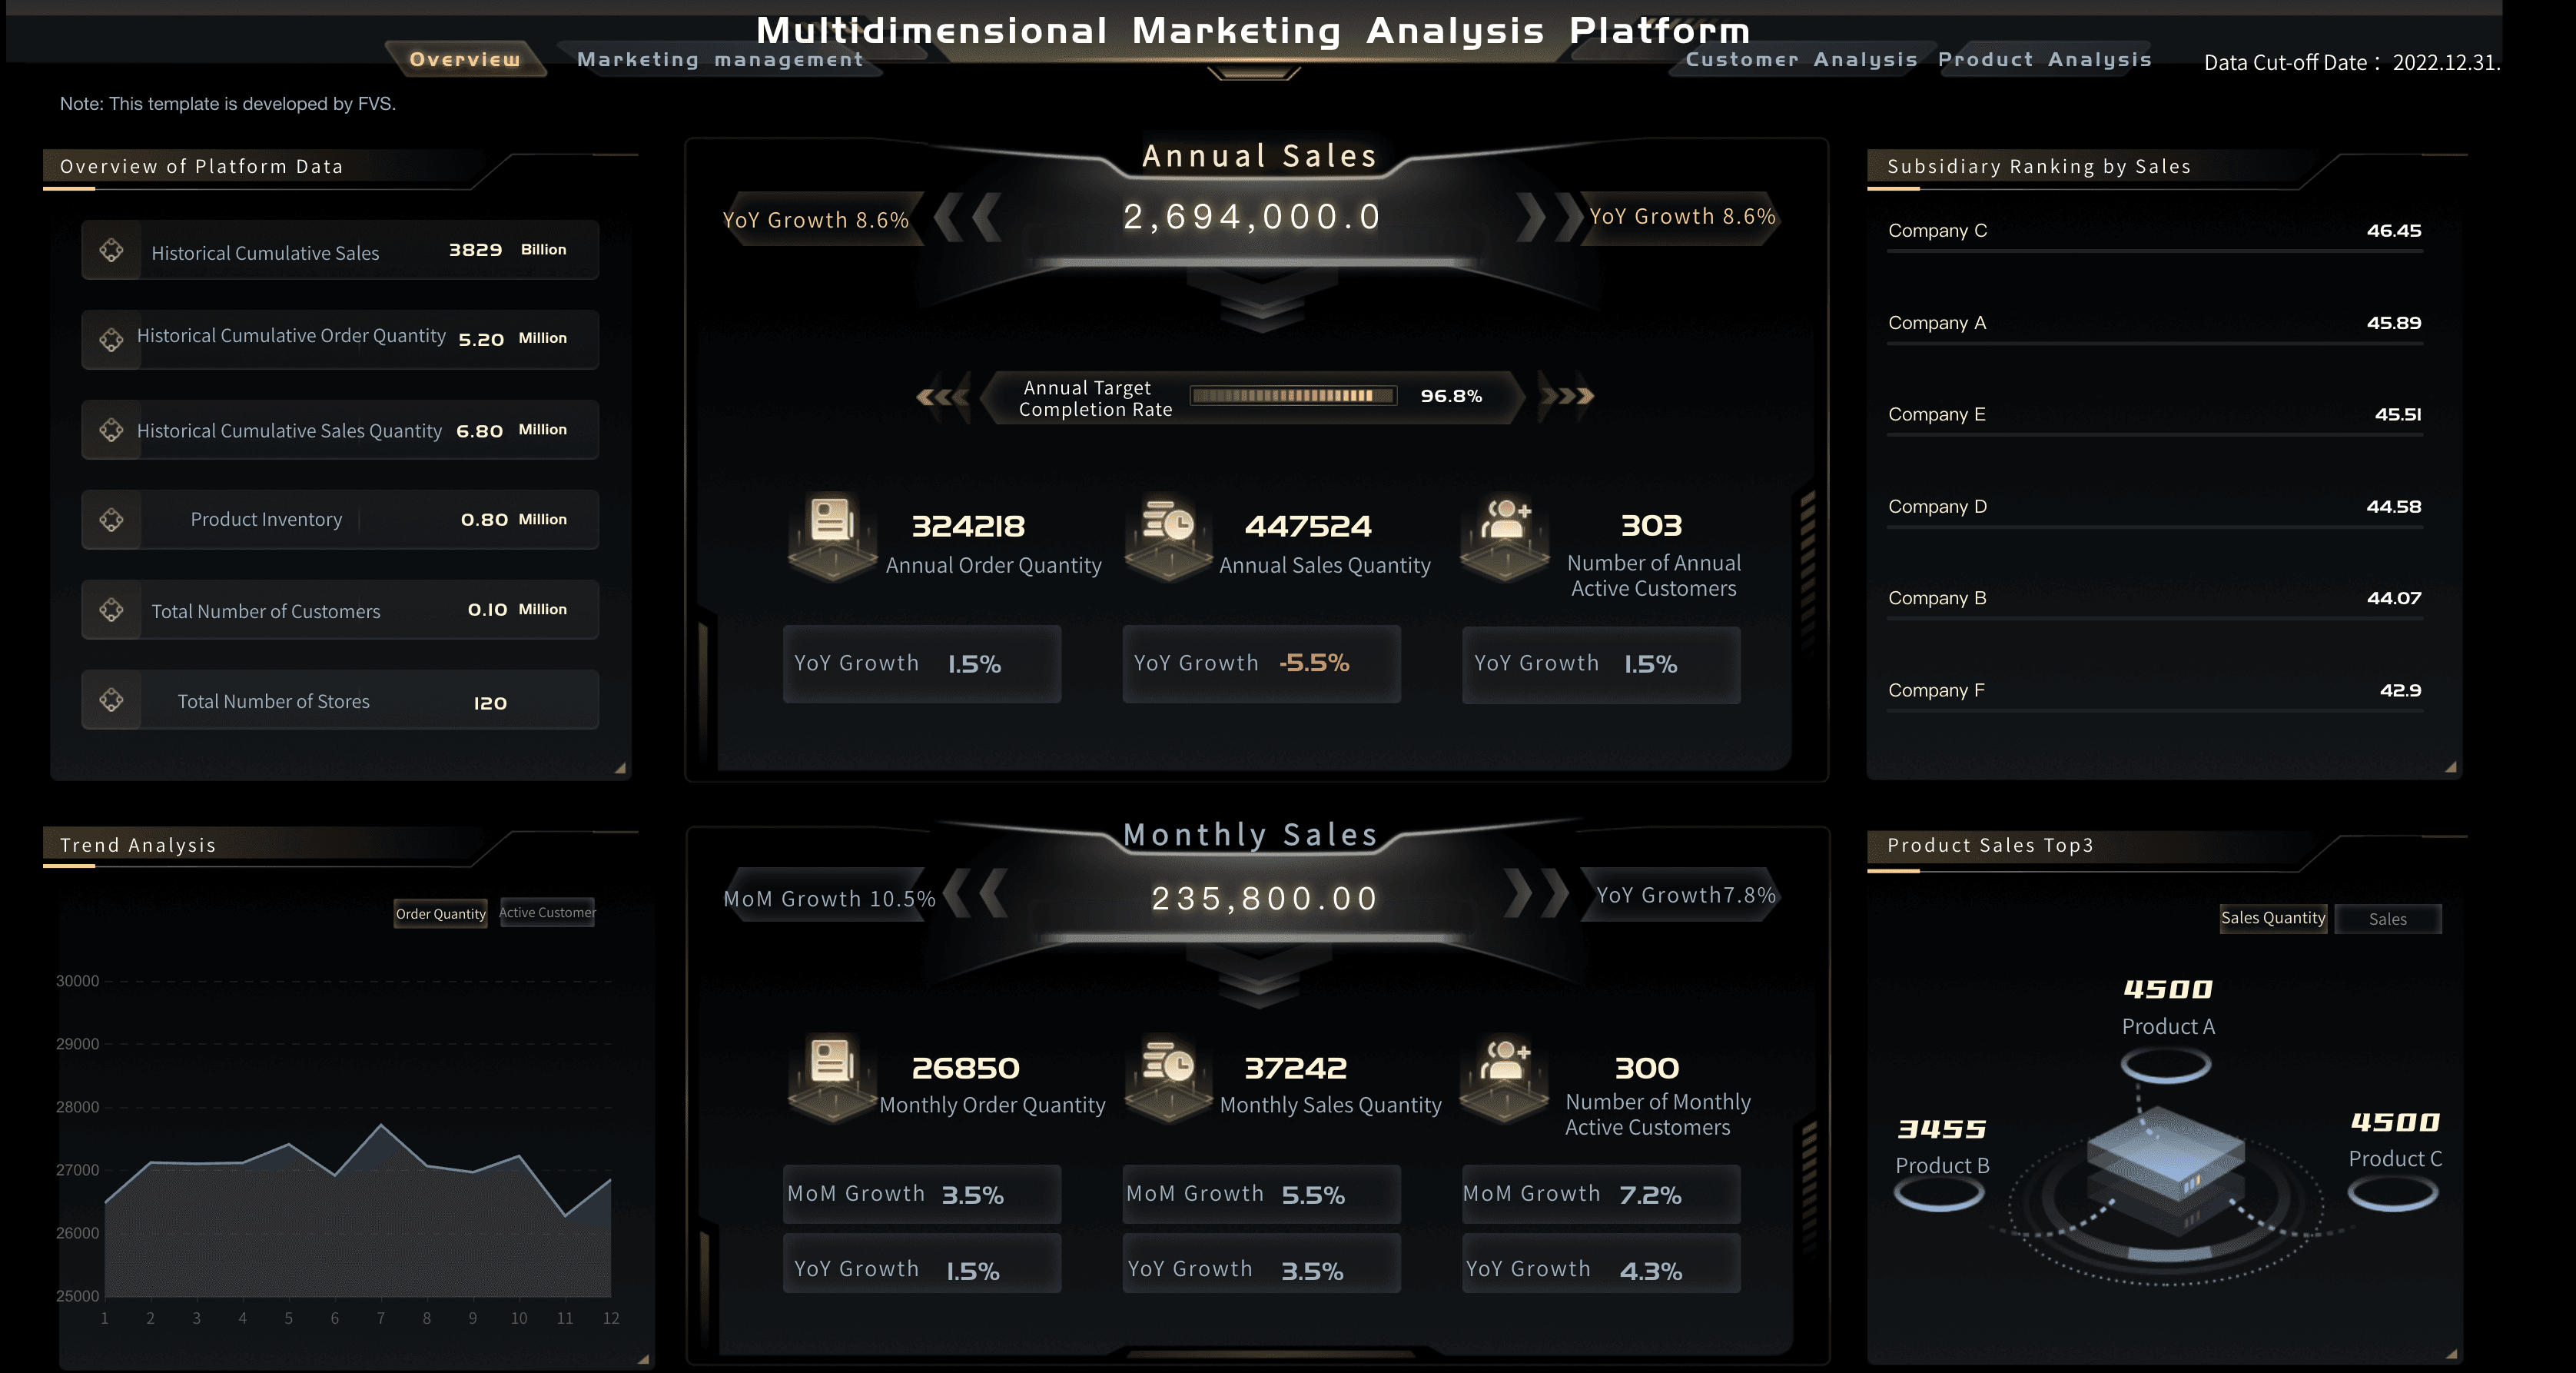
Marketing Analytics

Store Performance

Consumer Data Center Solution
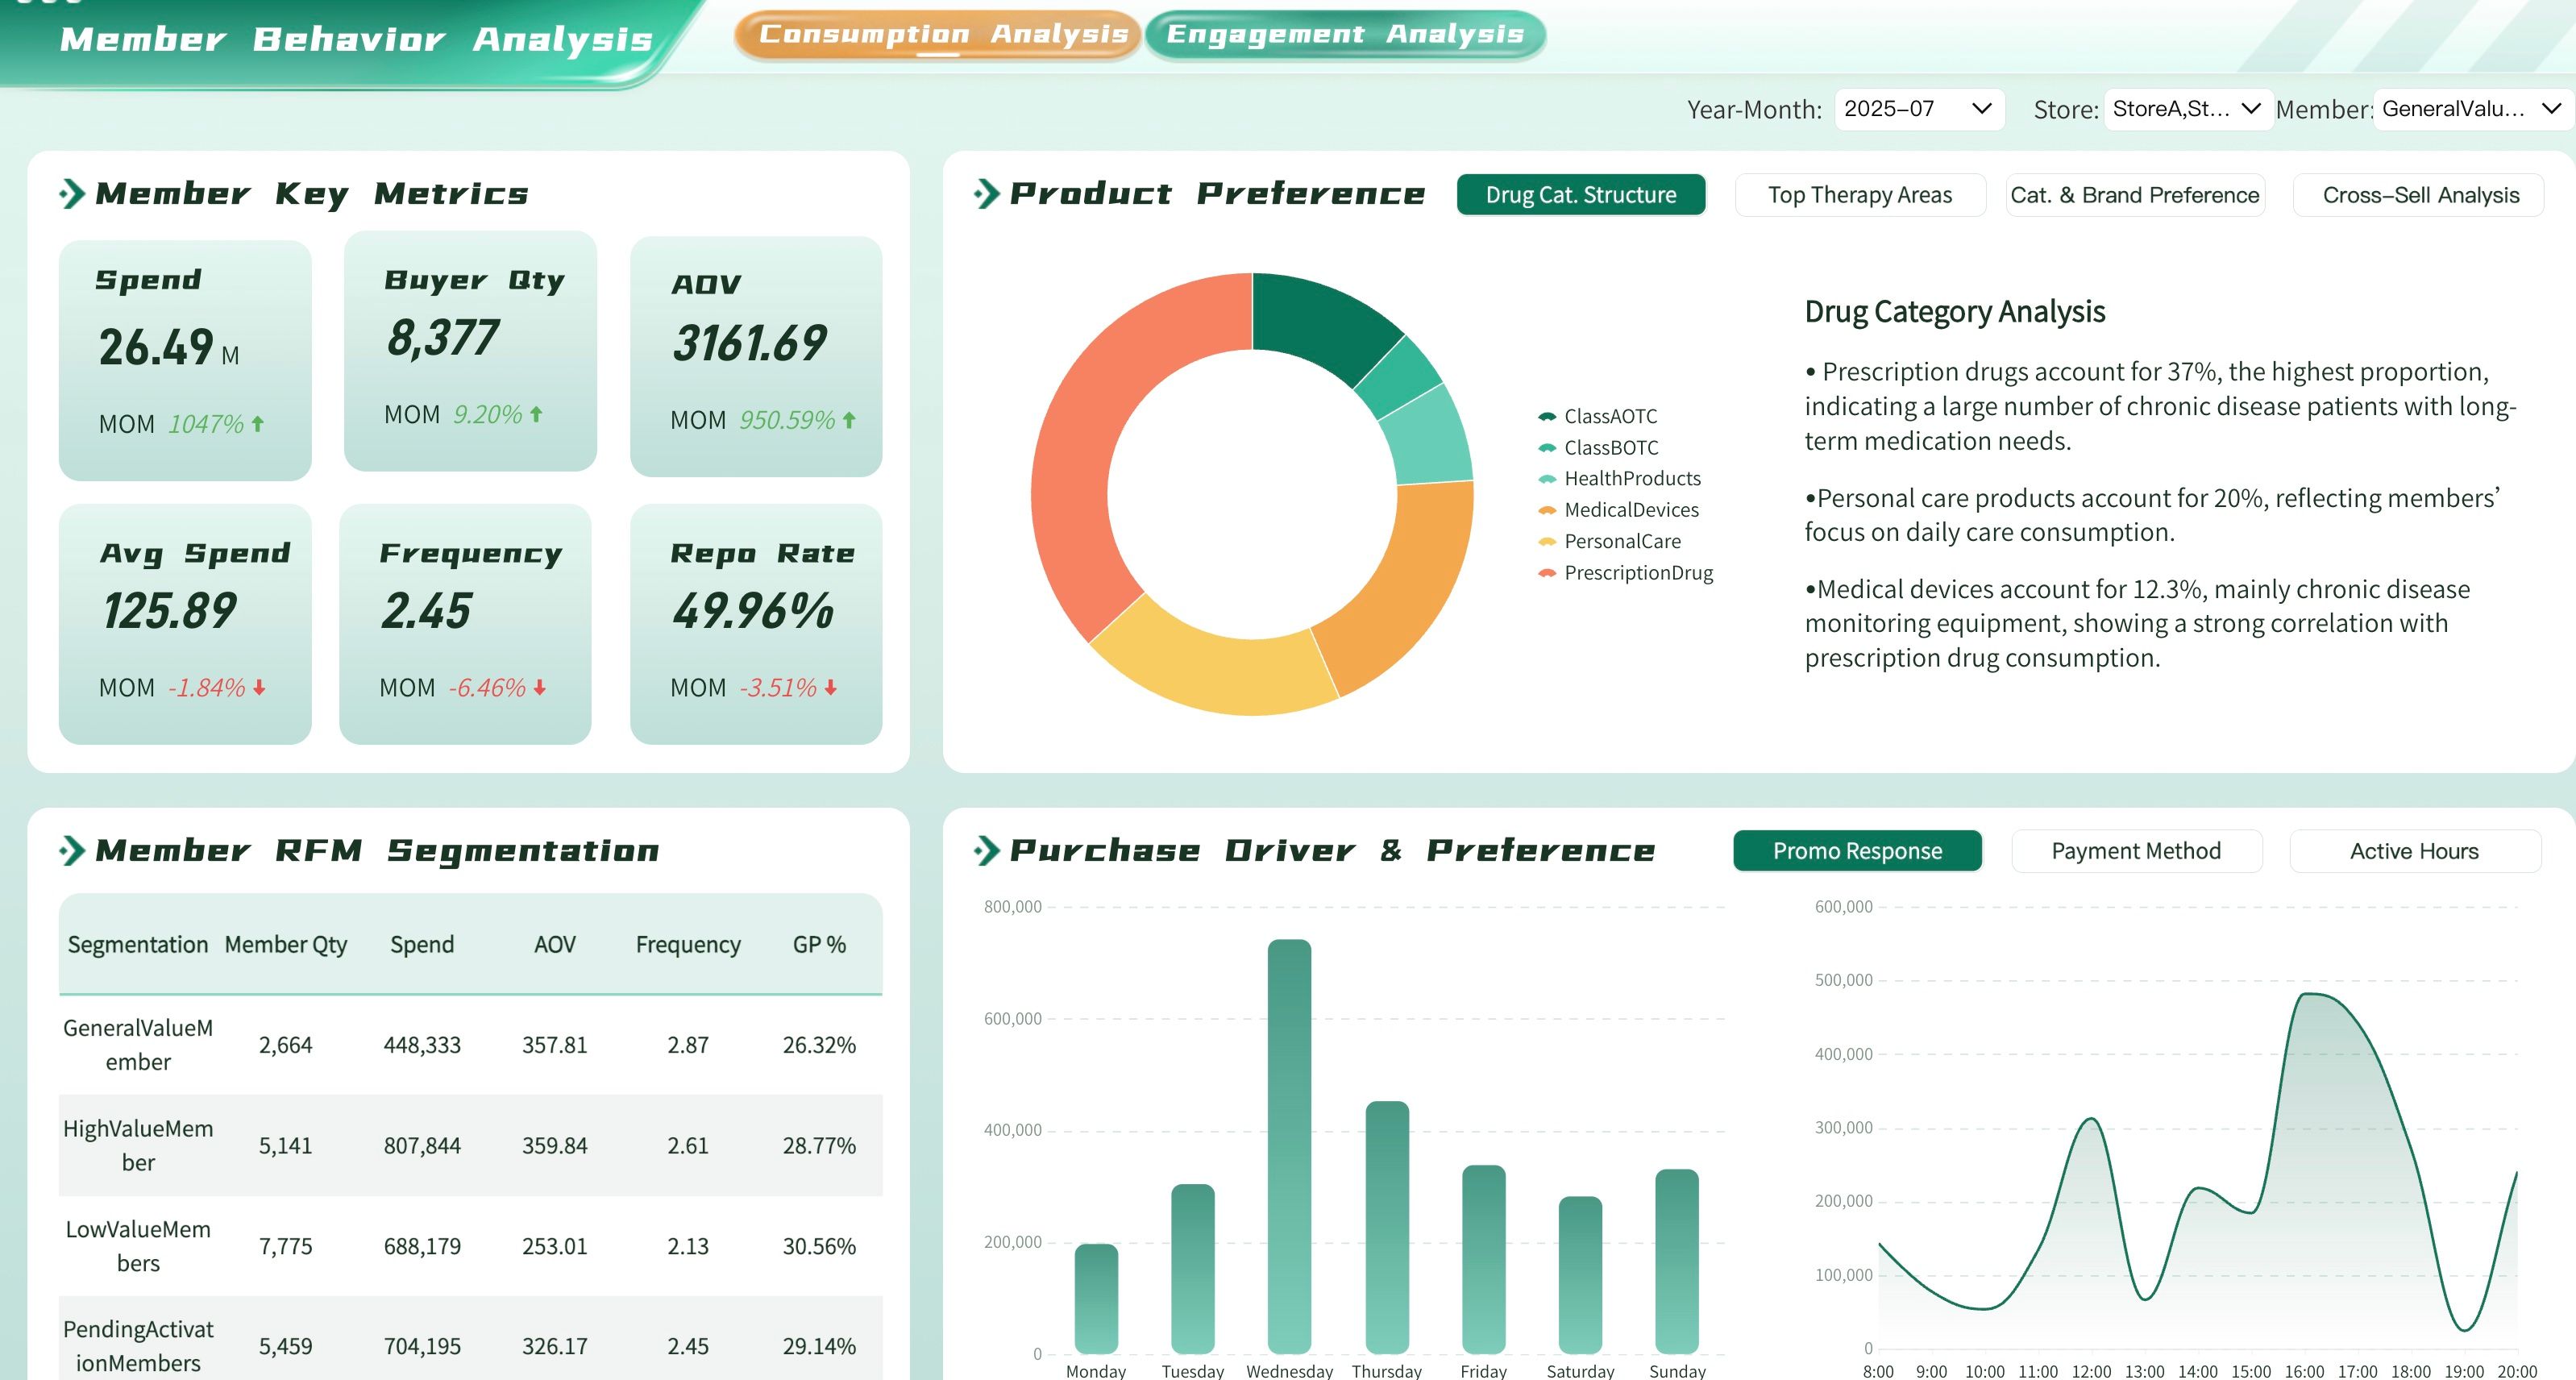
Member Behavioral Insights Dashboard
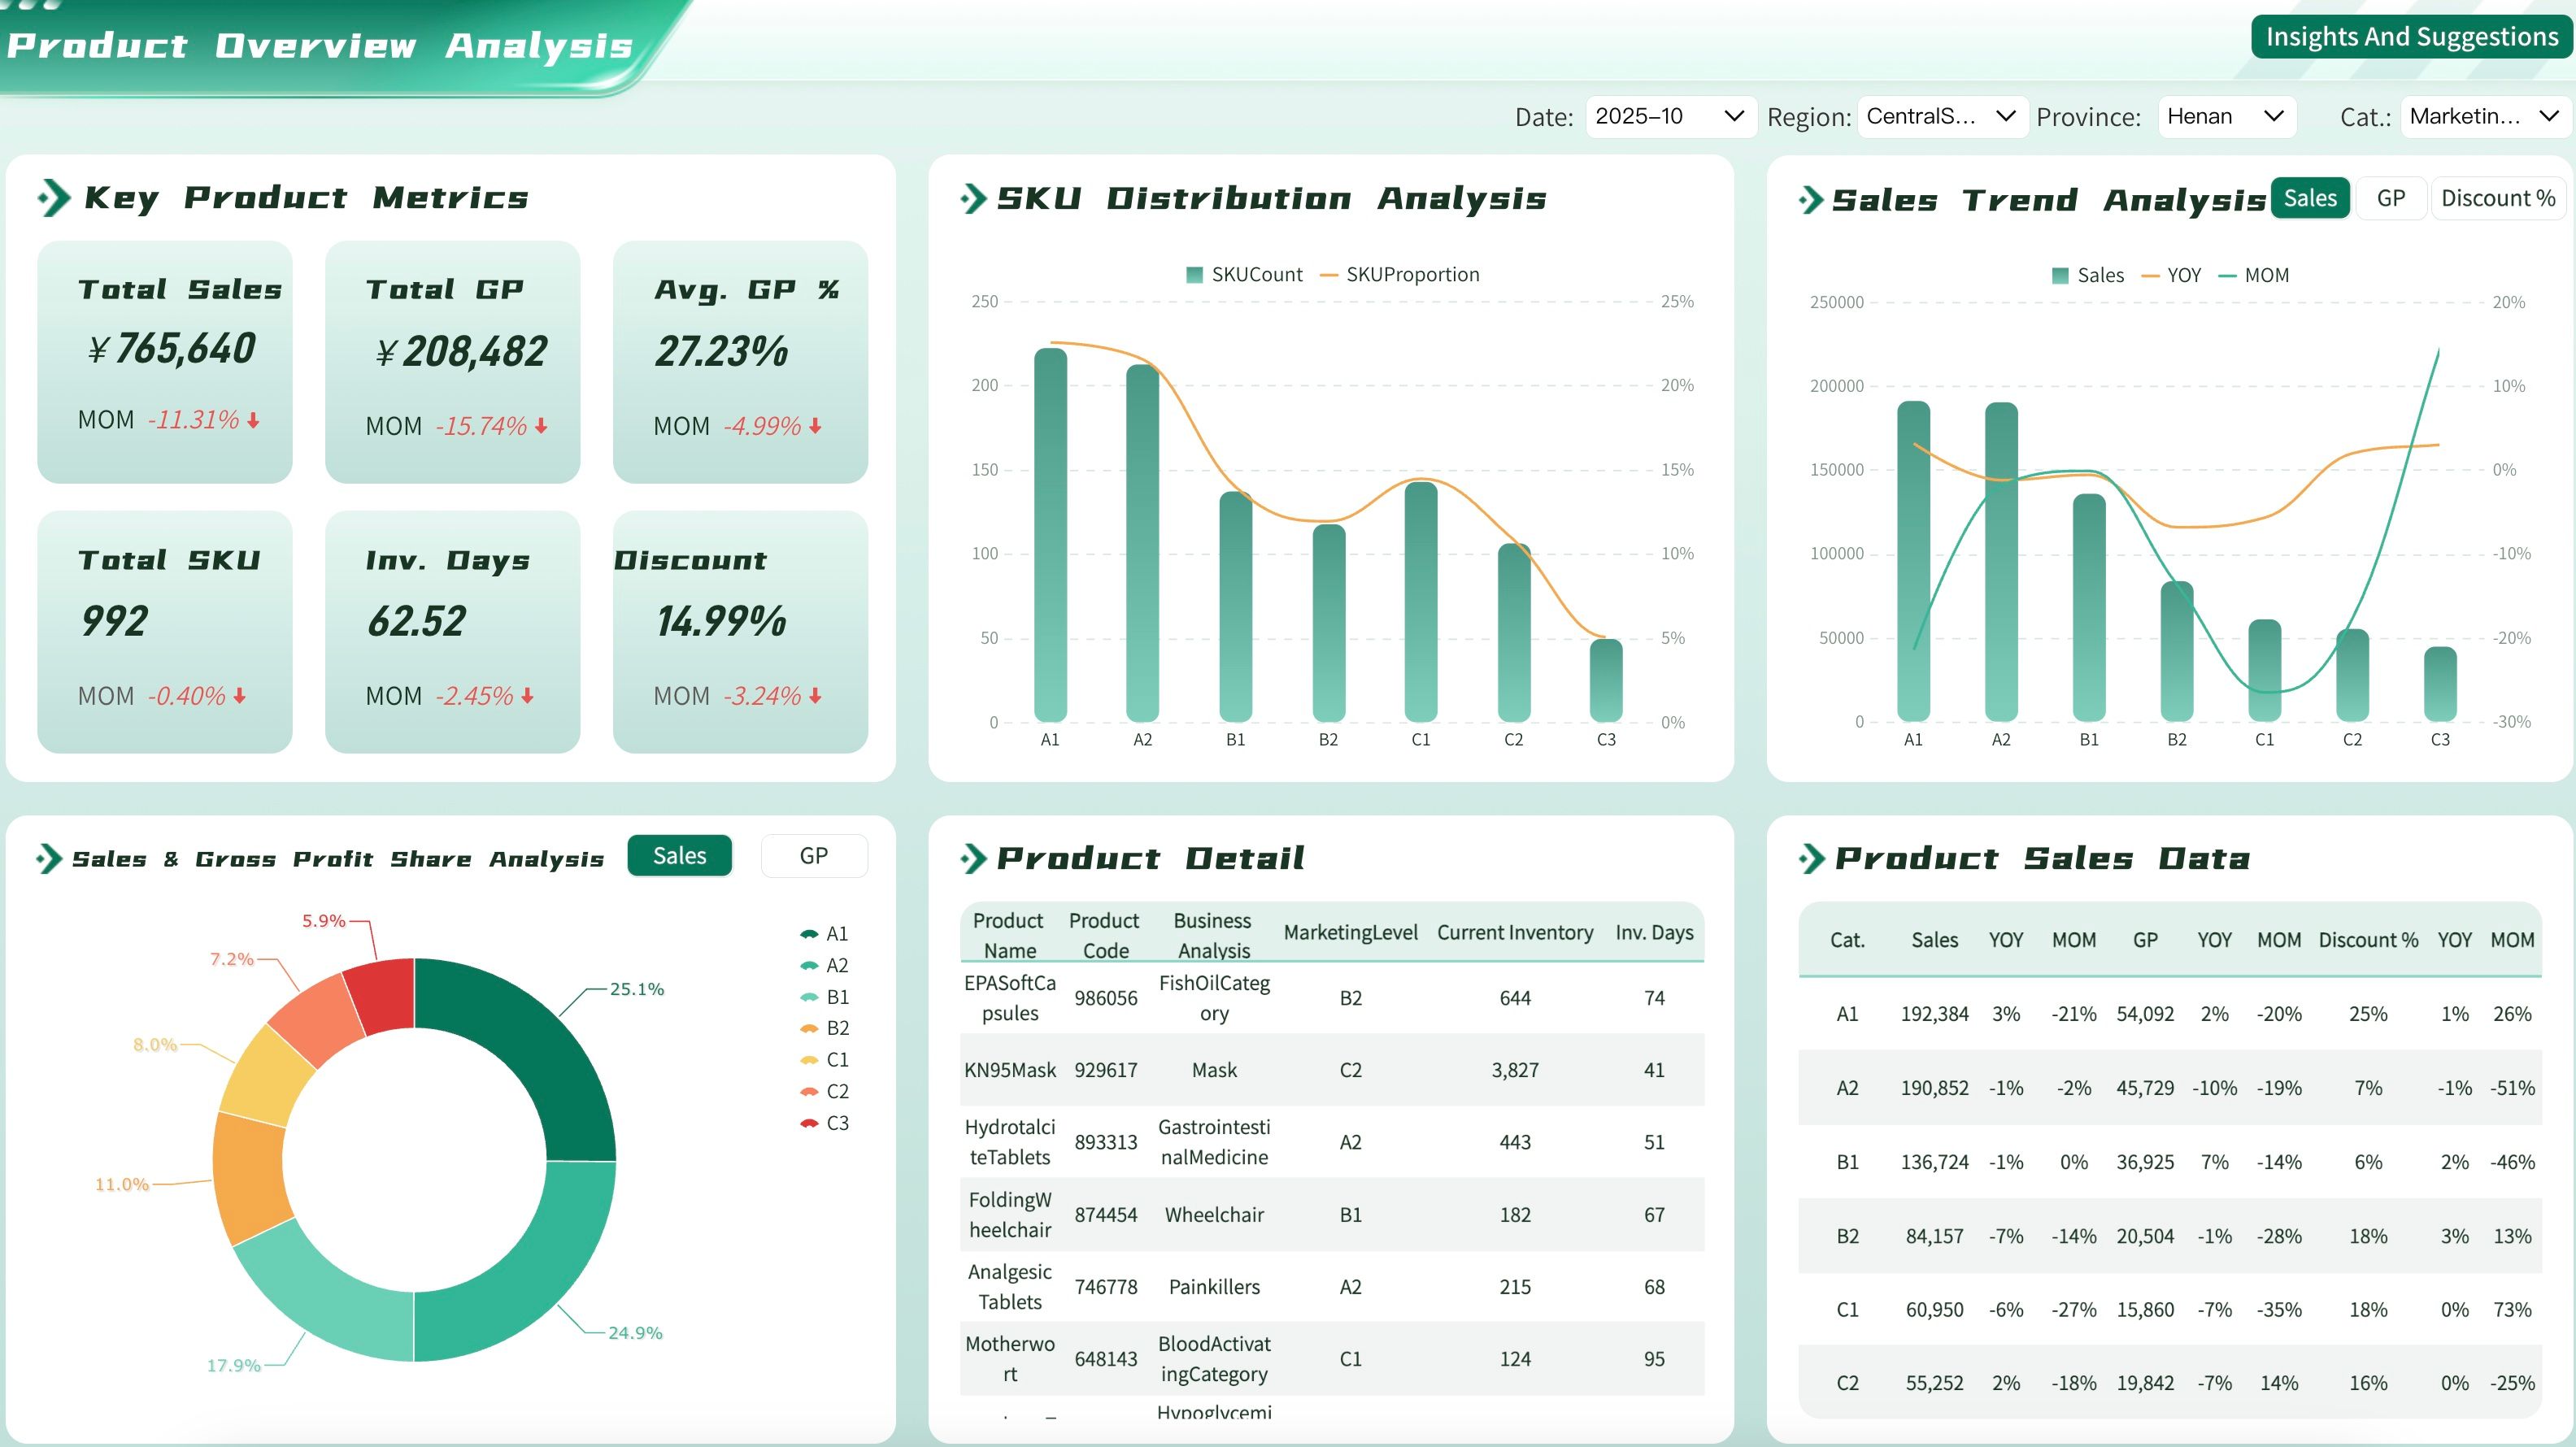
Product Overview Dashboard
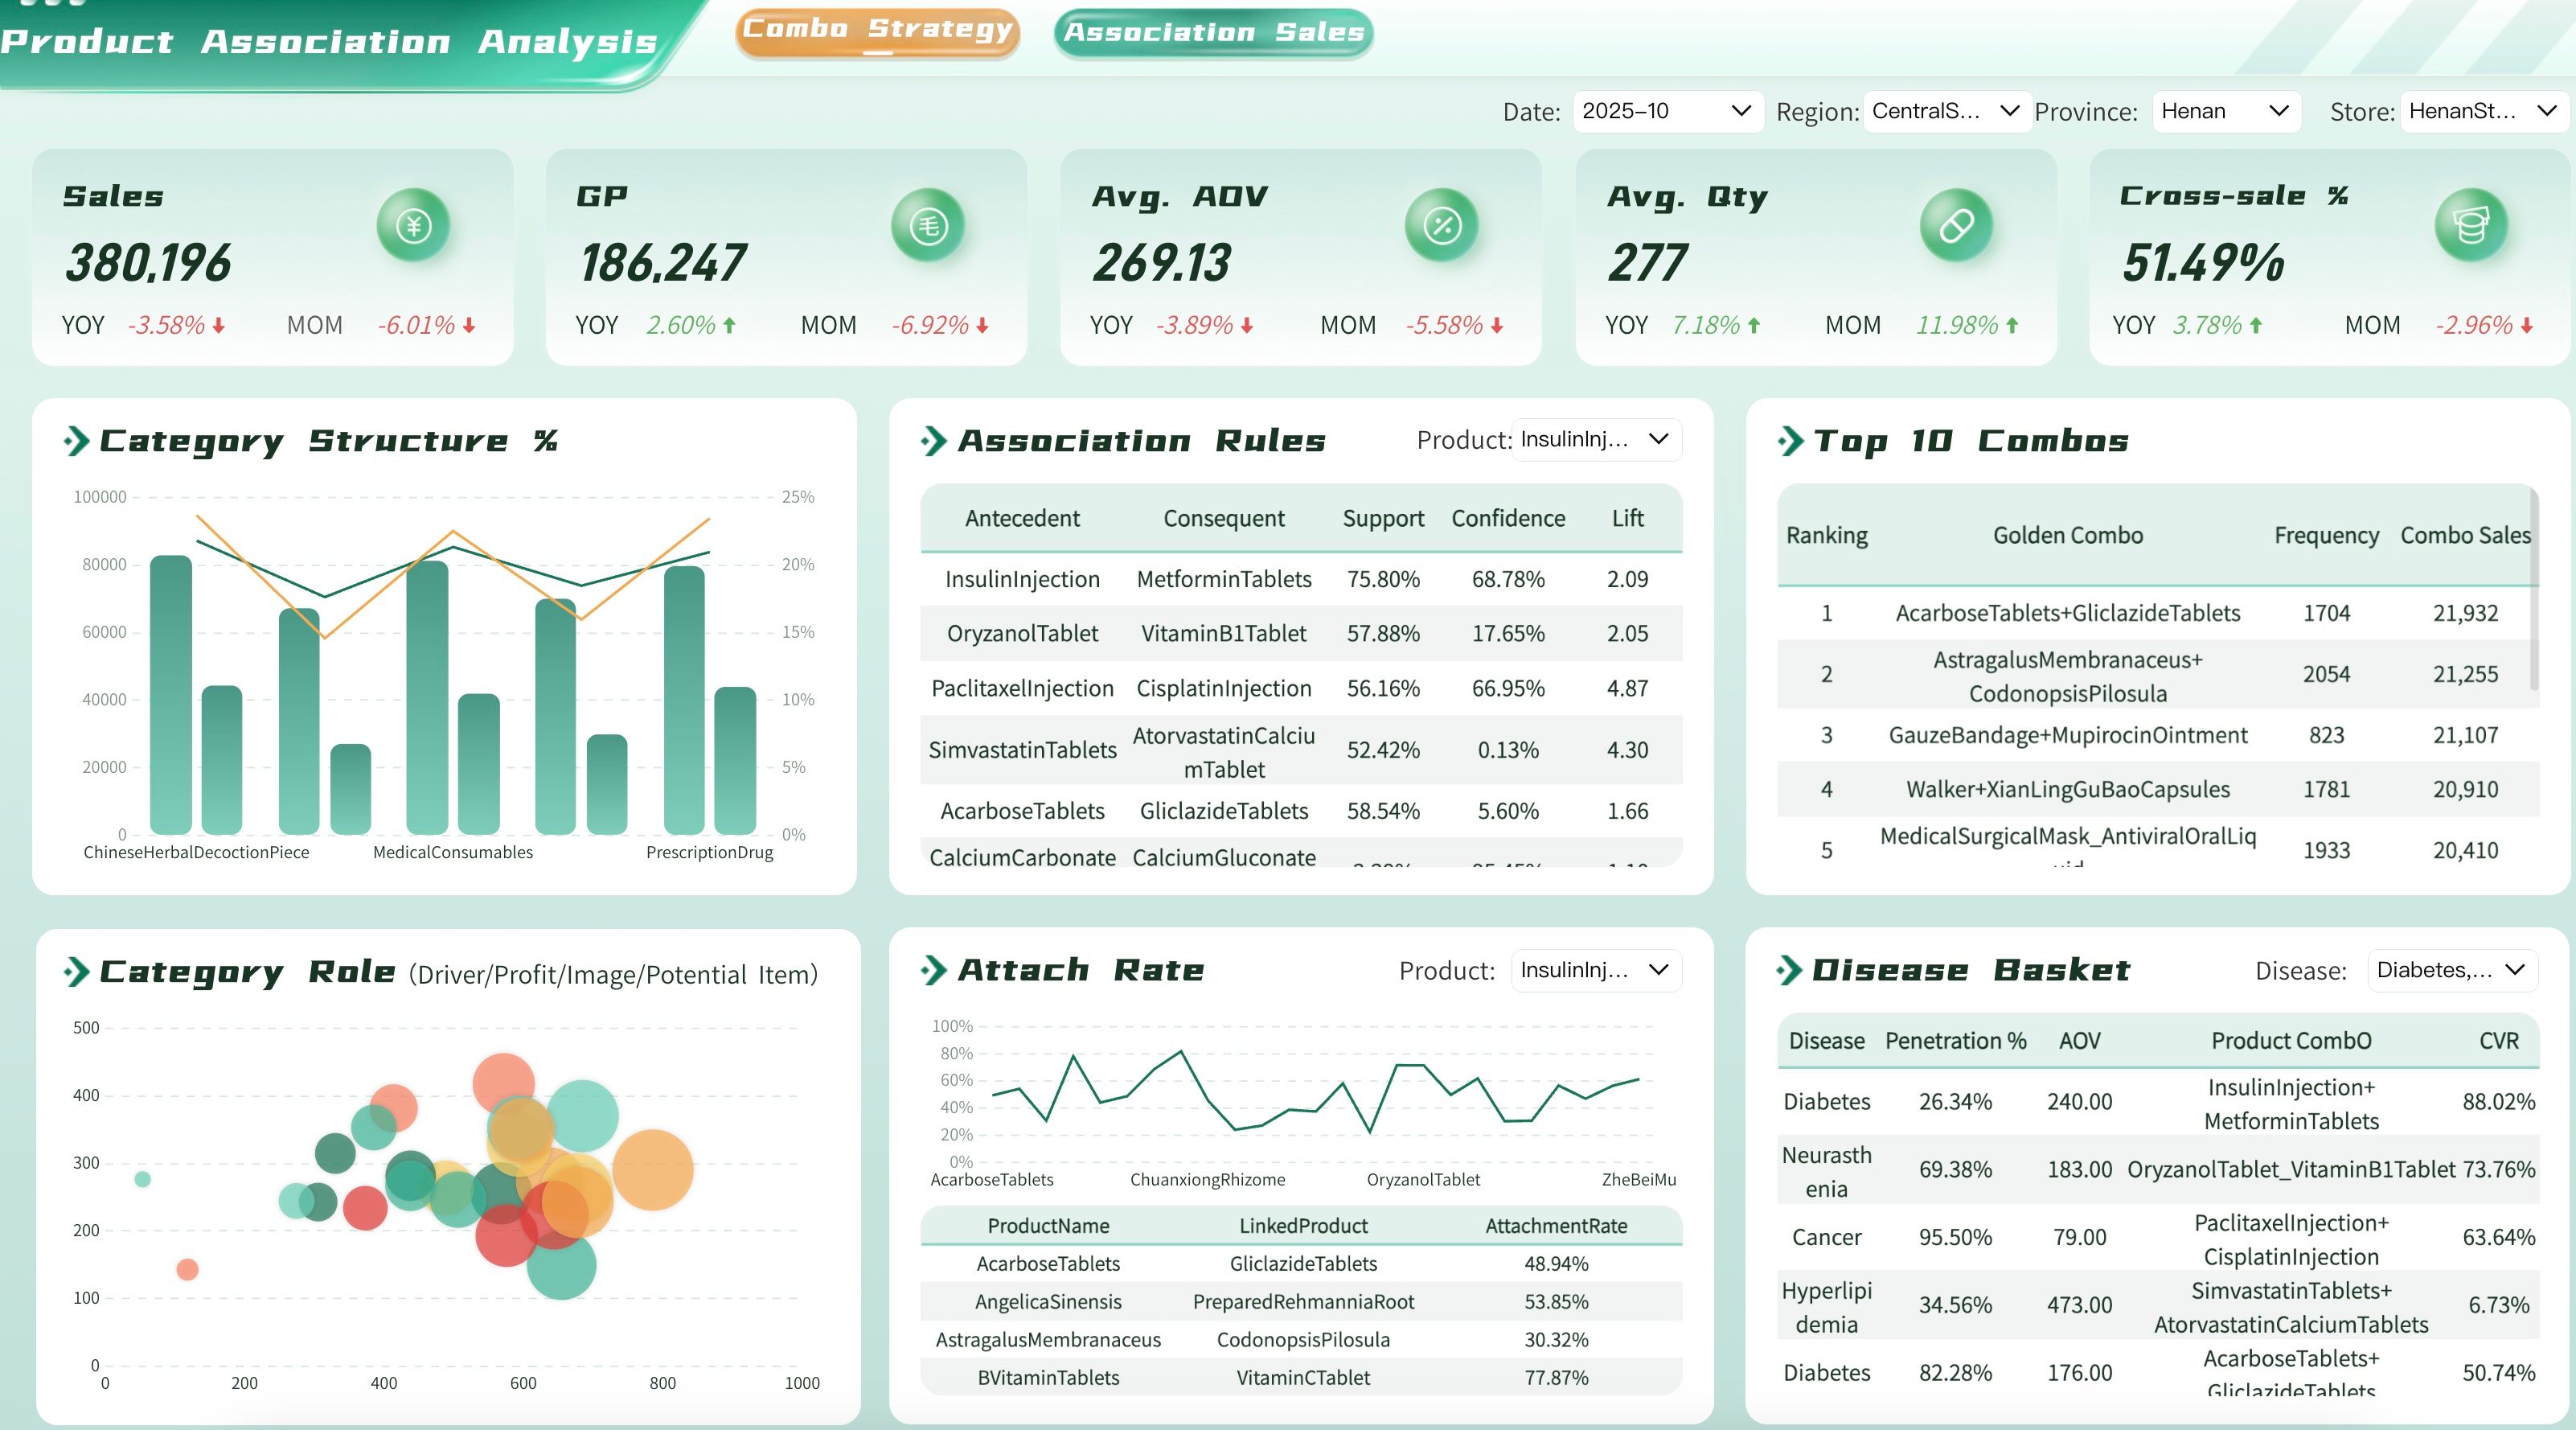
Product Affinity Analysis Dashboard

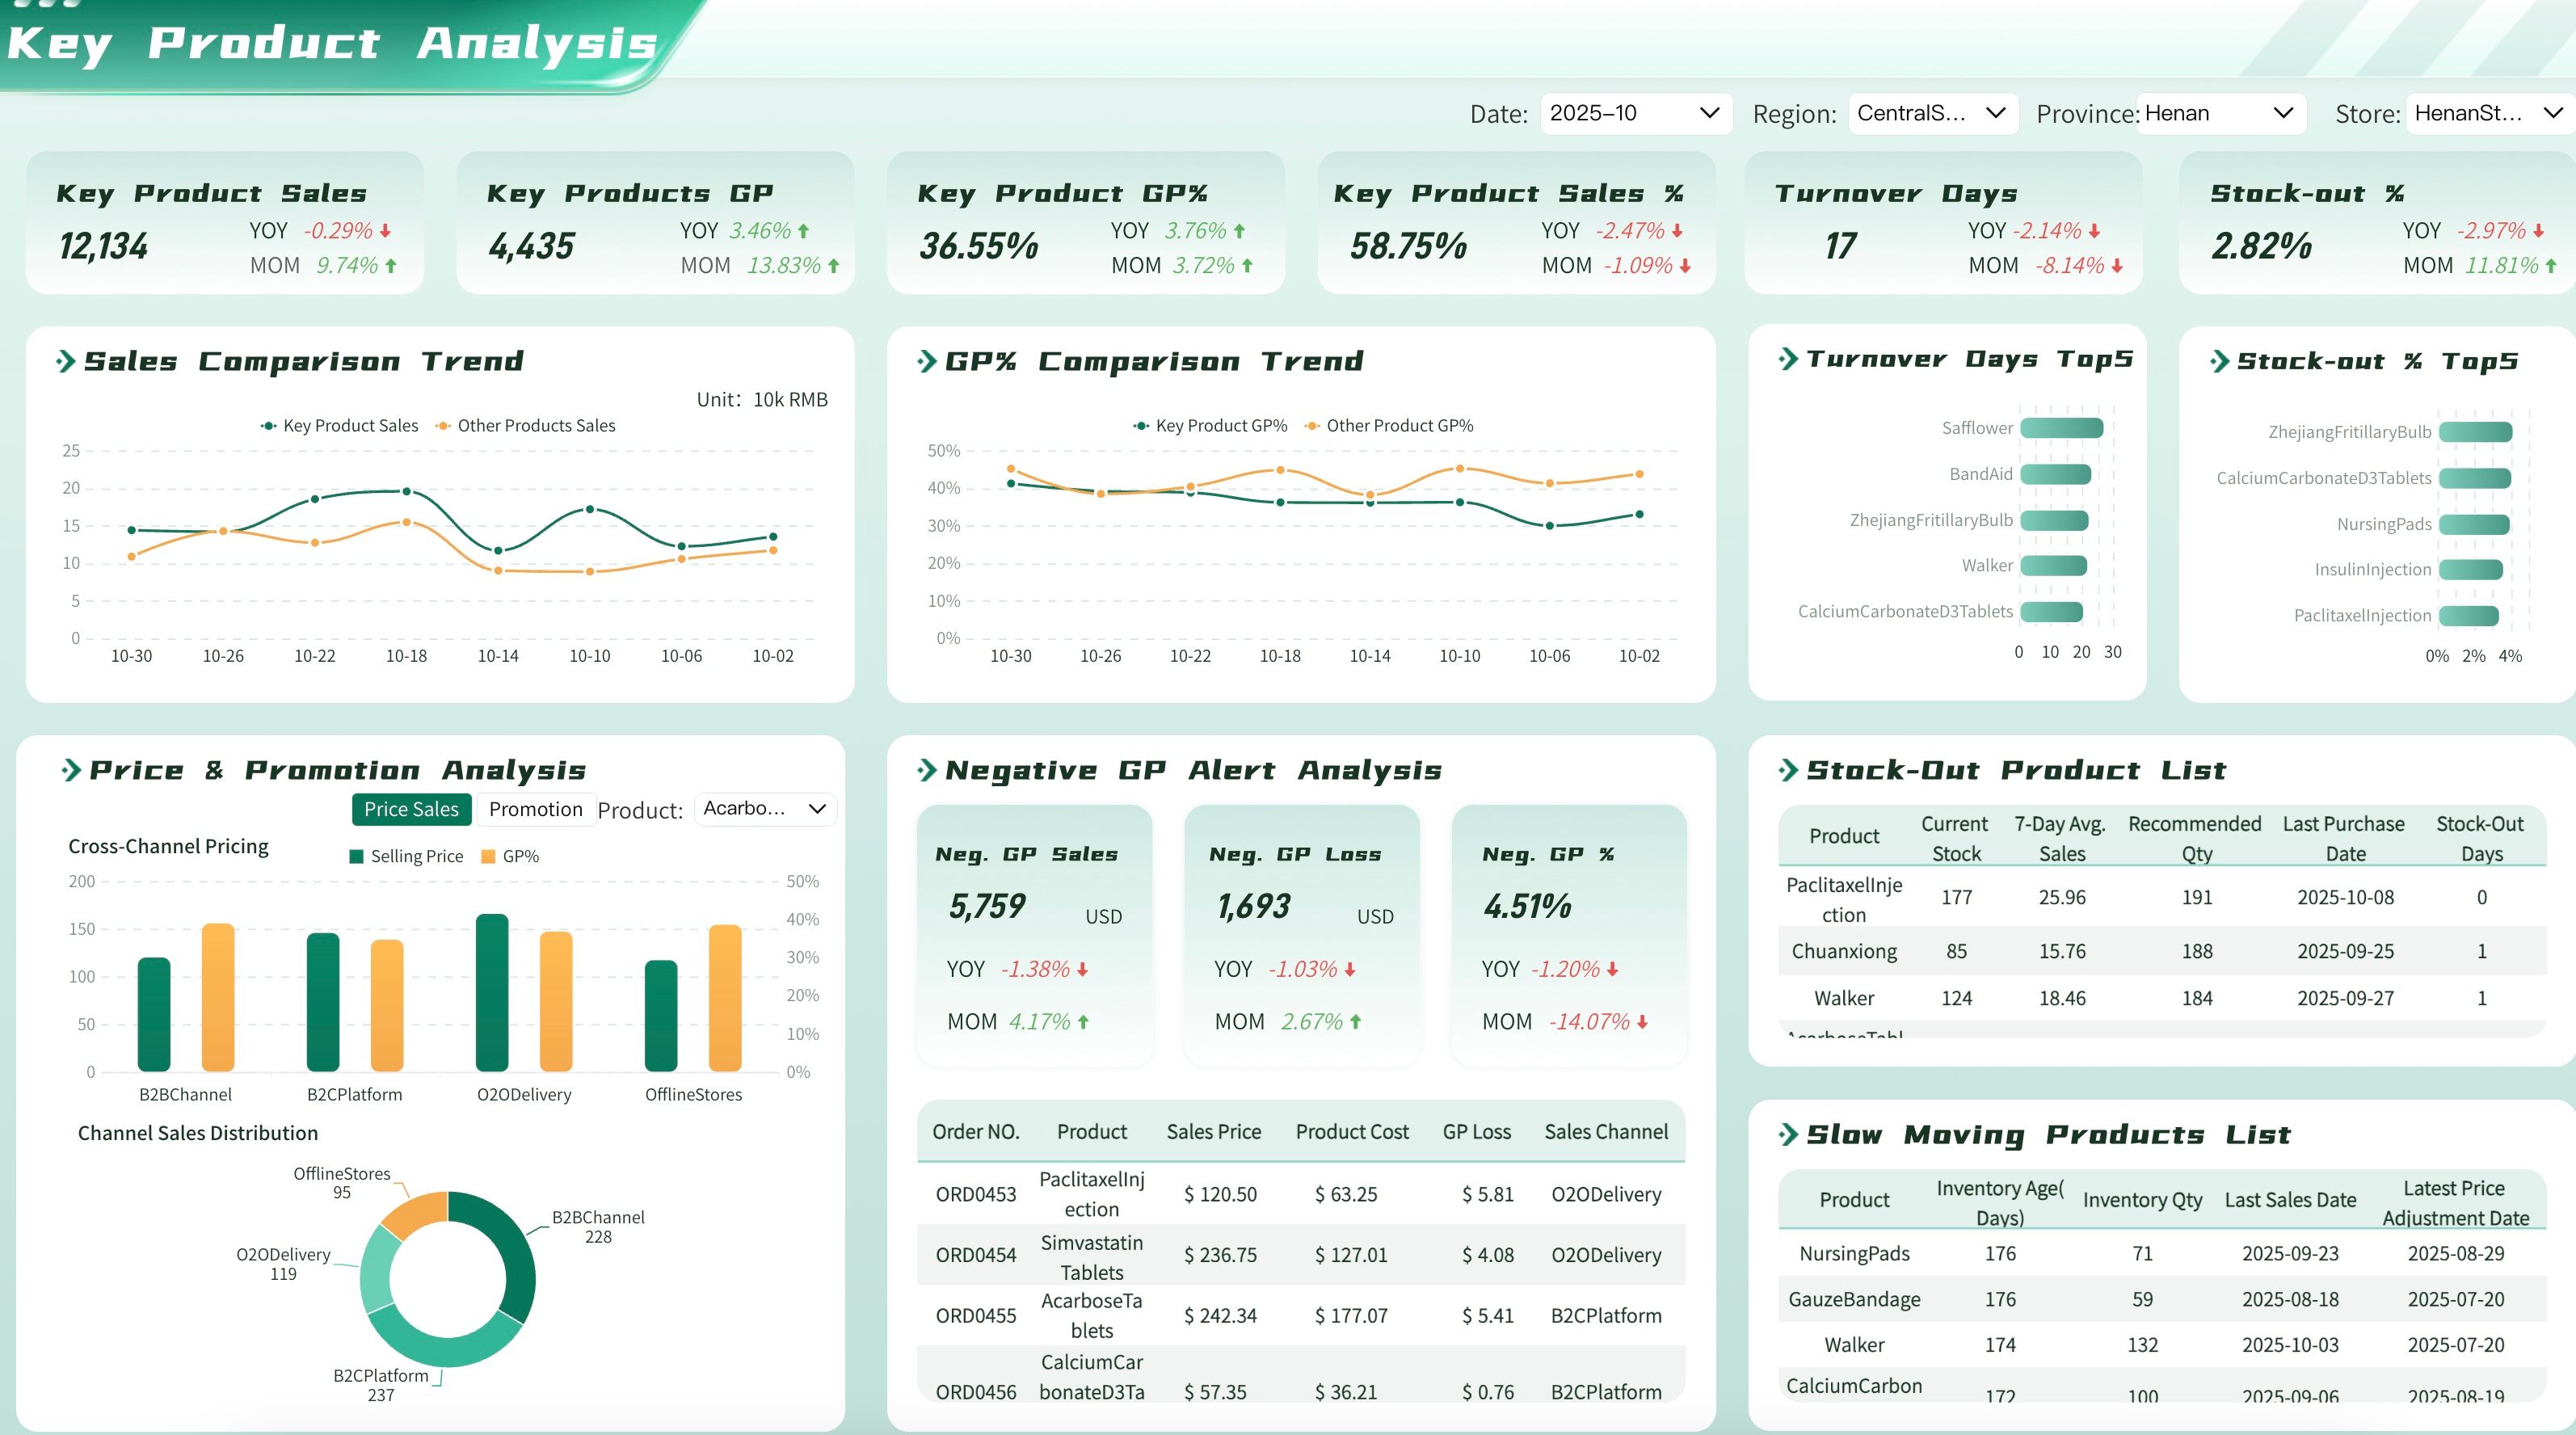
Product Sales Analysis
Top Products Dashboard
FAQs
A sales dashboard is a real-time monitoring tool checked daily for operational awareness. A sales report is a periodic, structured document designed for deeper analysis, trend identification, and stakeholder communication during review cycles. Use dashboards to watch; use reports to understand and decide.
Cadence depends on the report type and audience. Weekly activity reports support frontline coaching. Monthly performance reports drive sales ops reviews. Quarterly business reviews inform strategic planning. Annual reports support board-level discussions and long-term planning. Match frequency to the decision rhythm, not data availability.
Actionable reports combine three elements: clear performance benchmarks, variance explanations with root-cause analysis, and explicit recommendations tied to owners and deadlines. A report showing "revenue down 12%" is informational. One stating "revenue down 12% due to 3 stalled enterprise deals in APAC; recommended action: VP-led account review by Friday" is actionable.
Yes. Modern BI platforms automate data extraction, calculation, and distribution while preserving space for analyst commentary and strategic interpretation. Automation eliminates manual compilation errors and frees analysts to focus on insight generation rather than data wrangling.
Distribution should be role-specific. Reps receive individual performance summaries. Managers get team-level pipeline and activity reports. Directors and VPs review regional and segment analyses. C-suite and board members receive executive summaries with strategic implications. Avoid blanket distribution lists — irrelevant reports erode engagement.
