
What is Supply Chain Analytics?
Benefits of Supply Chain Analytics
Supply chain analytics matters because supply chain work is cross-functional. A late customer order may involve sales promises, procurement timing, production capacity, quality checks, inventory allocation, warehouse labor, transportation availability, and customer service communication.
Without a shared analytics layer, each team may see only its own part of the issue. Procurement sees supplier lead time. Manufacturing sees line capacity. Logistics sees carrier status. Finance sees cost variance. Customer service sees complaints. Supply chain analytics creates a common decision view.
Key benefits include:
- Better exception management: Teams can focus on orders, suppliers, materials, and routes that need attention instead of scanning every row.
- More reliable inventory planning: Inventory analytics can reveal slow-moving stock, shortage risk, safety stock gaps, and demand-supply imbalance.
- Faster root-cause analysis: Drill-down views help teams move from a top-level KPI to the specific plant, supplier, SKU, region, route, or order causing the change.
- Stronger supplier performance review: Procurement can compare on-time delivery, quality, cost, responsiveness, and risk signals by supplier or category.
- Lower reporting friction: Recurring supply chain reports can use governed definitions instead of repeated manual exports.
- More useful executive communication: Leaders can see performance, risk, cost, service, and follow-up owners in one view.
The practical value is not just "more data." The value is fewer unresolved questions in operating meetings: what changed, why it matters, who owns the next step, and what will be reviewed next.
Don’t just collect supply chain data. Visualize what matters.
Download the KPI Dashboard Guide to strengthen your supply chain analytics foundation:
- How to turn supply chain goals into measurable KPI views
- 10 essential steps to build effective KPI dashboards
- How to choose the right charts and avoid visual clutter
- 15 top-notch dashboard templates for 2026

Types of Supply Chain Analytics
Supply chain analytics is often described in four levels. Each level answers a different kind of business question. Most teams need all four, but they do not need to build all four at once.
Descriptive analytics
Descriptive analytics explains what happened. It is the foundation for most dashboards and reports. Common examples include inventory turnover, order fill rate, on-time delivery, supplier defect rate, stockout count, transportation cost, and warehouse throughput.
Use descriptive analytics when you need to know:
- What was the service level this week?
- Which supplier delivered late most often?
- Which SKUs have the highest inventory value?
- Which warehouse handled the most inbound volume?
Diagnostic analytics
Diagnostic analytics explains why something happened. It connects top-level metrics to drivers such as supplier delay, production capacity, quality inspection, material shortage, route congestion, warehouse workload, or demand change.
Use diagnostic analytics when you need to know:
- Why did order cycle time increase?
- Why did inventory accuracy drop in one warehouse?
- Why did expedited shipping cost rise?
- Why did a product line miss the production plan?
Predictive analytics
Predictive analytics estimates what may happen next. It can support demand forecasting, shortage prediction, delivery risk scoring, supplier risk monitoring, capacity planning, and inventory replenishment.
This is where topics such as predictive analytics in supply chain, supply chain predictive analytics, and forecasting in supply chain management become useful. Prediction should still be tied to business review. A model that flags risk is only useful if the team knows who should review it, what data it used, and what action options are available.
Prescriptive analytics
Prescriptive analytics suggests possible actions. It may recommend reallocating inventory, changing replenishment timing, switching suppliers, adjusting production priority, combining shipments, or reviewing safety stock rules.
Prescriptive analytics needs more governance than descriptive analytics because it can influence operational decisions. Recommendations should include assumptions, constraints, owner review, and business context. In most enterprise settings, humans still make the final decision.
Metrics of Supply Chain Analytics
Supply chain analytics metrics should match the decision you need to support. A warehouse supervisor, procurement manager, COO, and finance leader do not need the same first screen. Start with the decision context, then choose the smallest set of metrics that can explain performance.
Demand
Example metrics
- Forecast accuracy
- Demand variance
- Order volume
- Promotion impact
What it helps answer Is demand changing faster than the plan?
Inventory
Example metrics
- Inventory turnover
- Days of inventory
- Stockout rate
- Excess stock
- Safety stock coverage
What it helps answer Do we have the right stock in the right place?
Procurement
Example metrics
- Supplier on-time delivery
- Purchase price variance
- Order cycle time
- Defect rate
What it helps answer Which suppliers affect cost, quality, and lead time?
Production
Example metrics
- Plan attainment
- Throughput
- OEE
- Yield
- Downtime
- WIP aging
What it helps answer Can production meet committed demand?
Warehouse
Example metrics
- Inbound volume
- Picking accuracy
- Dock-to-stock time
- Labor utilization
What it helps answer Where is warehouse flow slowing down?
Logistics
Example metrics
- Freight cost
- Route performance
- Carrier on-time rate
- Delivery cycle time
What it helps answer Which transportation choices affect cost and service?
Customer Service
Example metrics
- Perfect order rate
- Fill rate
- Backorder rate
- On-time in-full
What it helps answer Are customers receiving what was promised?
Risk
Example metrics
- Late-order risk
- Supplier risk
- Shortage risk
- Single-source exposure
What it helps answer Which exceptions need action before they escalate?
Most supply chain analytics systems work better with three metric layers:
- Outcome metrics: Service level, total cost, on-time in-full, customer promise attainment, revenue at risk.
- Driver metrics: Inventory position, supplier lead time, production capacity, warehouse throughput, logistics cycle time.
- Diagnostic metrics: SKU, material, supplier, plant, route, order, region, customer segment, delay reason, owner.
If you need a dashboard-specific metric path, use a supply chain metrics dashboard or supply chain KPI dashboard as a starting point. Keep the KPI layer small, then place detailed operational fields behind filters and drill-downs.
Examples and Templates
Examples make supply chain analytics easier to design because they turn broad ideas into specific questions. The demo cards below come from the Gallery demo file and match supply chain analytics topics such as control tower visibility, inventory movement, warehouse logistics, procurement, demand forecasting, task duration, and executive supply chain review.
Use these examples as learning prompts. Before copying a layout, ask: Who will use this view? What decision should it support? Which metric definitions must stay consistent across teams?
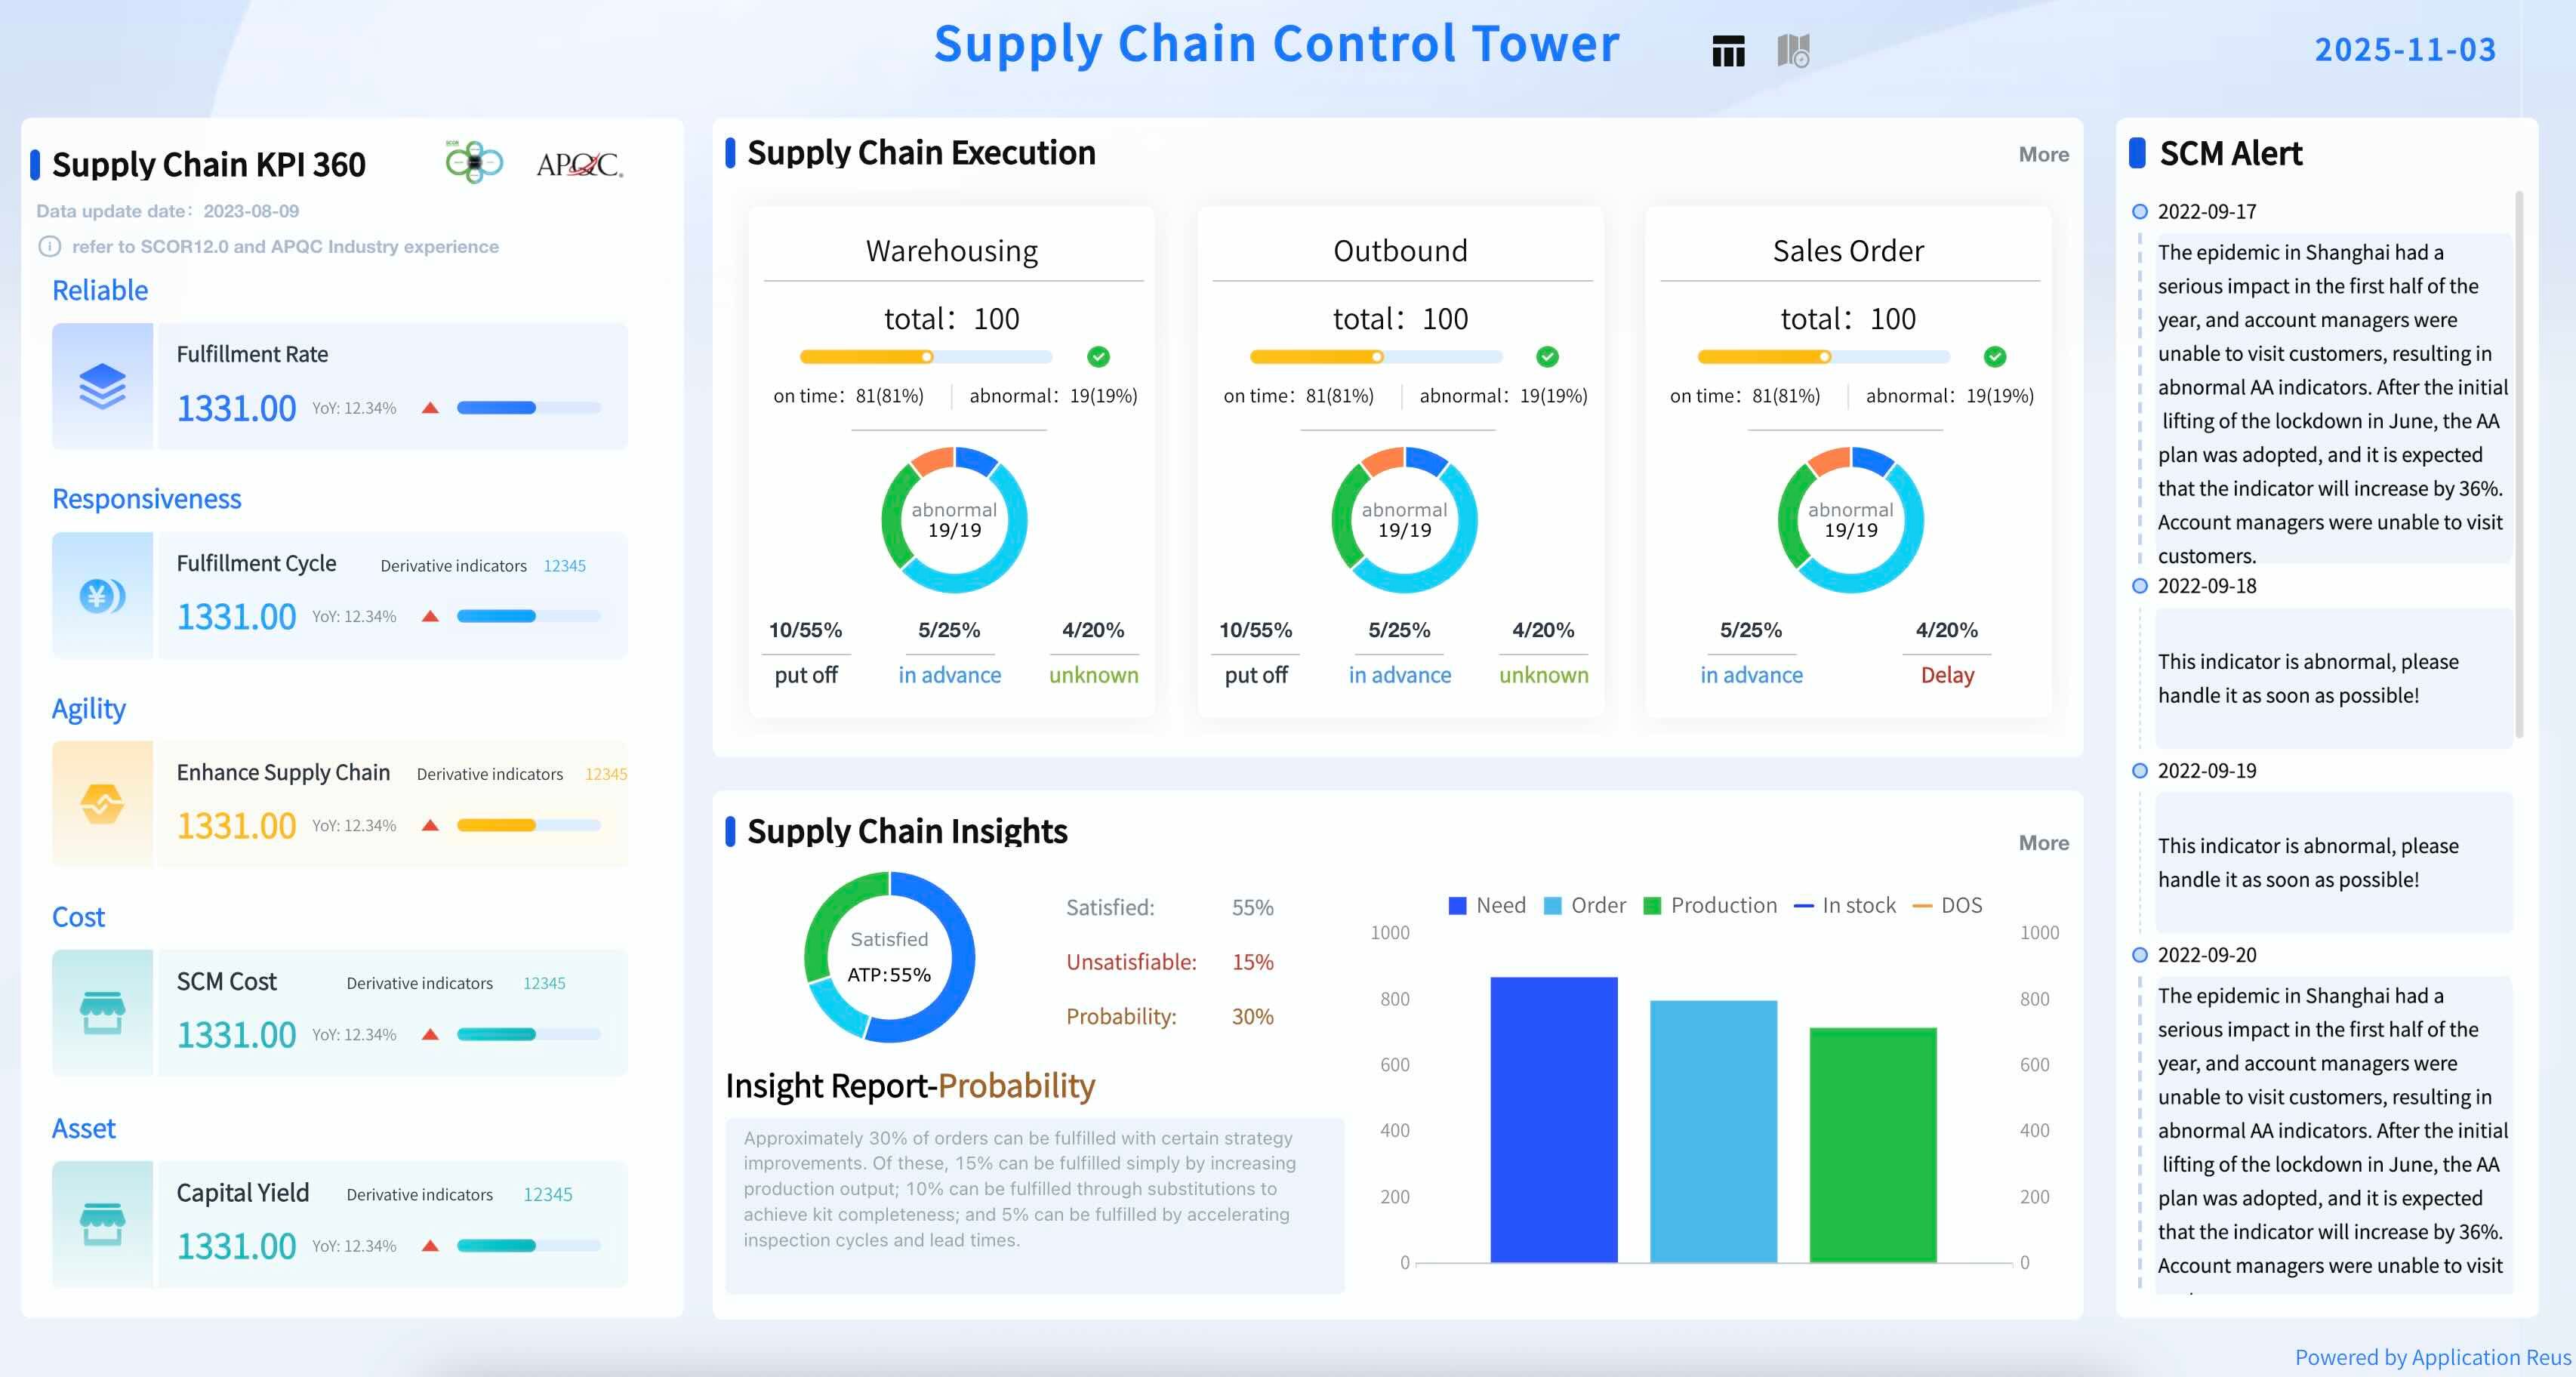
Supply Chain Control Tower
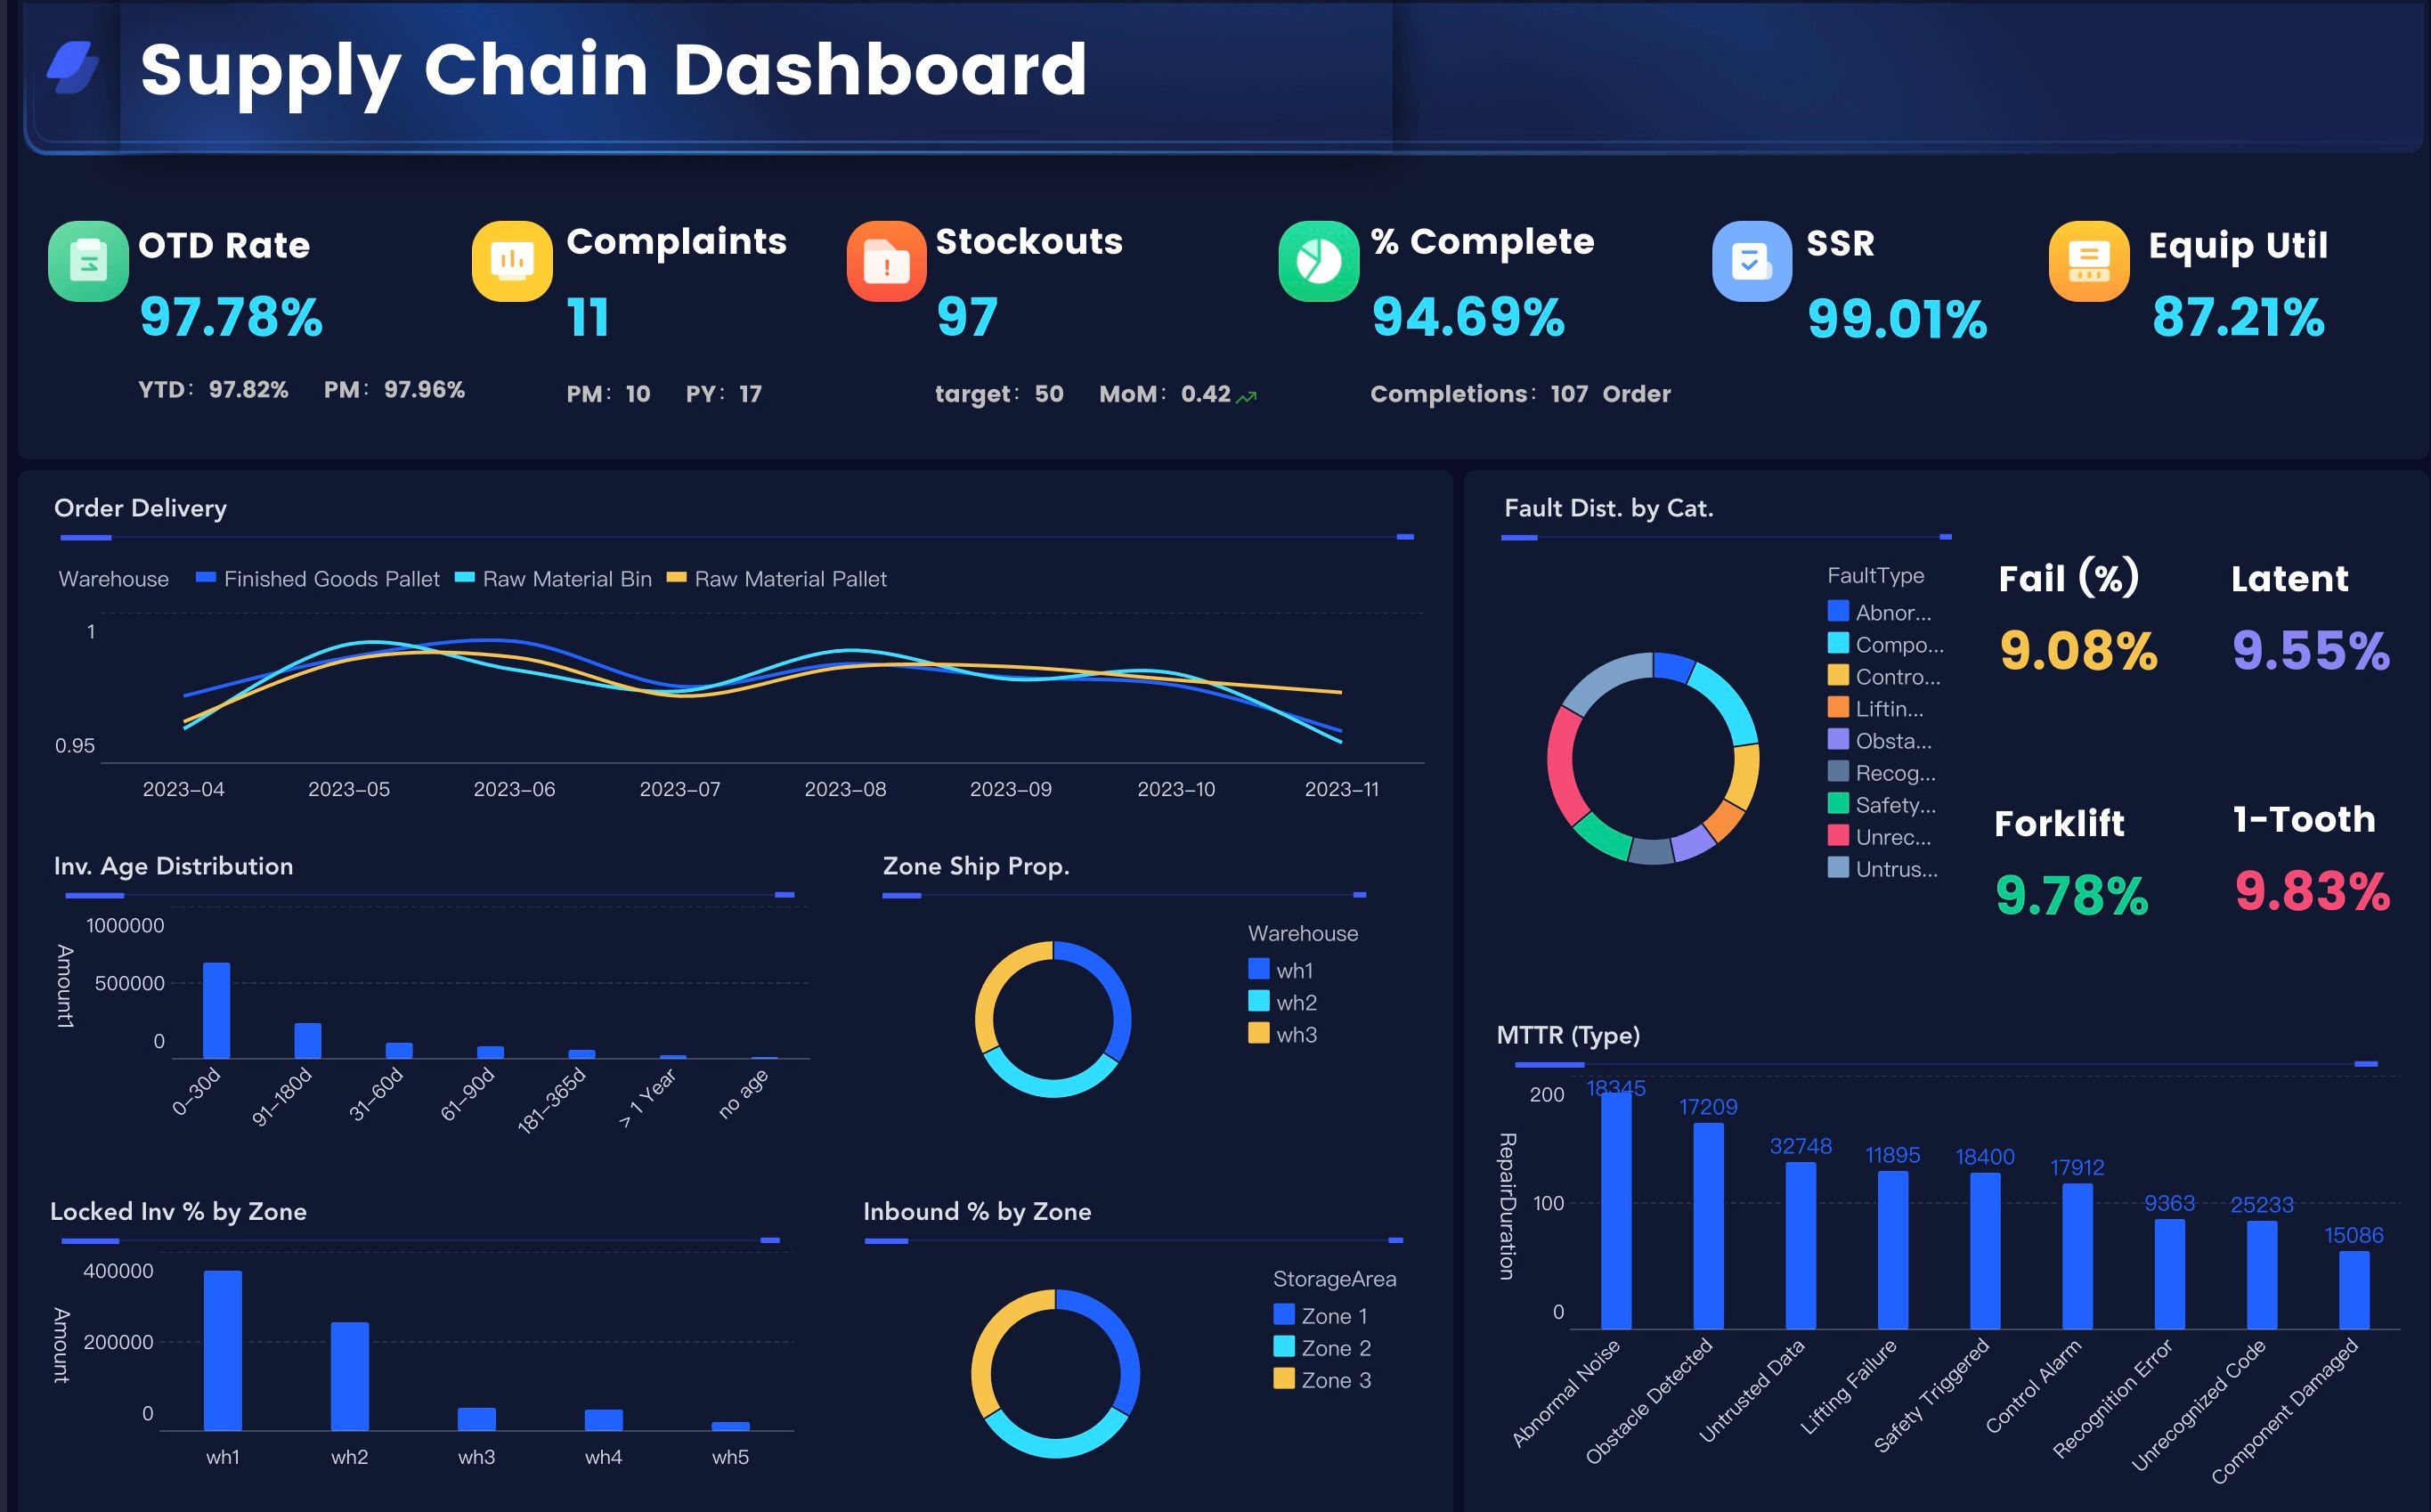
Manufacturing Supply Chain Executive Dashboard
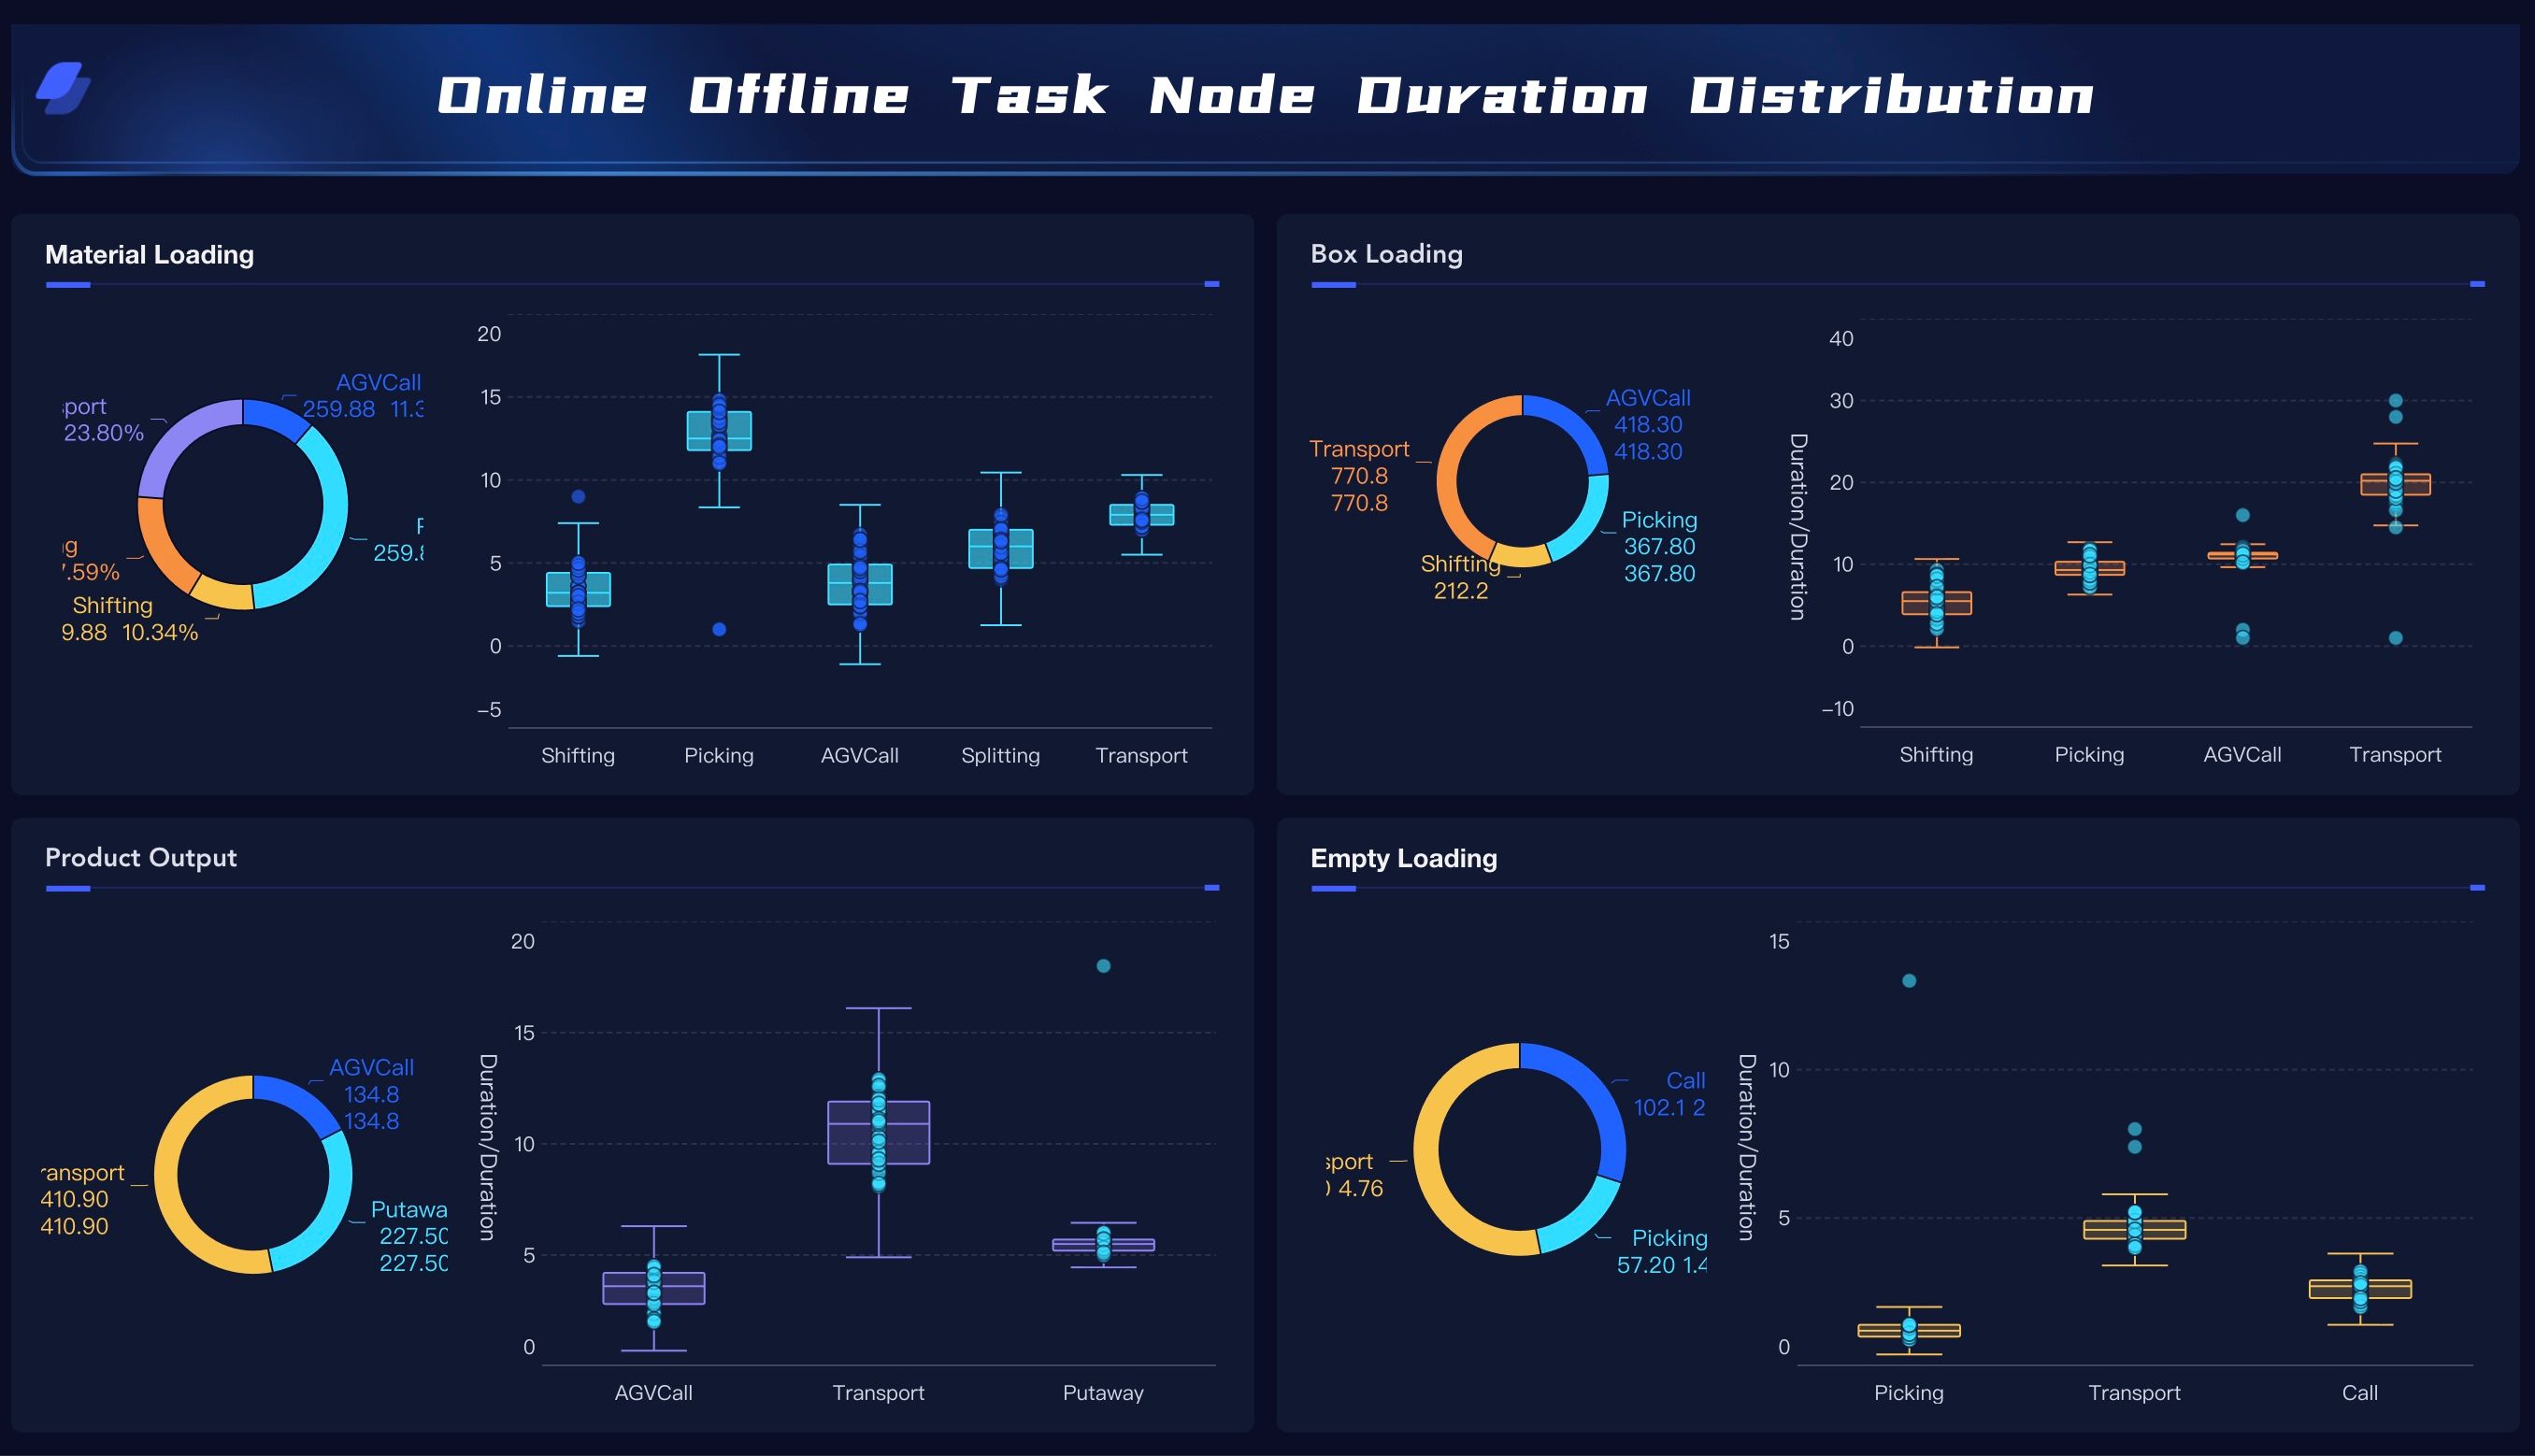
Supply Chain Task Node Duration Analysis
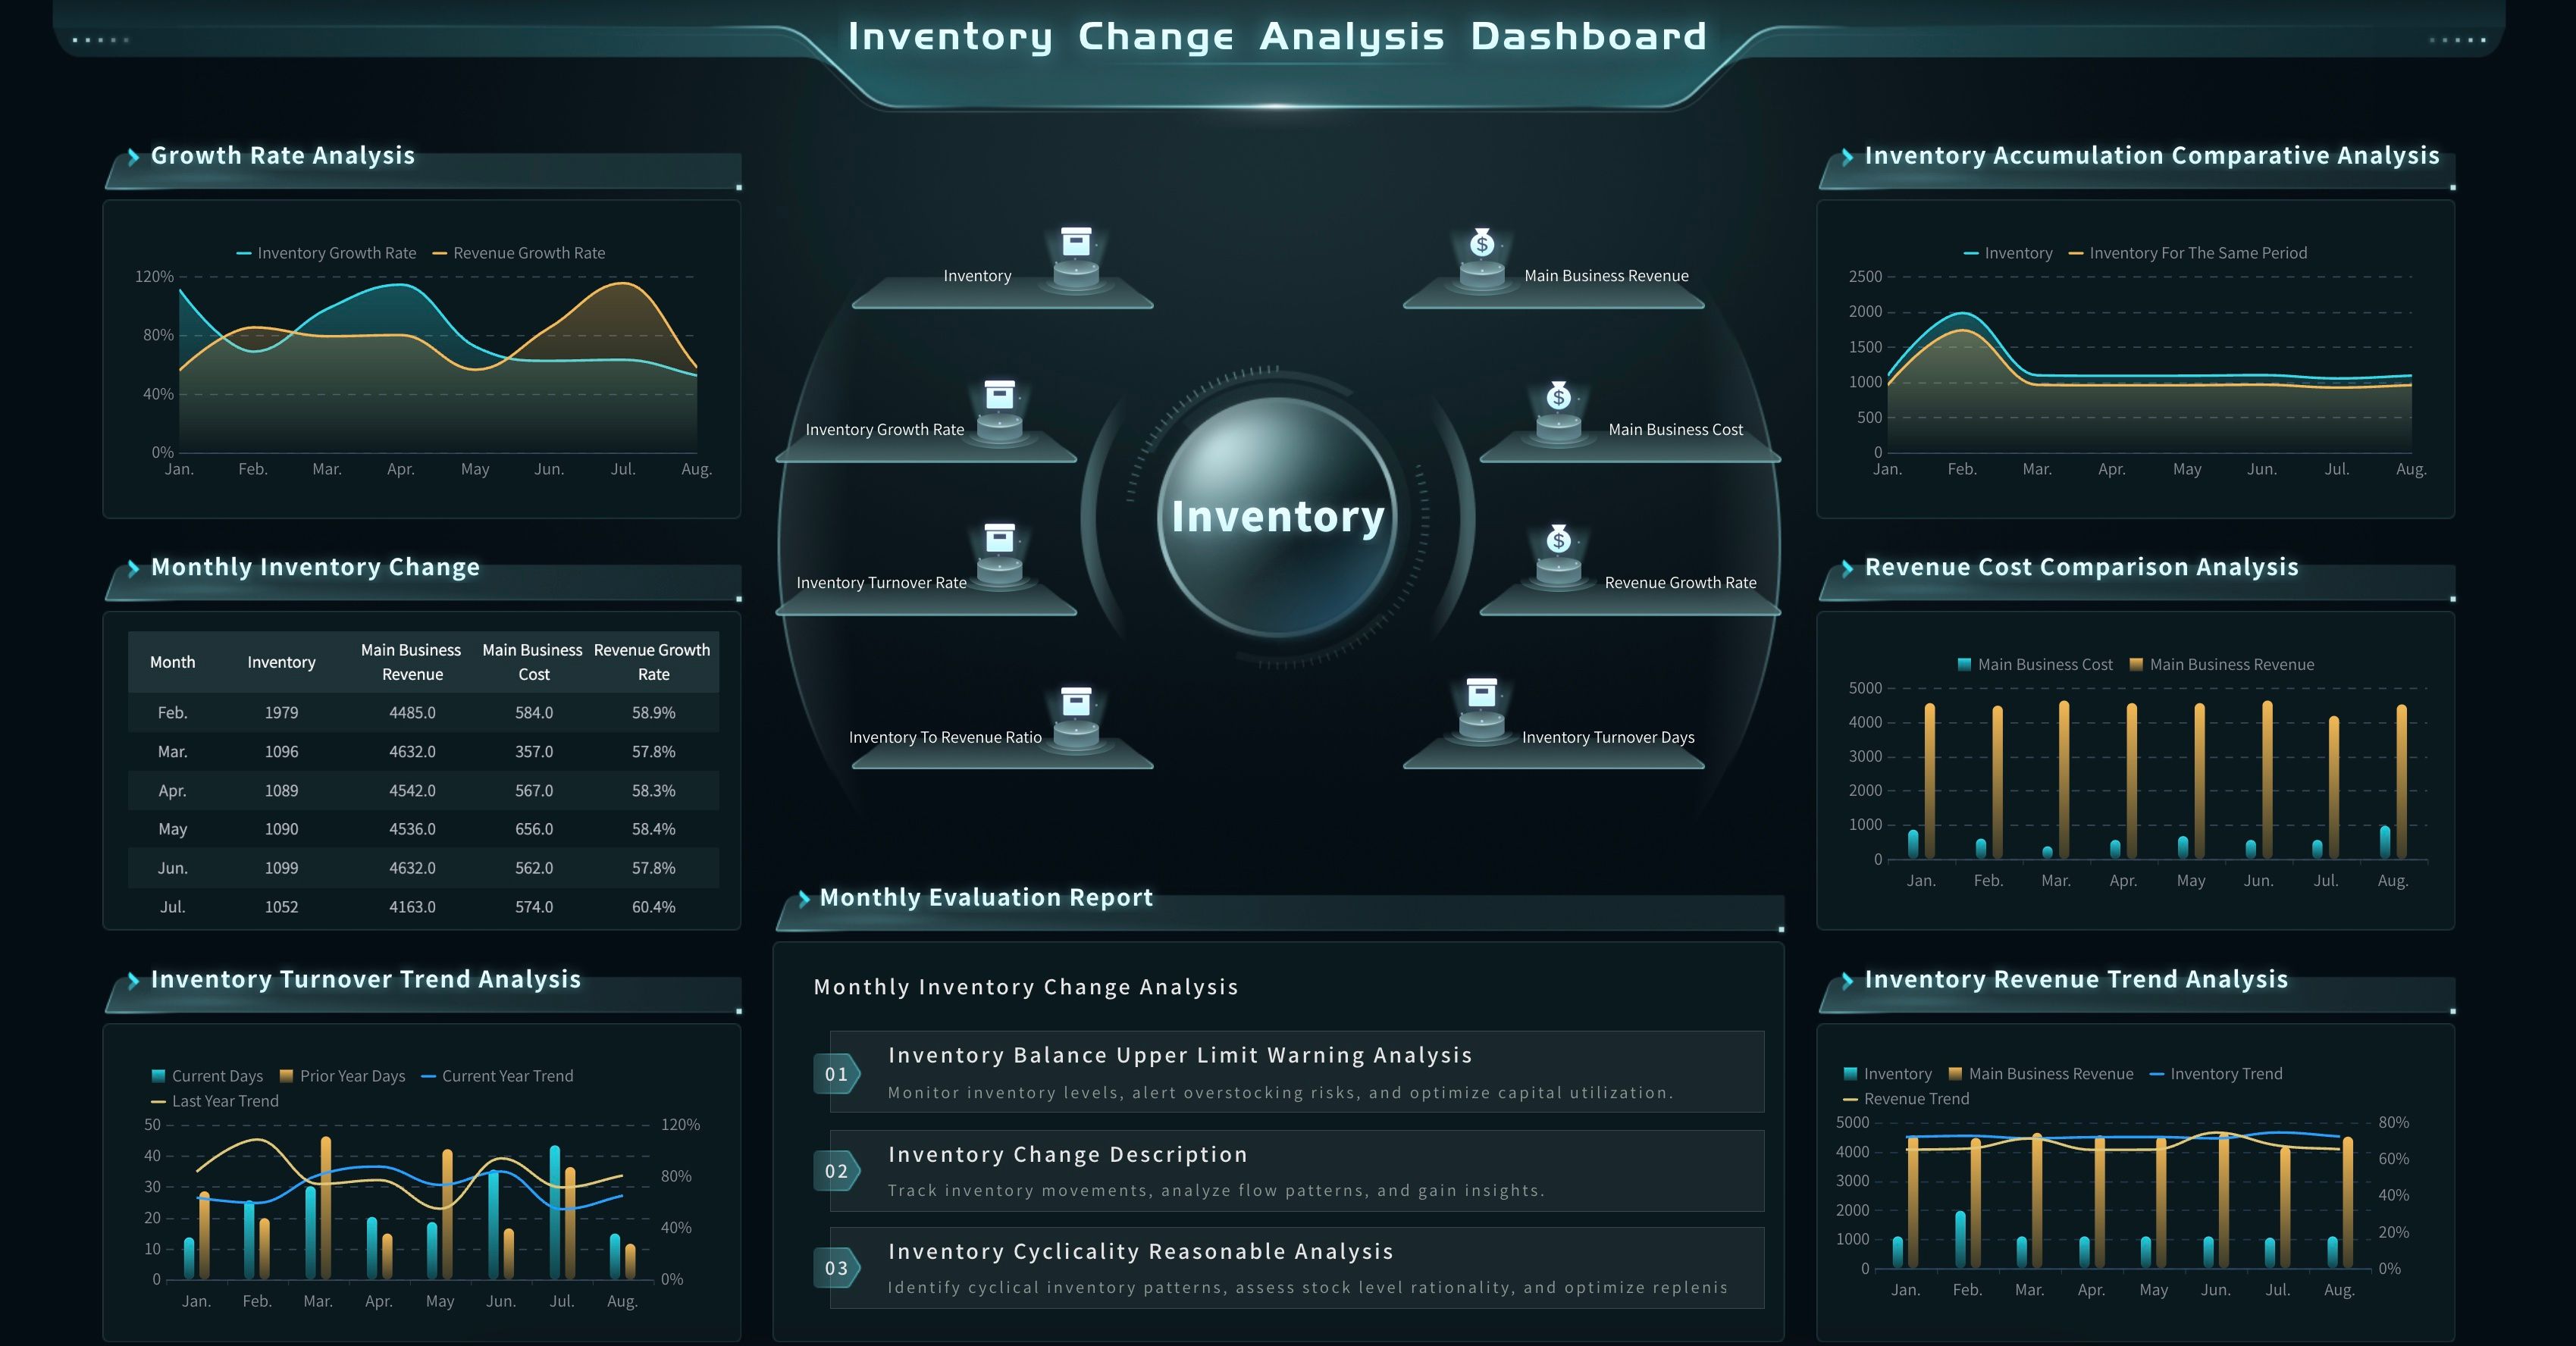
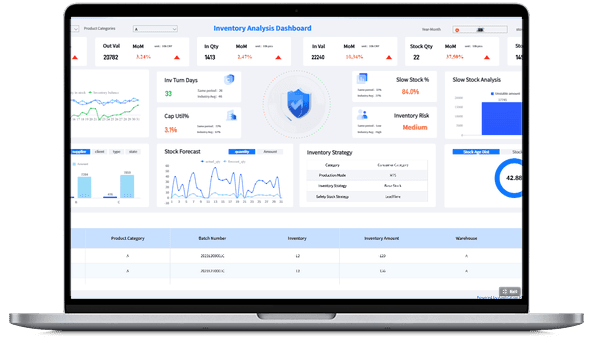
Inventory Movement Analysis Dashboard
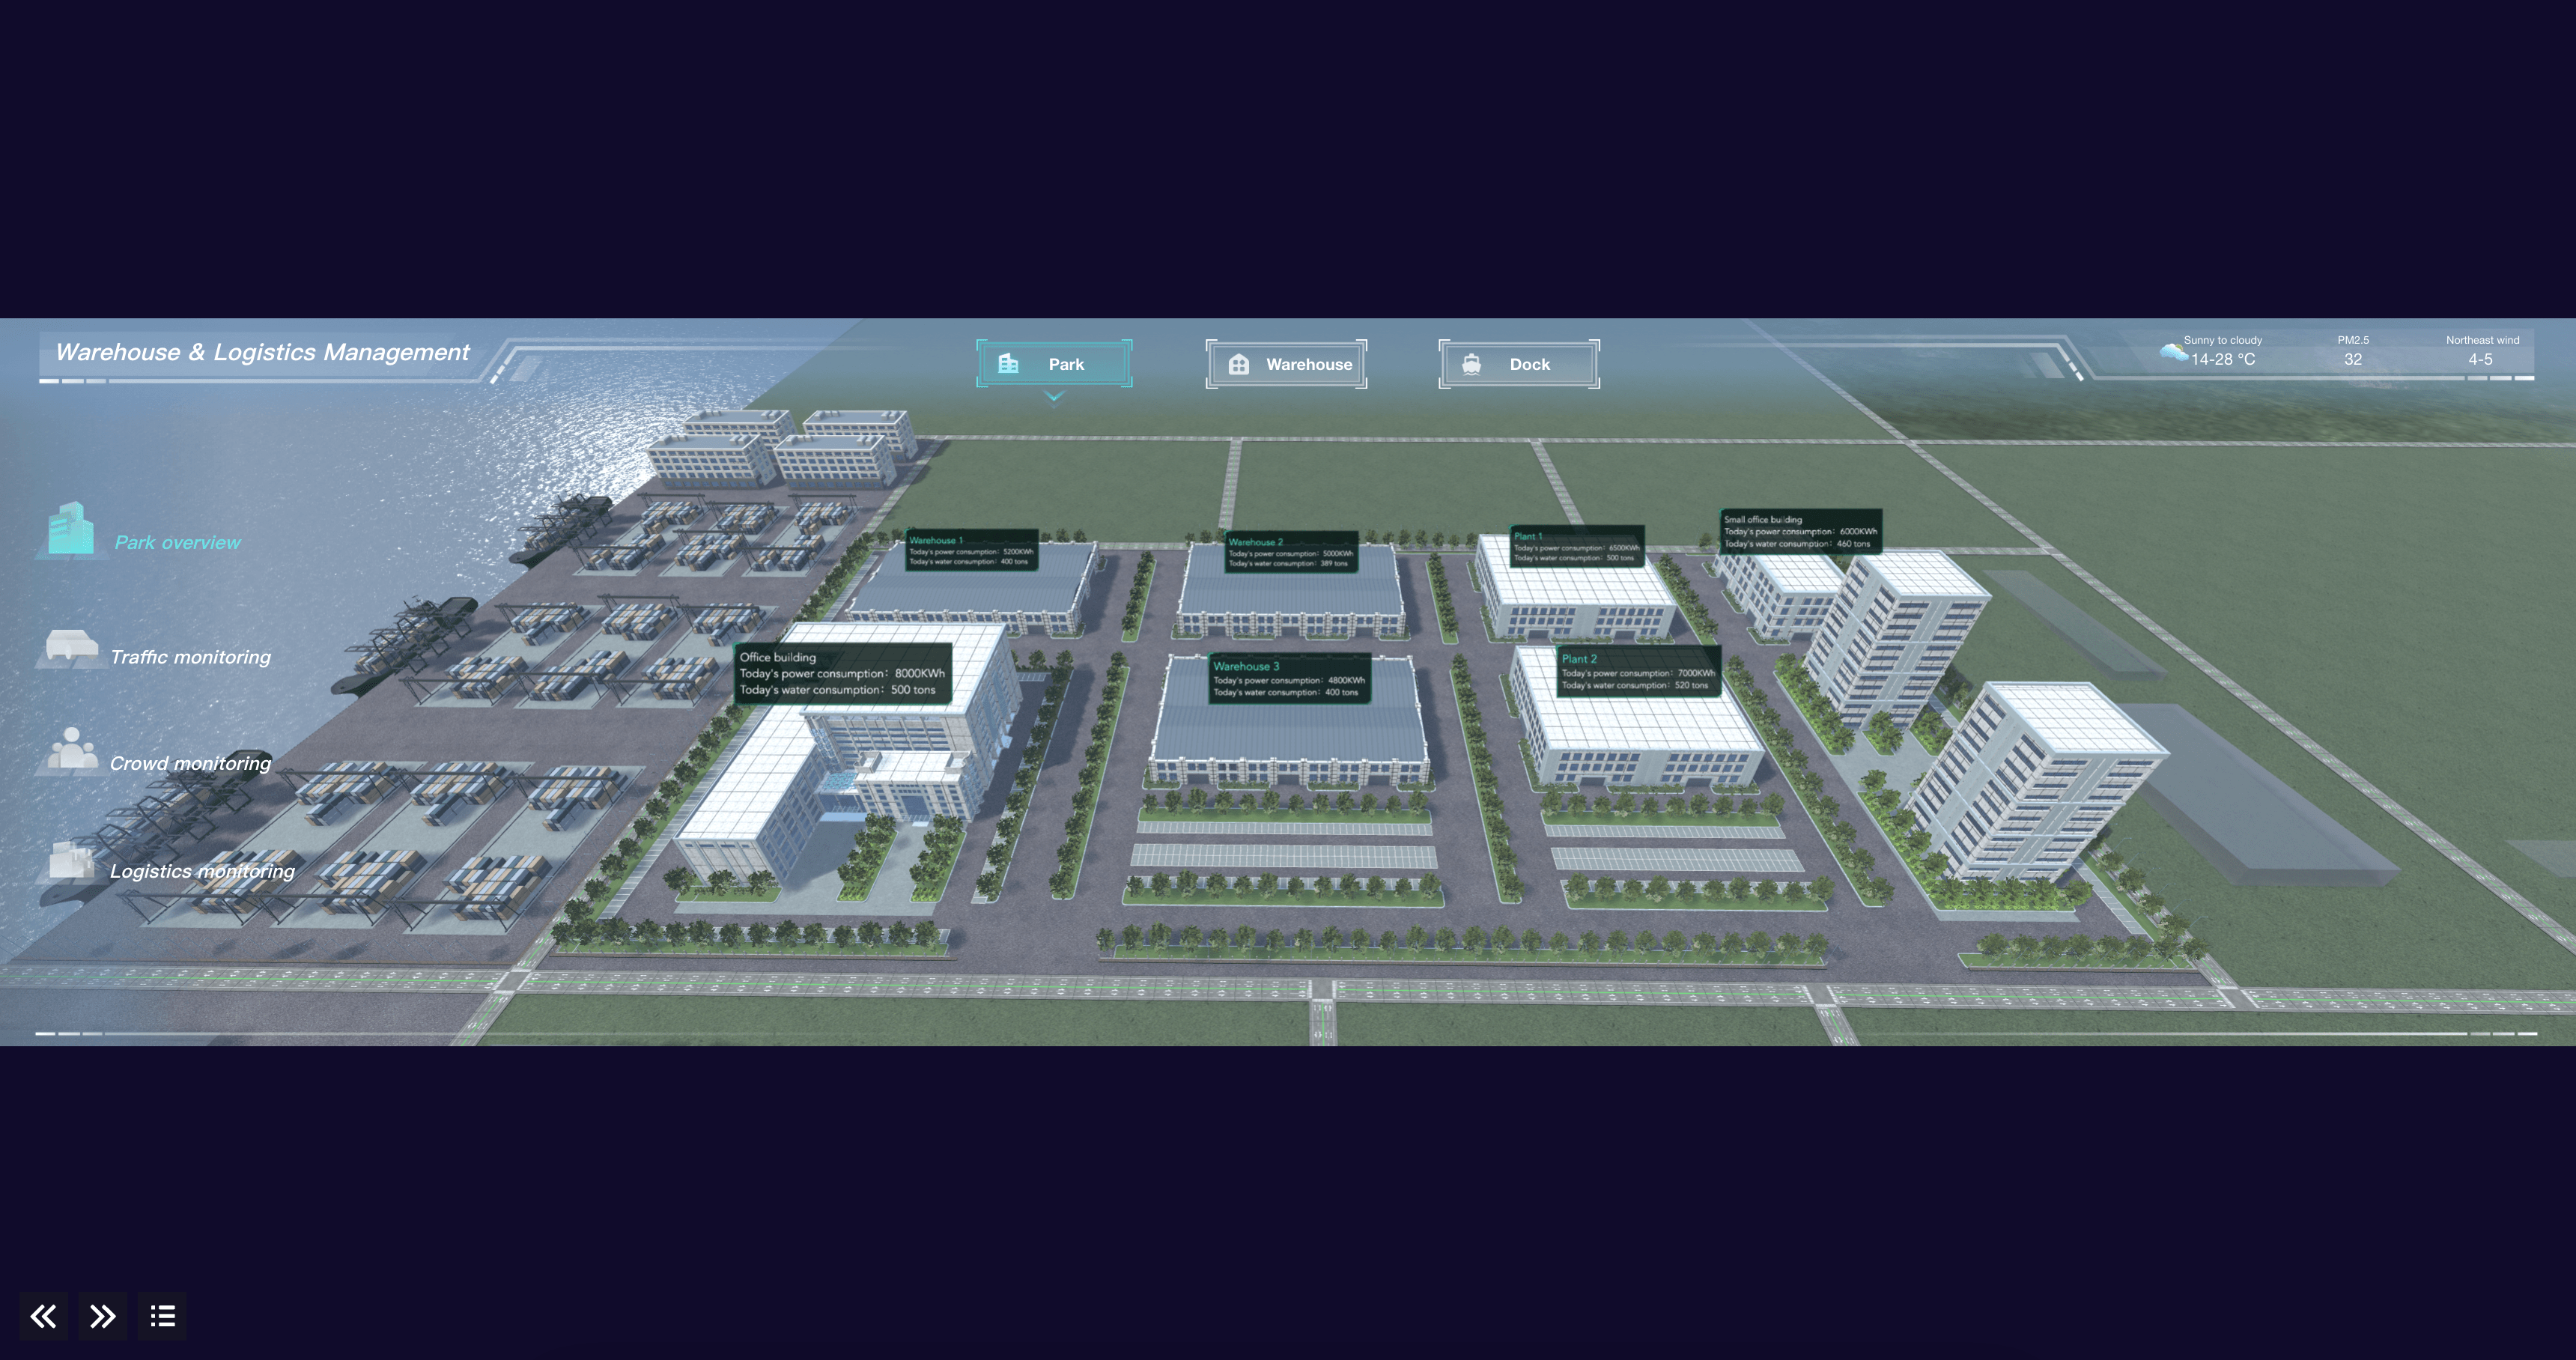
Warehouse Logistics Management
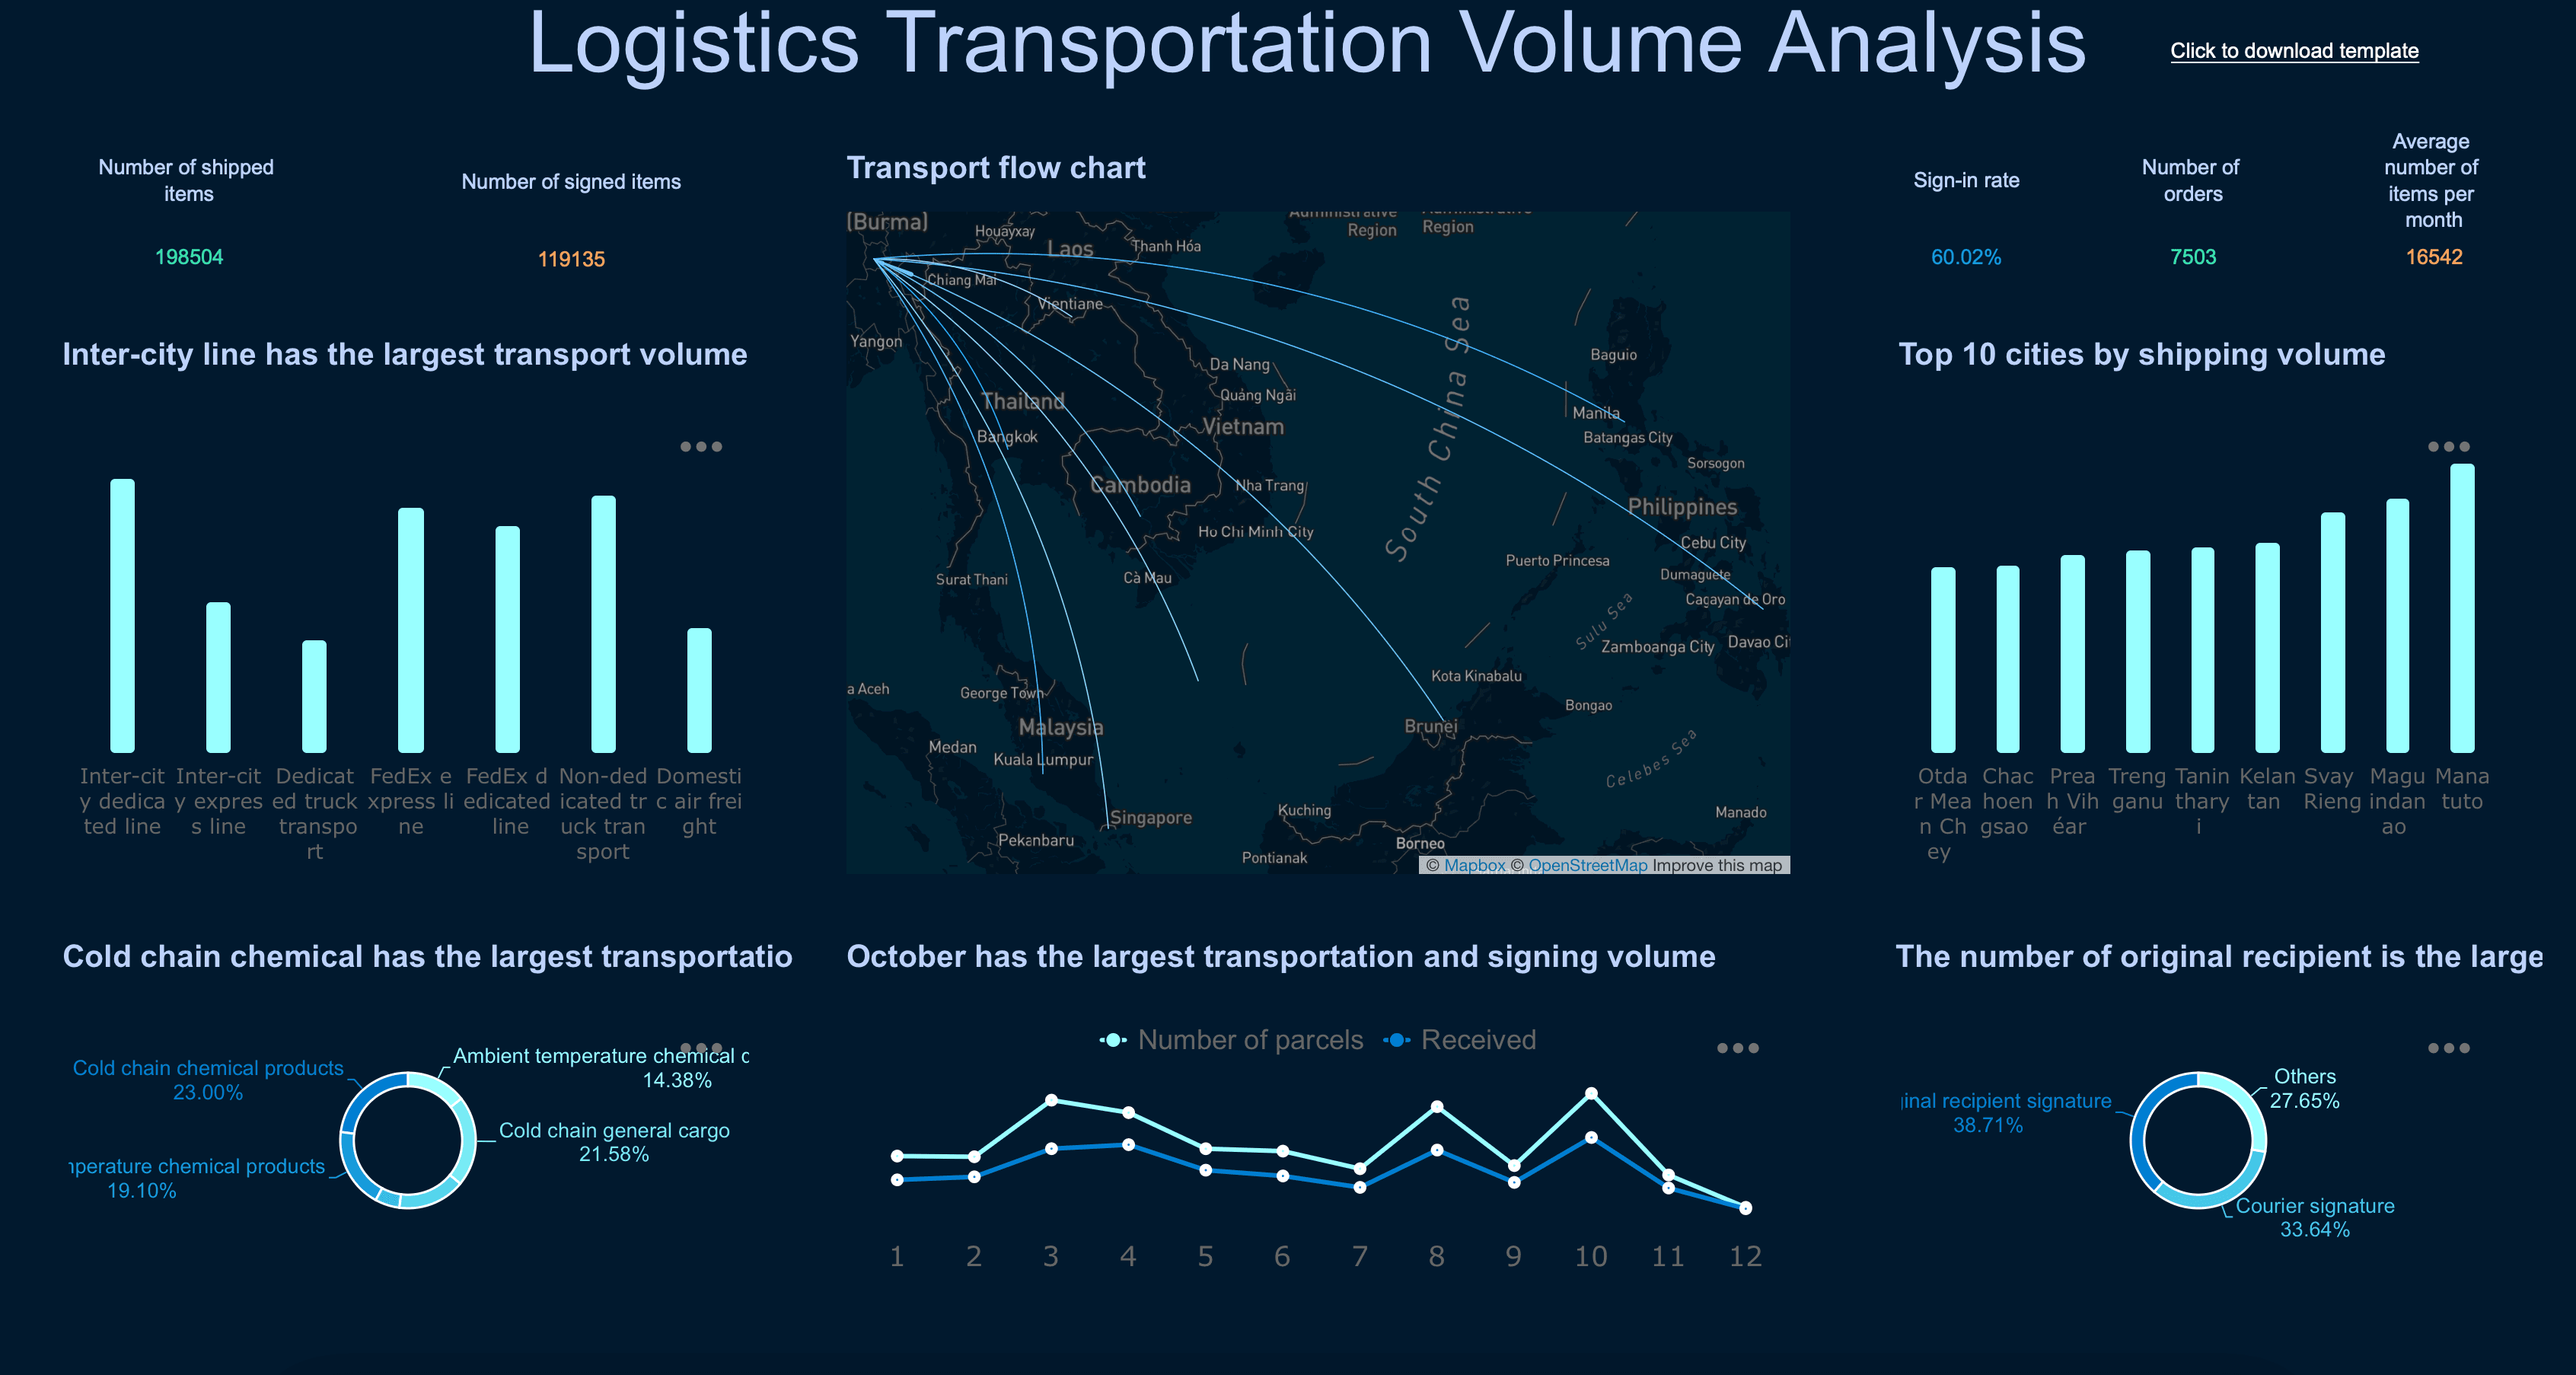
Logistics Data Analytics
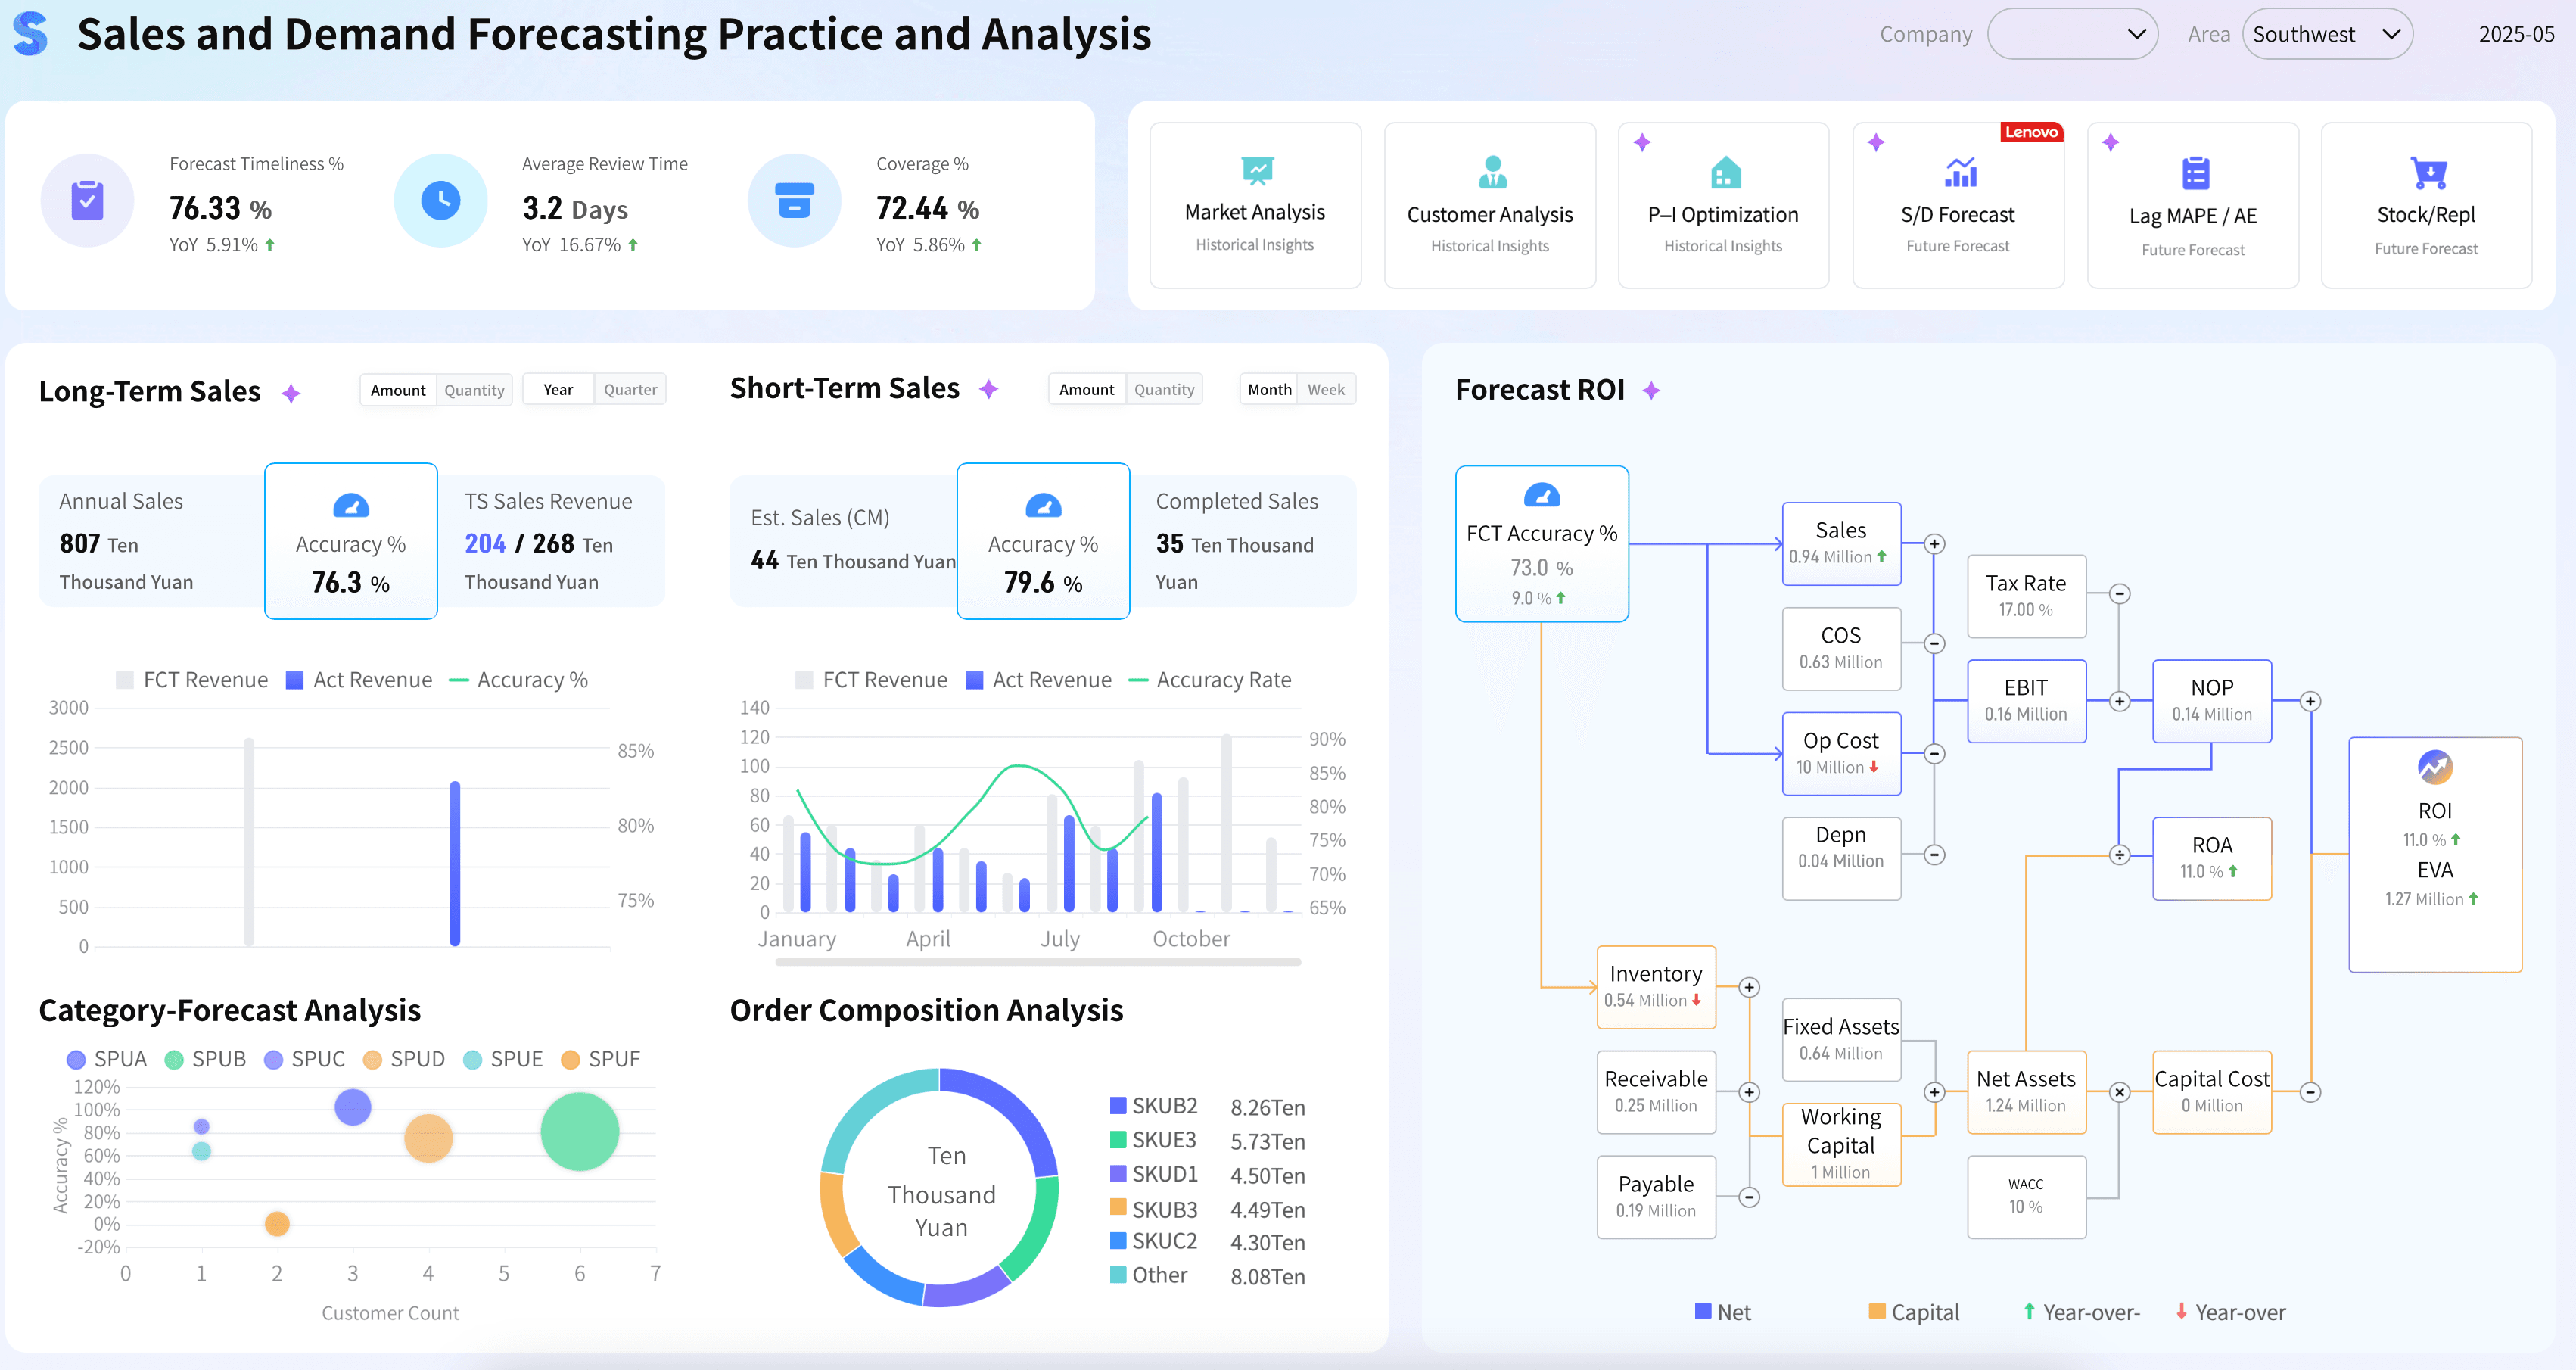
Sales Demand Forecasting With AI
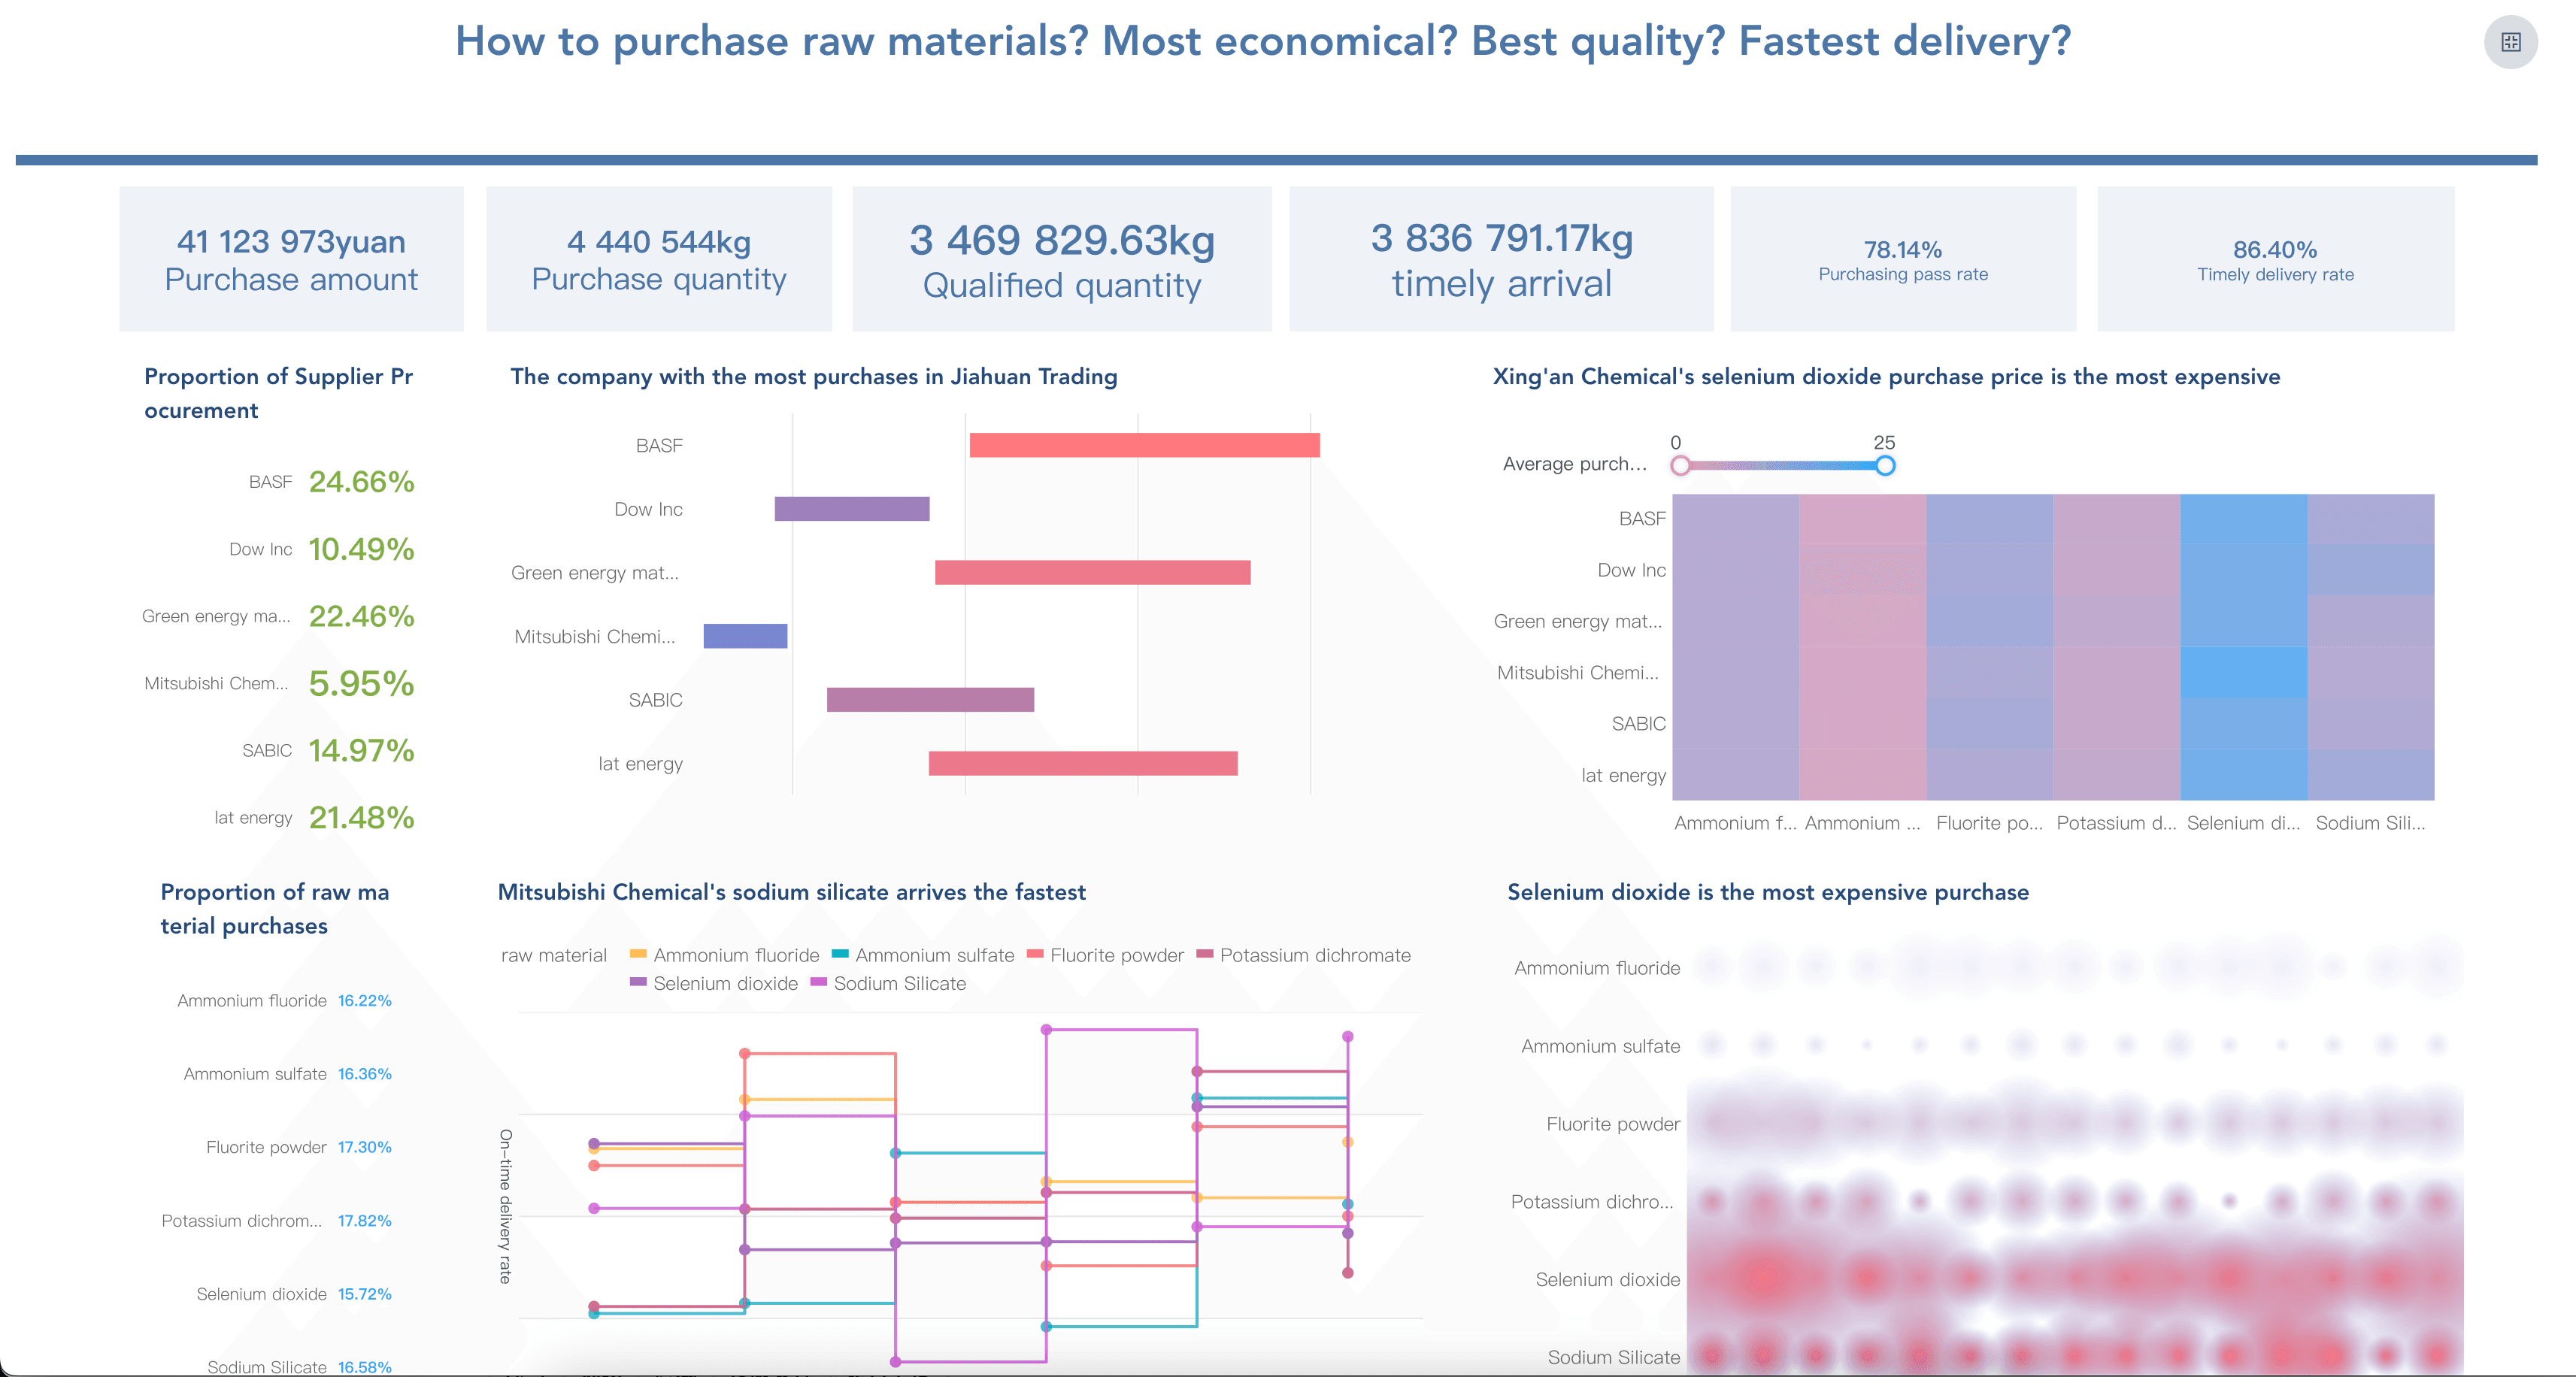
Procurement Dashboard
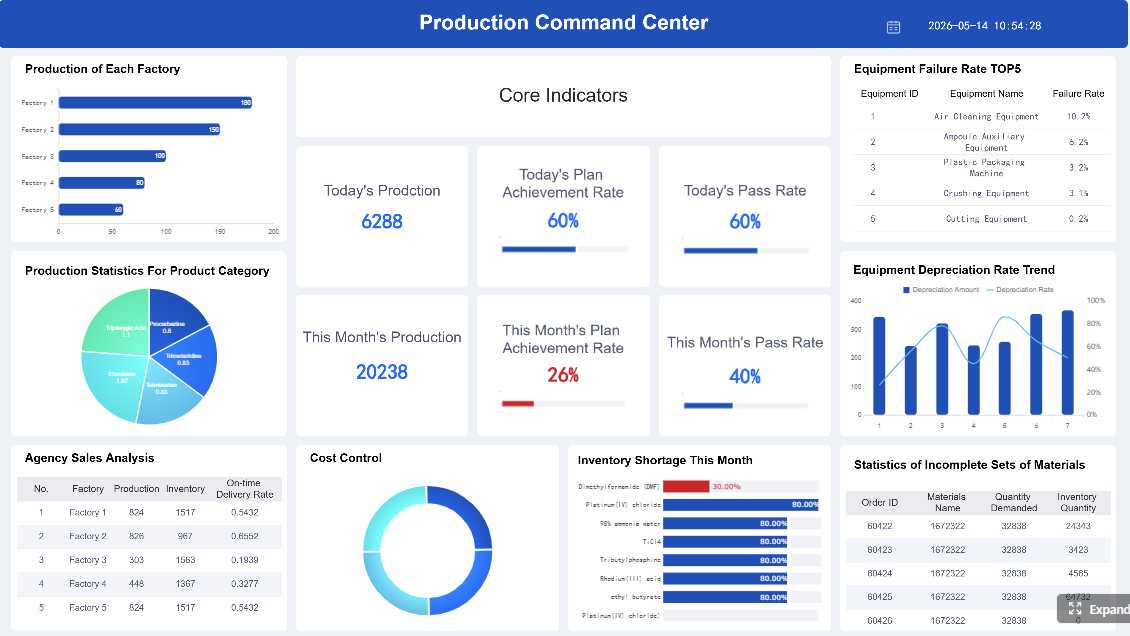
Production Monitoring Dashboard
Data Sources
Supply chain analytics depends on connected data. Many projects fail because the visual layer looks complete while the data layer remains fragmented, duplicated, or unclear.
Common supply chain analytics data sources include:
ERP
Example data
- Orders
- Purchasing
- Inventory
- Finance
- Master data
Common analytics use Cross-functional performance and cost analysis.
WMS
Example data
- Inbound
- Outbound
- Picking
- Packing
- Warehouse location
Common analytics use Warehouse throughput and inventory accuracy.
TMS
Example data
- Shipment
- Carrier
- Route
- Freight cost
- Delivery status
Common analytics use Logistics cost and delivery performance.
MES
Example data
- Production orders
- Line status
- Downtime
- Yield
- Quality
Common analytics use Manufacturing capacity and production progress.
CRM or Order Management
Example data
- Customer orders
- Promise dates
- Service requests
Common analytics use Customer promise and revenue-at-risk analysis.
Supplier Portals
Example data
- ASN
- Delivery date
- Quality issue
- Supplier response
Common analytics use Supplier performance and shortage risk.
Spreadsheets
Example data
- Manual plans
- Exception notes
- Local adjustments
Common analytics use Temporary inputs and planning assumptions.
External Data
Example data
- Weather
- Port congestion
- Commodity prices
- Market demand
Common analytics use Risk context and scenario planning.
Before building charts, define the business terms. "On-time delivery," "available inventory," "late order," "supplier lead time," "expedited shipment," and "revenue at risk" can mean different things in different systems. If the definitions are not governed, the analytics output will be debated instead of used.
This is also where business intelligence, data dashboard, and analytics dashboard concepts become practical. The dashboard is only as useful as the data model, metric dictionary, permission rules, and refresh rhythm behind it.
Supply Chain Analytics Workflow
Supply chain analytics becomes useful when the workflow is repeatable. The first version does not need to solve every problem. It should solve one recurring decision well.
Use this workflow as a practical build path:
- Choose one decision. Start with a clear question, such as "Which customer orders are at risk this week?" or "Which suppliers are causing the largest lead-time variance?"
- Define the audience. Decide whether the view is for executives, supply chain managers, procurement, warehouse teams, logistics teams, or analysts.
- Map the data sources. List the systems, tables, fields, refresh frequency, owners, and known data quality issues.
- Standardize KPI definitions. Write formulas for on-time delivery, fill rate, inventory turnover, supplier lead time, forecast accuracy, and cost variance.
- Design the visual path. Start with the summary, then add trends, breakdowns, exception lists, and drill-downs.
- Add commentary and context. Explain what changed, why it matters, what may have caused it, and what should happen next.
- Assign owners. Every exception should have a responsible person, expected action, and review date.
- Review and improve. Remove charts that do not support decisions. Add fields only when users need them to act.
This workflow also helps teams decide when to use ad hoc reporting, when to use scheduled reports, and when to build a governed dashboard. If a question happens once, an ad hoc report may be enough. If the same question appears every week, it belongs in the analytics system.
Challenges
Supply chain analytics projects often struggle for practical reasons. The issue is rarely that teams do not care about data. The issue is that supply chain data is distributed across many systems and owners.
Common challenges include:
- Fragmented systems: ERP, WMS, TMS, MES, supplier portals, and spreadsheets may not share the same identifiers.
- Inconsistent master data: SKU, material, supplier, warehouse, customer, and route names may differ across systems.
- Delayed updates: Some data refreshes daily, while operations may need timely or near real-time visibility.
- Unclear metric definitions: Teams may calculate on-time delivery, inventory availability, or supplier performance differently.
- Too many charts: A dashboard that tries to show everything can hide the few issues that need action.
- Weak ownership: Alerts lose value when no one owns the follow-up.
- Poor trust in AI output: AI-generated explanations can mislead users if they are not grounded in governed data, source traceability, and human review.
The fix is not just better visuals. A trusted supply chain analytics system needs data ownership, metric governance, role-based permissions, refresh rules, exception workflows, and review habits.
For teams working on broader supply chain transformation, analytics should be treated as an operating capability. It connects daily execution, management reporting, risk review, and continuous improvement.
Supply Chain Analytics With FineReport + Dora
After the supply chain analytics structure is clear, FineReport + Dora can support a practical learning path from governed reporting to AI-assisted follow-up.
FineReport can support the structured reporting and operational cockpit layer:
- Connect supply chain data from ERP, WMS, TMS, MES, databases, APIs, and spreadsheets.
- Build operational dashboards, formatted reports, mobile reports, and management cockpits.
- Schedule recurring reports for daily operations, weekly reviews, and monthly management meetings.
- Support role-based permissions so different teams see the right supply chain data.
- Preserve reusable report templates for procurement, inventory, warehouse, logistics, and executive review.
Dora adds the AI action layer above trusted FineReport assets. As a data agent, Dora can help users ask natural-language questions, search existing reports and dashboards, generate structured briefings, summarize exceptions, push scheduled updates, and follow up with responsible owners. Dora should not replace supply chain planners, analysts, or managers. It works best when it operates on governed metrics, business rules, permissions, reusable Skills, and human review.
For supply chain analytics, two useful Dora digital employees could be:
- Supply Chain Risk Analyst: Monitors late orders, material shortages, supplier delays, inventory gaps, and logistics exceptions from trusted FineReport assets.
- Inventory Briefing Secretary: Generates scheduled inventory summaries, flags abnormal movement, prepares stockout and excess-stock notes, and pushes questions to the right owner.
Example chat-style prompts:
- "Show me this week's delivery risk by order, material shortage, production delay, logistics status, and responsible department."
- "Generate a supply chain analytics briefing for the executive team. Include service level, inventory risk, supplier delay, logistics cost, and the top three follow-up items."
- "Explain why inventory turnover dropped this month. Compare demand, inbound delays, slow-moving SKUs, warehouse location, and sales order changes."
- "Create a dashboard-style view of supplier performance by on-time delivery, defect rate, purchase price variance, and open exception count."
A closed-loop AI workflow could look like this:
- Retrieve trusted data: Dora reads configured FineReport reports, dashboard assets, KPI definitions, source mappings, and permission rules.
- Detect exceptions: It identifies late orders, shortage risks, supplier delays, abnormal inventory movement, or logistics cost spikes.
- Explain likely drivers: It compares supplier, SKU, plant, warehouse, route, customer, and time-period dimensions to suggest where users should investigate.
- Generate a briefing: It prepares a chart, summary, exception table, and follow-up questions for human review.
- Push to owners: It sends the relevant issue list to procurement, planning, warehouse, logistics, or production owners.
- Follow up and summarize: It tracks unresolved questions, captures human feedback, and prepares a cleaner update for the next review.
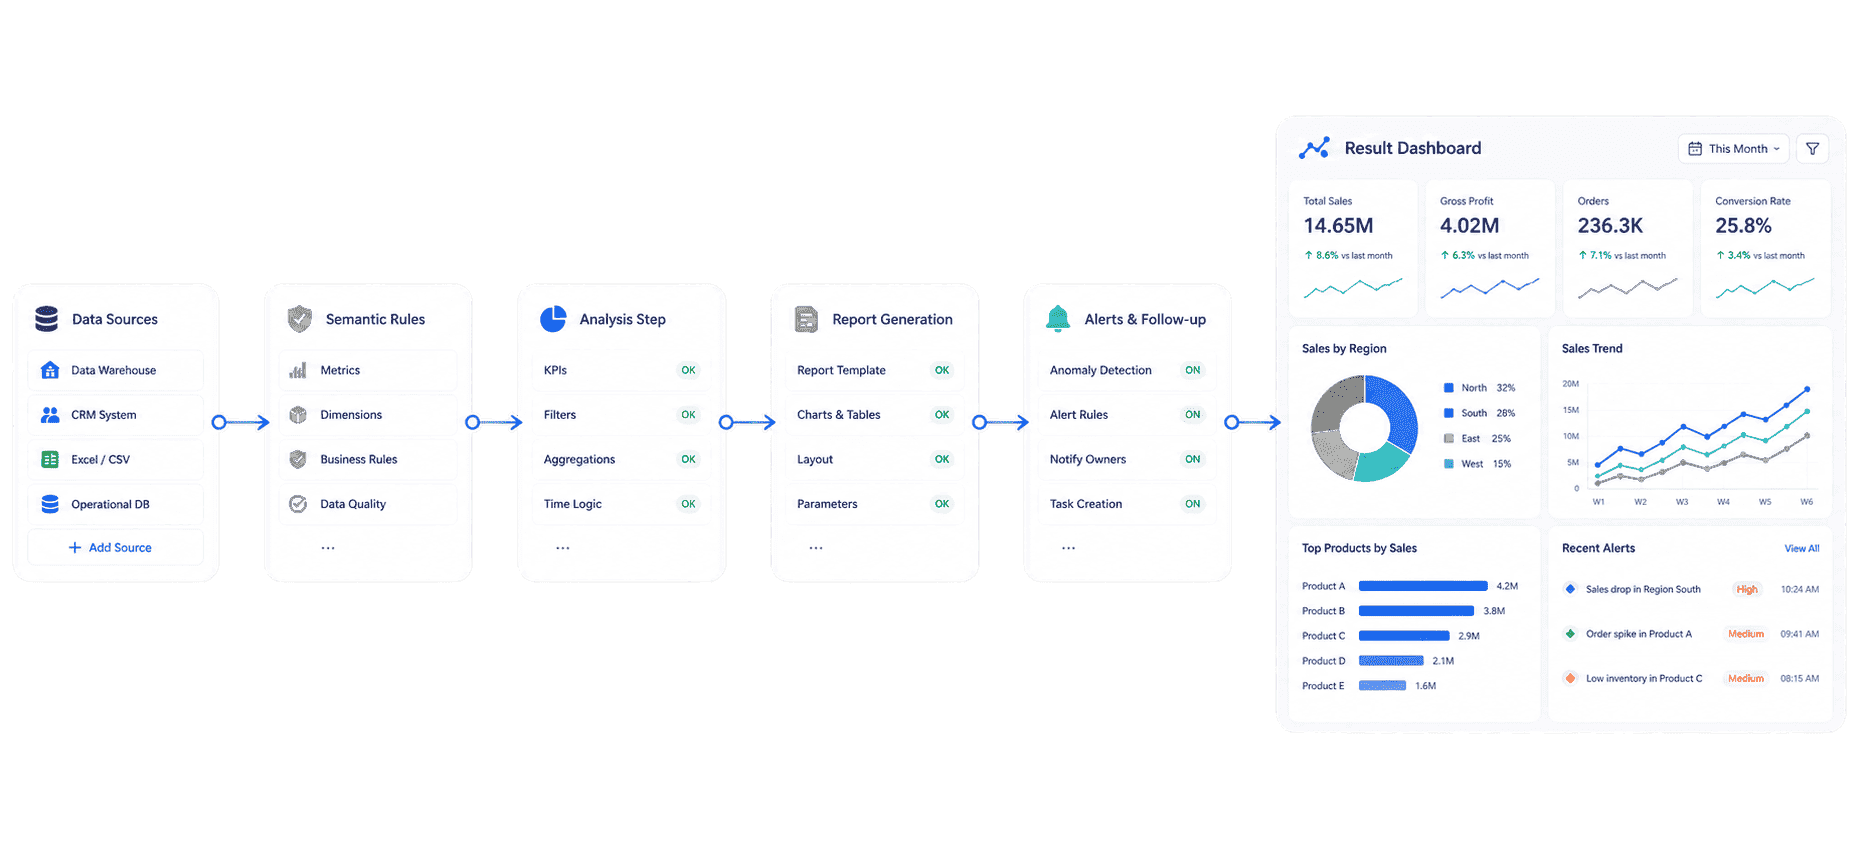 Dora's Workflow
The trust layer matters. Dora should respect user permissions, agent permissions, BI data permissions, metric definitions, source traceability, and human approval. The point is not to let AI invent supply chain decisions. The point is to reduce the manual work around finding the right report, explaining variance, drafting first summaries, and keeping owners aligned.
This is the practical reason the scenario can land in a real enterprise: supply chain analytics is recurring, cross-functional, exception-heavy work. The useful package is scenario + product + service: choose one high-value workflow, connect the right FineReport assets, configure KPI definitions and permission rules, build reusable Dora Skills, and help teams adopt a review rhythm.
For IT teams, this shifts work from manually building every one-off report to maintaining data connections, semantic rules, permissions, and reusable workflows. For business users, it reduces the wait between a supply chain question and a useful first analysis. For executives, it makes the review clearer: what changed, why it matters, who owns the next step, and what will be checked next.
Supply chain analytics prompts for Dora
The best prompts are specific. They define the time period, metric, dimension, comparison, and expected output.
For executives:
- "Summarize this week's supply chain analytics risks. Show service level, inventory exposure, late orders, supplier delays, logistics cost variance, and the top five follow-up owners."
- "Compare this month with last month. Which supply chain issues affected revenue at risk, customer promise date, and operating cost?"
For supply chain managers:
- "Find orders at risk in the next seven days. Group them by material shortage, production delay, warehouse backlog, carrier issue, and customer priority."
- "Explain why on-time in-full declined in the East region. Compare supplier lead time, warehouse throughput, route delay, and stockout events."
For procurement teams:
- "Rank suppliers by late delivery, quality defect rate, purchase price variance, and open shortage count. Show which suppliers need review this week."
- "Generate a supplier performance briefing for the electronics category. Include trends, exceptions, and recommended questions for the supplier review meeting."
For inventory teams:
- "List SKUs with high stockout risk and high customer demand. Include available inventory, open purchase orders, expected inbound date, and recent demand change."
- "Find slow-moving inventory with high carrying cost. Compare warehouse, category, age, forecast, and last movement date."
For logistics teams:
- "Show routes with abnormal freight cost or delivery delay this month. Compare carrier, region, shipment type, distance, and delay reason."
- "Create a logistics analytics summary for delayed shipments, including carrier performance, warehouse handoff time, and customer impact."
Guardrails for AI-assisted supply chain analytics
Dora should be used as a governed AI data agent, not as an uncontrolled decision maker. Keep these rules visible in the project:
- Use approved data assets: Dora should answer from configured FineReport reports, dashboards, datasets, and metric definitions.
- Respect permissions: Users should only see data they are allowed to access, and agent permissions should be managed separately from user permissions.
- Show source context: Important answers should point back to the report, metric, filter, period, and source field used.
- Separate explanation from decision: Dora can detect, explain, suggest, push, and follow up. Humans still approve supplier changes, production priority, inventory transfer, or customer communication.
- Handle uncertainty clearly: If data is missing, stale, or inconsistent, the AI output should say so instead of hiding the limitation.
- Reuse Skills for recurring work: Repeatable supply chain tasks should become controlled Skills, not one-off prompt experiments.
This makes FineReport + Dora useful as learning material: teams can first understand the analytics method, then see how governed reports and AI agents turn the method into a repeatable operating workflow.
Supply Chain Analytics Hub
This supply chain analytics guide should work as one spoke in a broader supply chain and dashboard learning path. Use the related resources below to deepen specific parts of the topic:
- Use the glossary entry for supply chain analytics when you need a shorter definition before reading the full guide.
- Start with supply chain dashboard examples when you need visual inspiration for operational views.
- Review supply chain control tower dashboard concepts when the main goal is end-to-end visibility and exception handling.
- Compare supply chain dashboard software if you are evaluating tools for governed dashboards and reports.
- Explore supply chain visibility tools when order, shipment, supplier, and inventory visibility are the central pain points.
- Use supply chain management software comparison when analytics must connect with planning, execution, procurement, and logistics systems.
- Study supply chain execution when the focus is day-to-day fulfillment, production, warehouse, and transportation work.
- Pair this page with inventory management dashboard, operational dashboard, and executive dashboard resources for role-specific dashboard learning.
The main idea is simple: use supply chain analytics to turn scattered operational data into shared learning. A dashboard can show the signal. A report can explain the period. An AI data agent can help users ask the next question, generate the next briefing, and keep follow-up moving inside a governed workflow.
FAQs
Supply chain analytics is the process of collecting and analyzing supply chain data to understand demand, inventory, procurement, production, warehouse, logistics, delivery, cost, and risk performance. It helps teams monitor what is happening, diagnose why it happened, predict what may happen next, and decide what to investigate or improve.
The main types are descriptive analytics, diagnostic analytics, predictive analytics, and prescriptive analytics. Descriptive analytics shows what happened. Diagnostic analytics explains why it happened. Predictive analytics estimates what may happen next. Prescriptive analytics suggests possible actions under defined business rules and constraints.
Important metrics include on-time delivery, on-time in-full, fill rate, inventory turnover, days of inventory, stockout rate, forecast accuracy, supplier on-time delivery, supplier defect rate, order cycle time, warehouse throughput, freight cost, and revenue at risk. The best metric set depends on the user and decision.
A supply chain dashboard is the visual interface that displays metrics, charts, alerts, and drill-down views. Supply chain analytics is the broader practice of connecting data, defining metrics, diagnosing causes, predicting risk, and supporting decisions. A dashboard is one important output of the analytics system.
Common sources include ERP, WMS, TMS, MES, order management, CRM, supplier portals, spreadsheets, and external risk data. The exact sources depend on whether the team is analyzing demand, inventory, procurement, production, warehouse operations, logistics, customer service, or risk.
FineReport can support the governed reporting and operational cockpit layer by connecting supply chain data, building reusable dashboards and reports, scheduling updates, and managing permissions. Dora can act as the AI Data Agent layer that answers follow-up questions, generates briefings, flags exceptions, pushes owner-specific follow-ups, and summarizes unresolved risks based on trusted FineReport assets. Human review should remain part of the workflow.
A good first project is a recurring question with clear ownership, such as late-order risk, inventory shortage review, supplier delay analysis, warehouse throughput monitoring, or logistics cost variance. Start narrow, define the metrics, connect the required data, build the first dashboard or report, and add follow-up rules after users trust the output.
