

What is Sustainability Reporting?
Sustainability Reporting vs. ESG Reporting
People often use sustainability reporting and ESG reporting as if they mean the same thing. They overlap, but the emphasis is different.
- Sustainability reporting is the broadest term. It explains how an organization affects the environment, society, employees, communities, customers, suppliers, and long-term business resilience.
- ESG reporting usually organizes the same topic around environmental, social, and governance categories. It is often written for investors, lenders, regulators, rating agencies, and enterprise customers.
Don’t just collect sustainability data. Visualize what matters.
Download the KPI Dashboard Guide to strengthen your sustainability reporting workflow:
- 10 essential steps to turn sustainability goals into measurable KPI views
- How to choose charts that make ESG data easier to read
- 15 dashboard templates you can study before designing sustainability reports

Sustainability Reporting Standards
Sustainability reporting standards help companies move from scattered ESG stories to comparable information. The right framework depends on jurisdiction, audience, industry, and material topics.
Common frameworks and standards include:
- GRI Standards: Often used for impact reporting. GRI helps organizations explain their impacts on the economy, environment, and people. It is useful when the report must speak to a broad stakeholder audience, not only capital markets.
- ESRS under CSRD: Companies subject to the EU Corporate Sustainability Reporting Directive report according to European Sustainability Reporting Standards. ESRS uses double materiality, meaning companies consider both how sustainability issues affect the business and how the business affects people and the environment.
- IFRS S1 and IFRS S2: ISSB standards focus on sustainability-related financial information for users of general purpose financial reports. IFRS S1 covers general sustainability-related risks and opportunities. IFRS S2 covers climate-related disclosures.
- SASB Standards: SASB industry standards help companies identify financially material sustainability topics and metrics by sector. They are often useful when investors ask for industry-specific comparability.
- TCFD-aligned climate reporting: TCFD recommendations shaped the common structure of governance, strategy, risk management, metrics, and targets for climate disclosure.
- Integrated reporting: Integrated reporting connects financial and non-financial information into a broader value-creation story.
- Local disclosure rules: Many countries, stock exchanges, lenders, and large customers have their own sustainability data requests. Always verify the rules that apply to your entity, reporting period, and industry.
As of 2026, sustainability reporting is still changing quickly. IFRS S1 and IFRS S2 are effective for annual reporting periods beginning on or after January 1, 2024 where they are applied or adopted. In the EU, the first companies subject to CSRD apply the rules for the 2024 financial year, with reports published in 2025. Requirements may still change by jurisdiction, so treat this guide as a reporting workflow reference, not legal advice.
Do not start by choosing every possible framework. Start by mapping the reporting obligation, audience, and decision use. Then select the disclosures and metrics that fit the reporting question.
Metrics of Sustainability Reporting
Sustainability reporting fails when teams collect every ESG number they can find and leave readers to interpret the mess. A useful metric set is selective, defined, and tied to material topics.
Environmental metrics often include:
- Greenhouse gas emissions by Scope 1, Scope 2, and, when relevant, Scope 3
- Energy consumption, renewable energy share, and energy intensity
- Water withdrawal, discharge, recycling, and water stress exposure
- Waste generation, hazardous waste, recycling rate, and circularity indicators
- Air pollution, wastewater quality, materials usage, biodiversity impact, and environmental incidents
- Climate targets, transition plans, decarbonization initiatives, and progress against baseline
Social metrics often include:
- Headcount, turnover, hiring, diversity, training, and employee engagement
- Health and safety incidents, lost-time injury frequency, near misses, and corrective actions
- Labor standards, human rights risk, grievance mechanisms, and remediation status
- Supplier labor risk, responsible sourcing, and value-chain due diligence
- Customer health, privacy, product safety, accessibility, and responsible marketing
- Community investment, local impact, stakeholder engagement, and affected communities
Governance metrics often include:
- Board oversight of sustainability risks and opportunities
- Ethics training, anti-corruption controls, whistleblower cases, and investigation status
- Data privacy, cybersecurity governance, and compliance incidents
- Risk management process, internal controls, policy coverage, and audit findings
- Supplier governance, procurement controls, conflict-of-interest management, and executive accountability
The metric definition matters as much as the metric name. For each sustainability reporting metric, document:
- Business meaning: What the metric shows and why it matters.
- Formula: How the metric is calculated, including unit, numerator, denominator, and conversion factors.
- Scope: Which entities, facilities, regions, suppliers, products, or employee groups are included.
- Data source: ERP, HRIS, EHS system, utility bills, supplier surveys, IoT data, spreadsheets, procurement systems, or manual evidence.
- Owner: Who validates the metric and who explains changes.
- Refresh cadence: Monthly, quarterly, annually, or event-based.
- Quality checks: Missing data, duplicate records, outliers, estimate flags, source changes, and approval status.
This is where sustainability reporting connects to data reporting. ESG disclosure is not only a communications task. It is a data management task with business meaning, review responsibility, and traceability.
Sustainability Reporting Data Model
Sustainability reporting usually depends on data that was not originally designed for external disclosure. Energy invoices sit with facilities. Employee data sits in HR systems. Supplier answers sit in procurement portals. Emissions factors live in spreadsheets. Incidents may sit in EHS tools. Policies may sit in document folders.
A reliable sustainability reporting data model should connect four layers:
- Source systems: ERP, finance, procurement, HRIS, EHS, utility meters, facility systems, logistics systems, product systems, supplier platforms, and spreadsheets.
- Reference data: Organization hierarchy, facility list, reporting boundary, emission factors, supplier categories, material topic map, and policy taxonomy.
- Metric logic: Calculations, unit conversions, thresholds, ownership rules, reporting period filters, and restatement rules.
- Evidence and workflow: Uploads, approvals, comments, source links, data quality flags, audit trail, and review status.
The main risk is not only wrong numbers. It is numbers that nobody can explain.
For example, a carbon emissions figure may depend on:
- Facility electricity consumption
- Market-based or location-based emission factors
- Renewable energy certificates
- Fuel usage and vehicle data
- Business travel and logistics data
- Supplier activity data
- Estimation rules for missing values
- Consolidation rules for subsidiaries or joint ventures
If those assumptions are not visible, the report becomes fragile. A reader may ask why emissions changed, and the team may not know whether the answer is business activity, methodology, facility coverage, supplier response rate, or a calculation update.
For enterprise teams, this is also where enterprise reporting habits matter. Sustainability reporting becomes more credible when it uses the same discipline as finance, operations, and compliance reporting: definitions, owners, refresh cadence, permissions, and review workflows.
Examples and Templates
Sustainability reporting becomes easier when teams can see how ESG data might be organized visually. The demo templates below are not meant to replace your reporting framework. Use them as learning material for layout, metric grouping, visual hierarchy, and drill-down design.
Study each example through a sustainability reporting question:
- How would this view help a sustainability team find the next issue to investigate?
- Which metric would need a definition, owner, and evidence trail before publication?
- Which view supports executive review, and which view supports operational follow-up?
- Where would you add targets, baselines, reporting period filters, and commentary?


Here is how these demos map to sustainability reporting work:
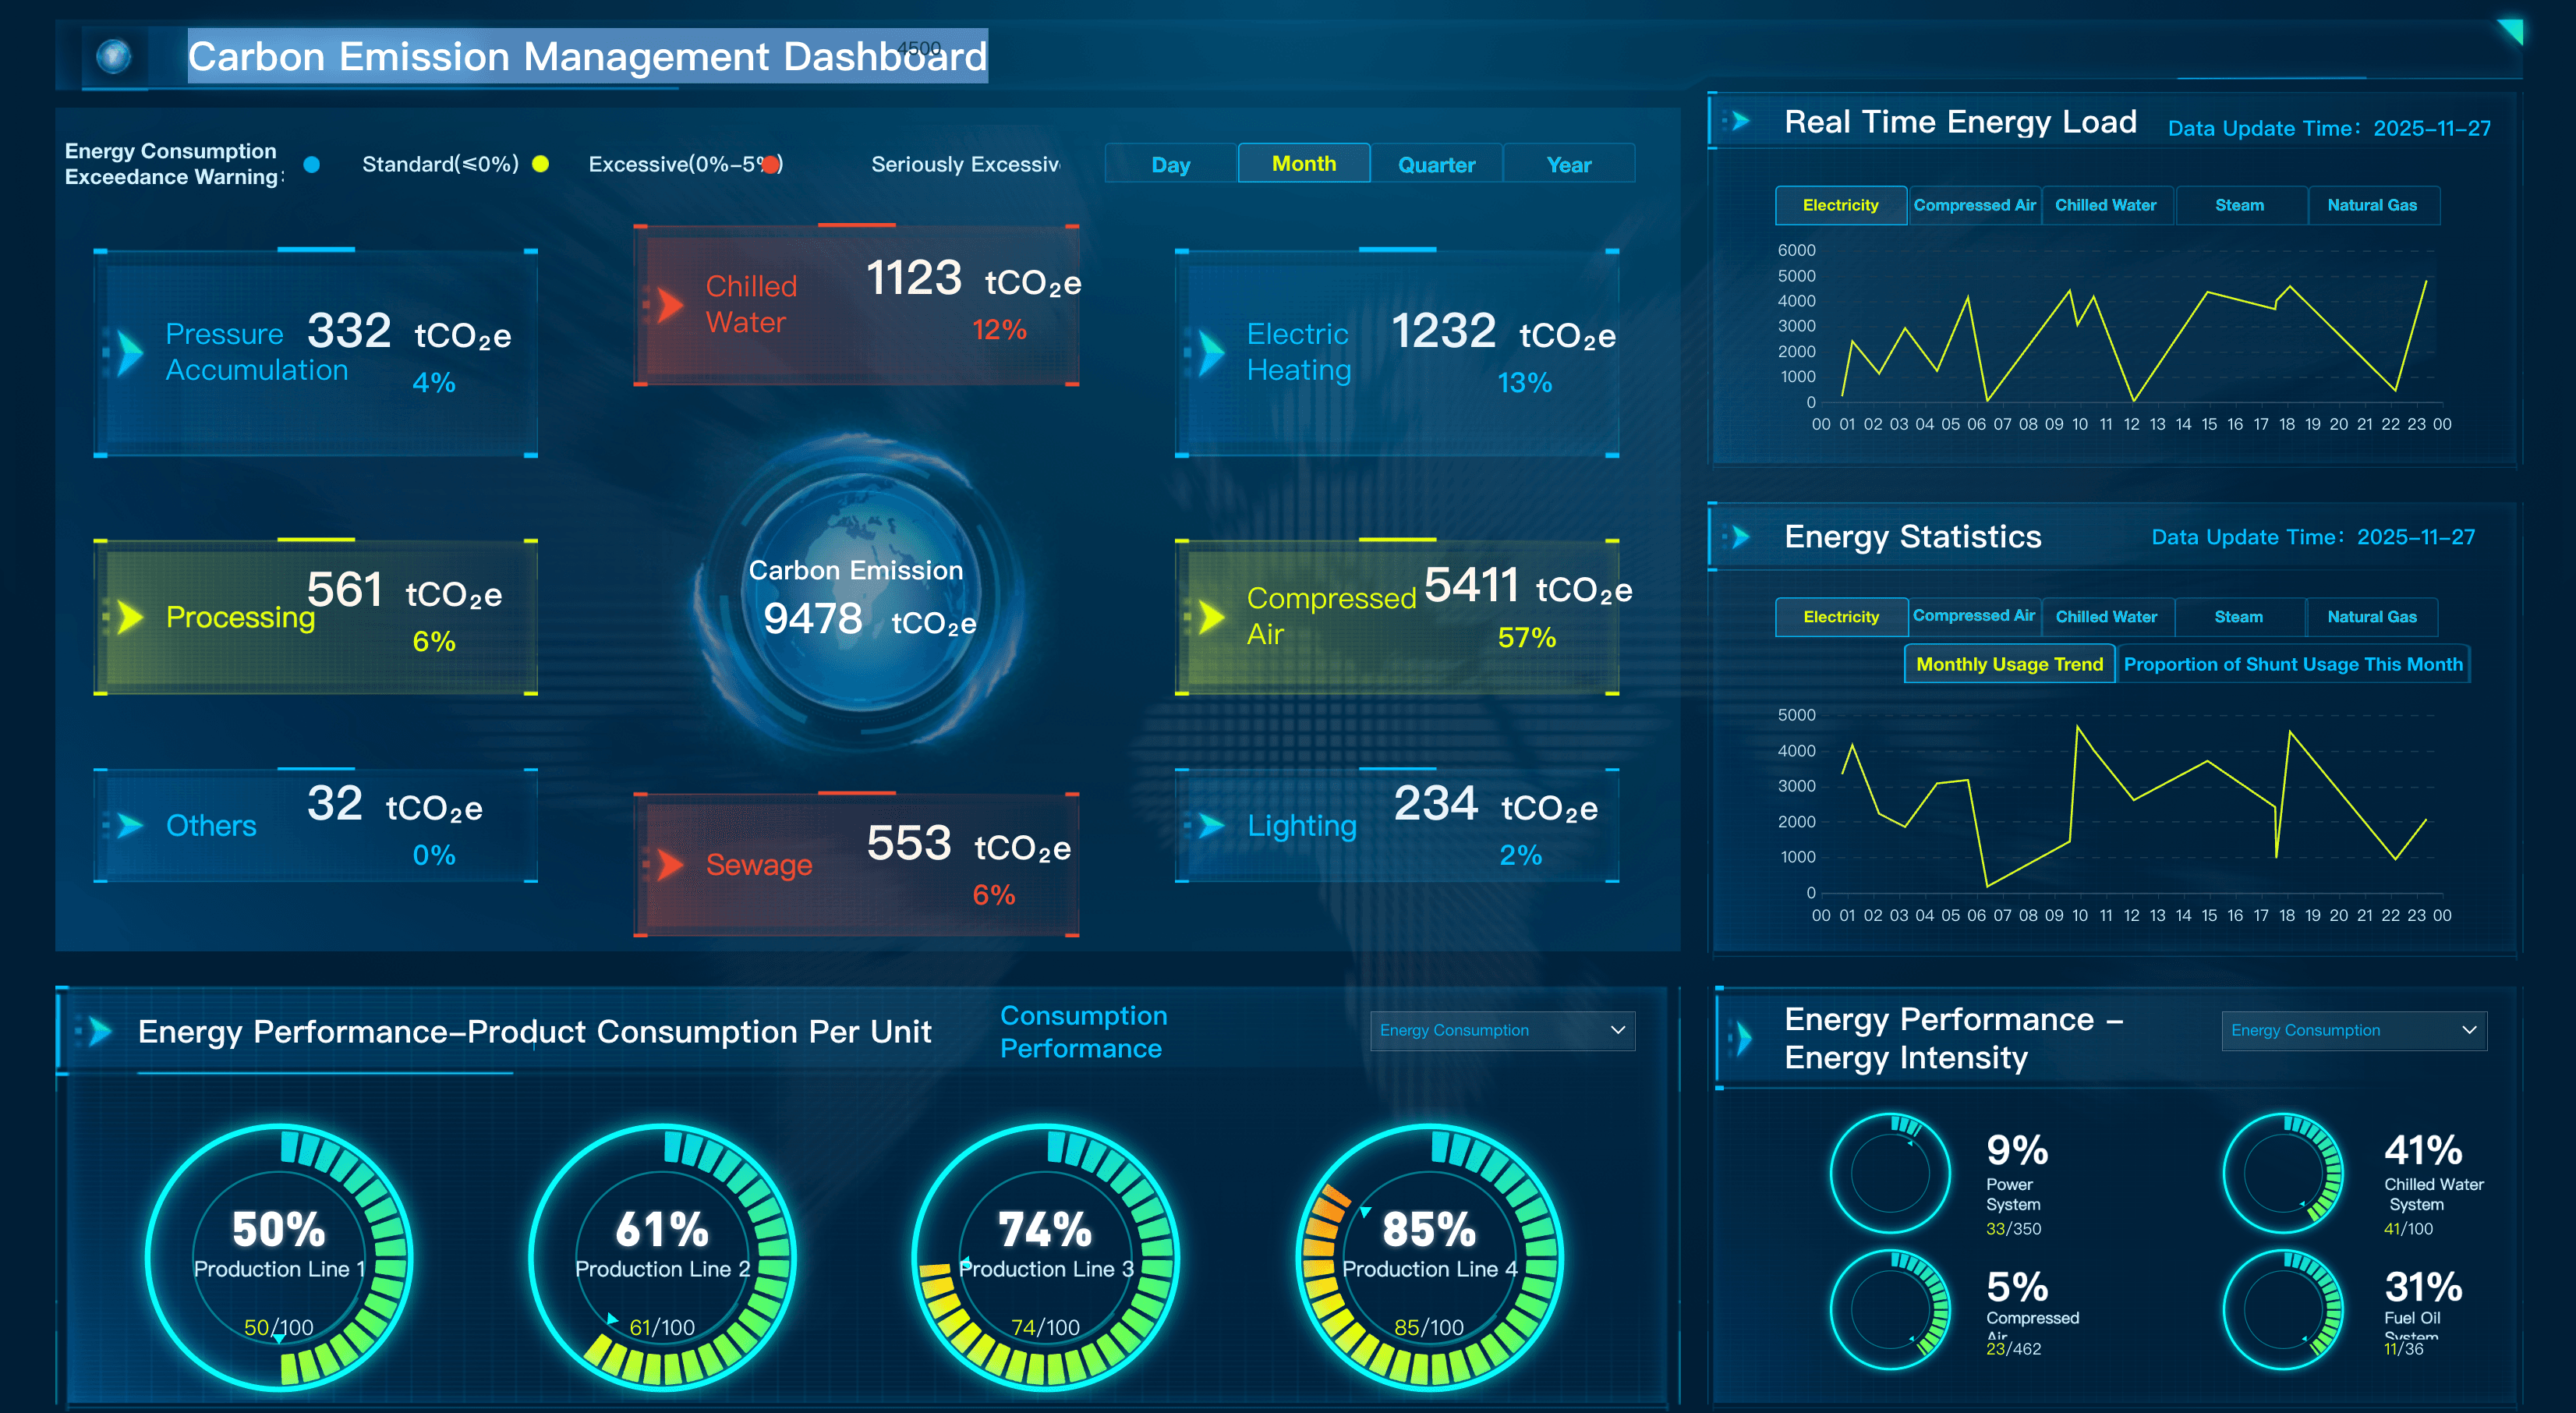
- Carbon Emissions Dashboard: Useful for learning how to compare emissions by scope, source, organization, time period, and reduction target.
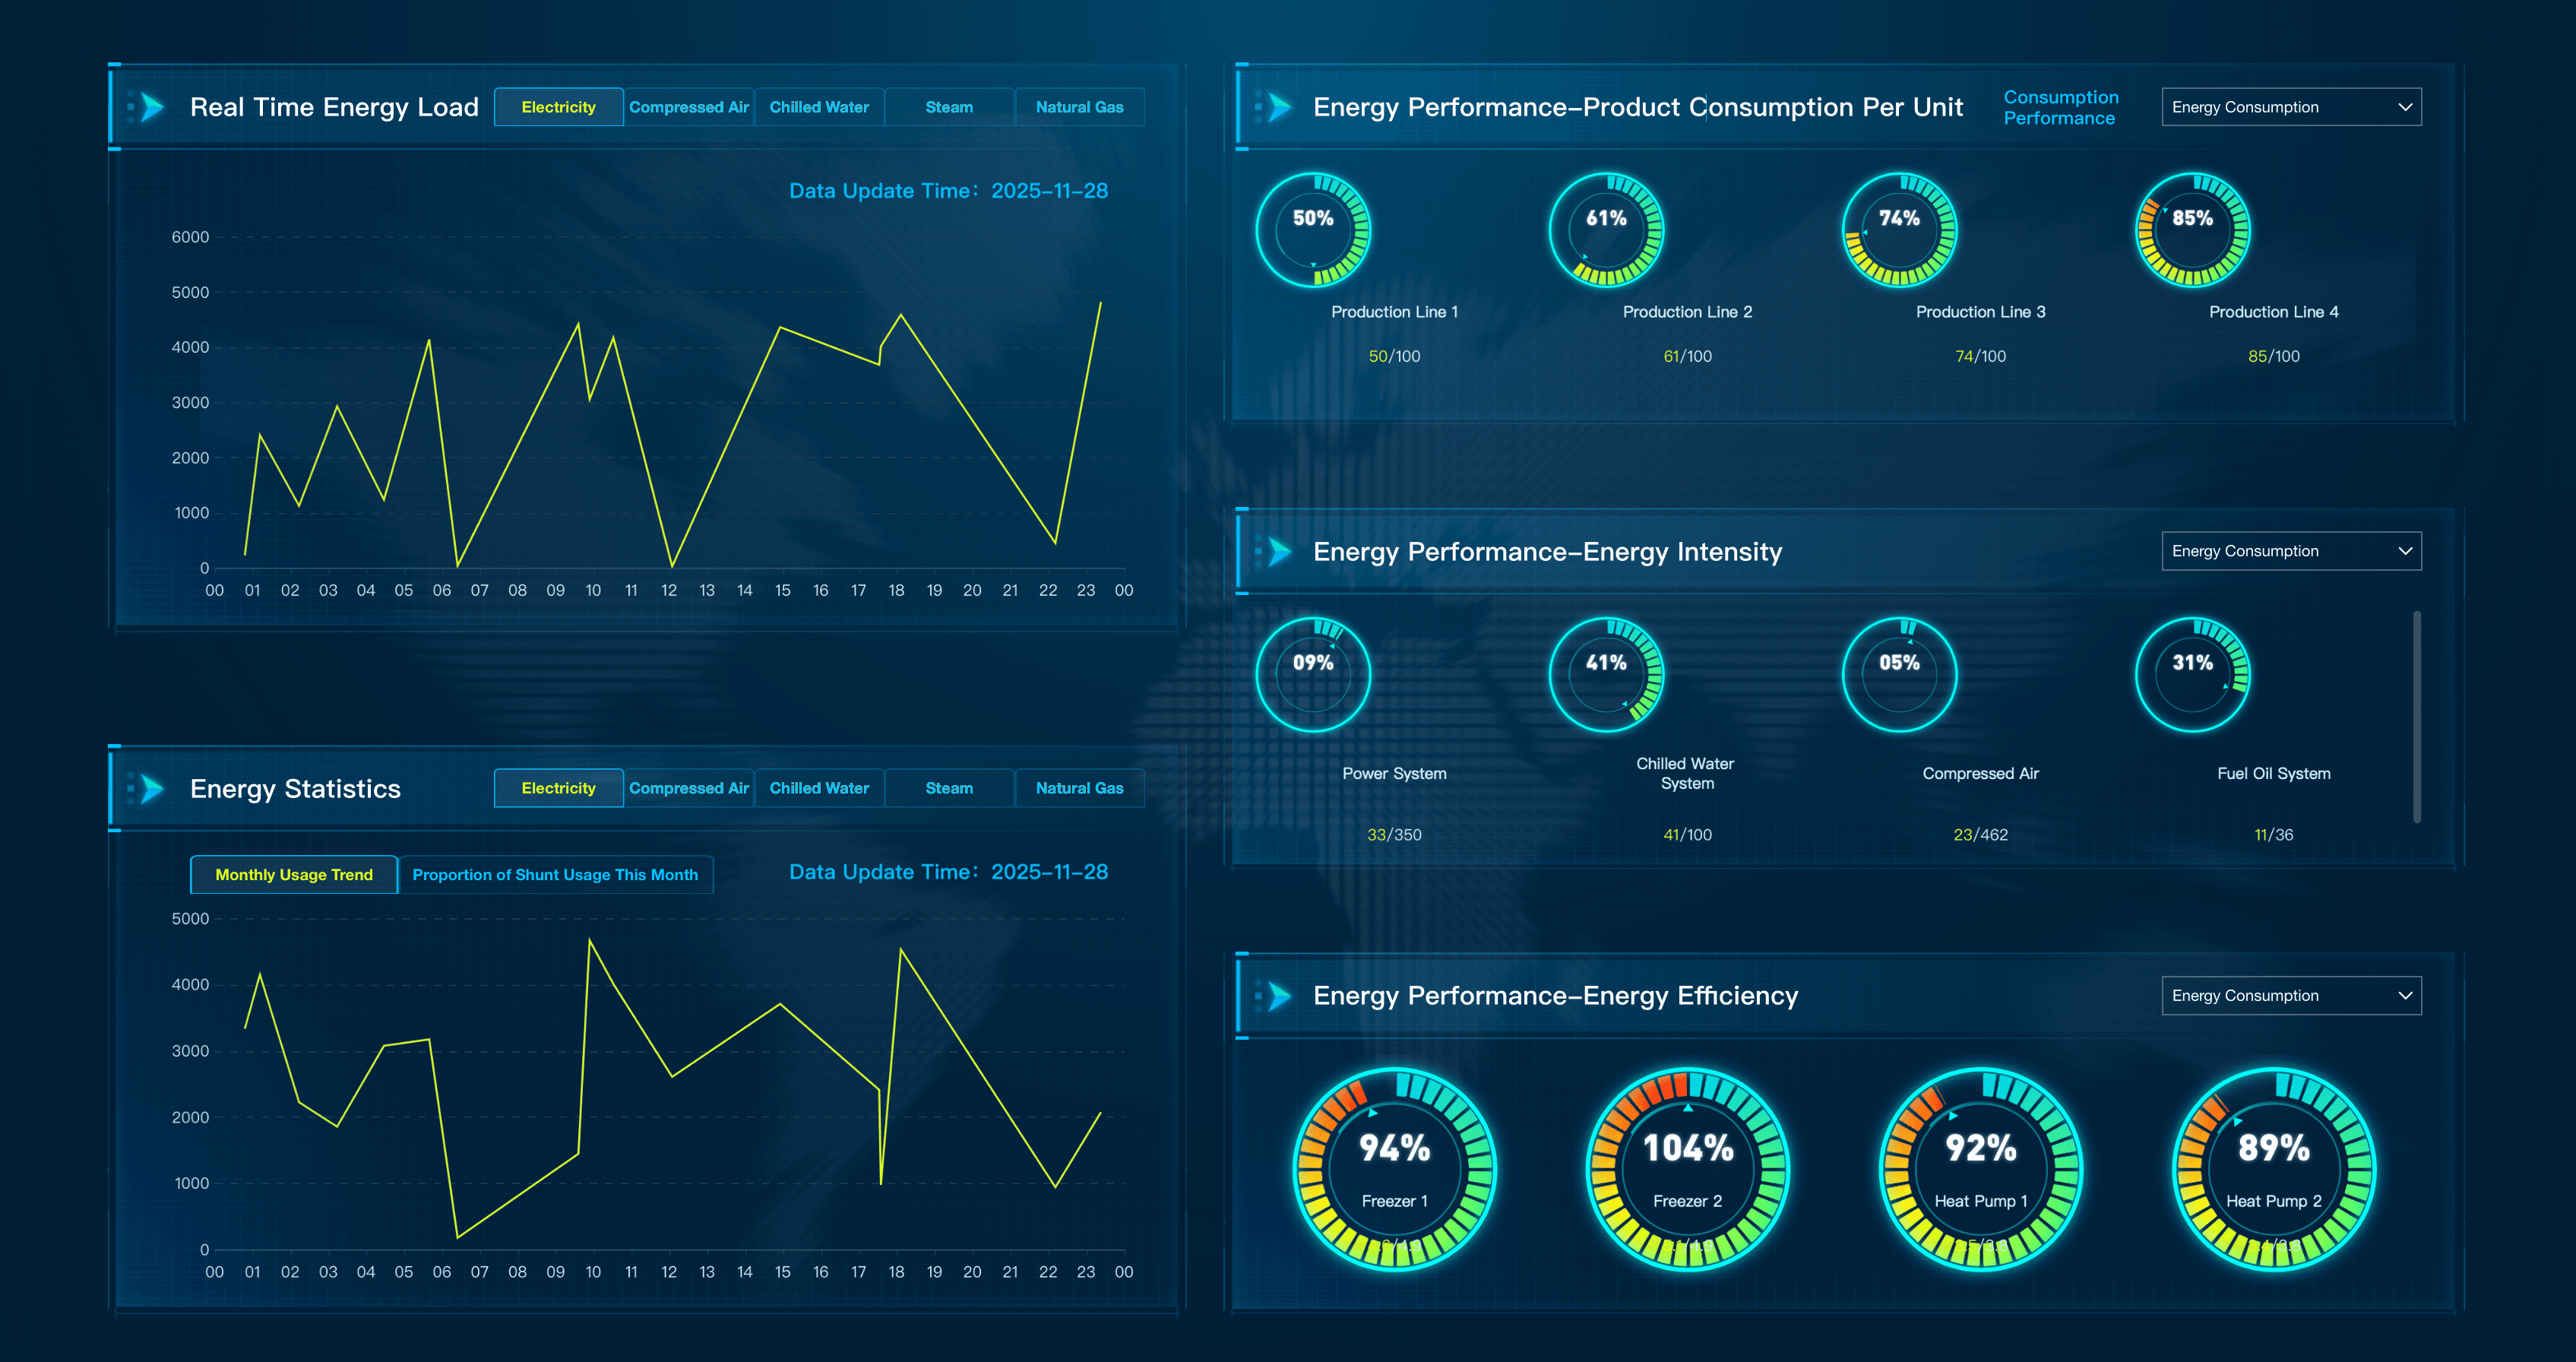
- Energy Management Dashboard: Useful for tracking consumption, energy intensity, cost, renewable energy share, and facility-level variance.
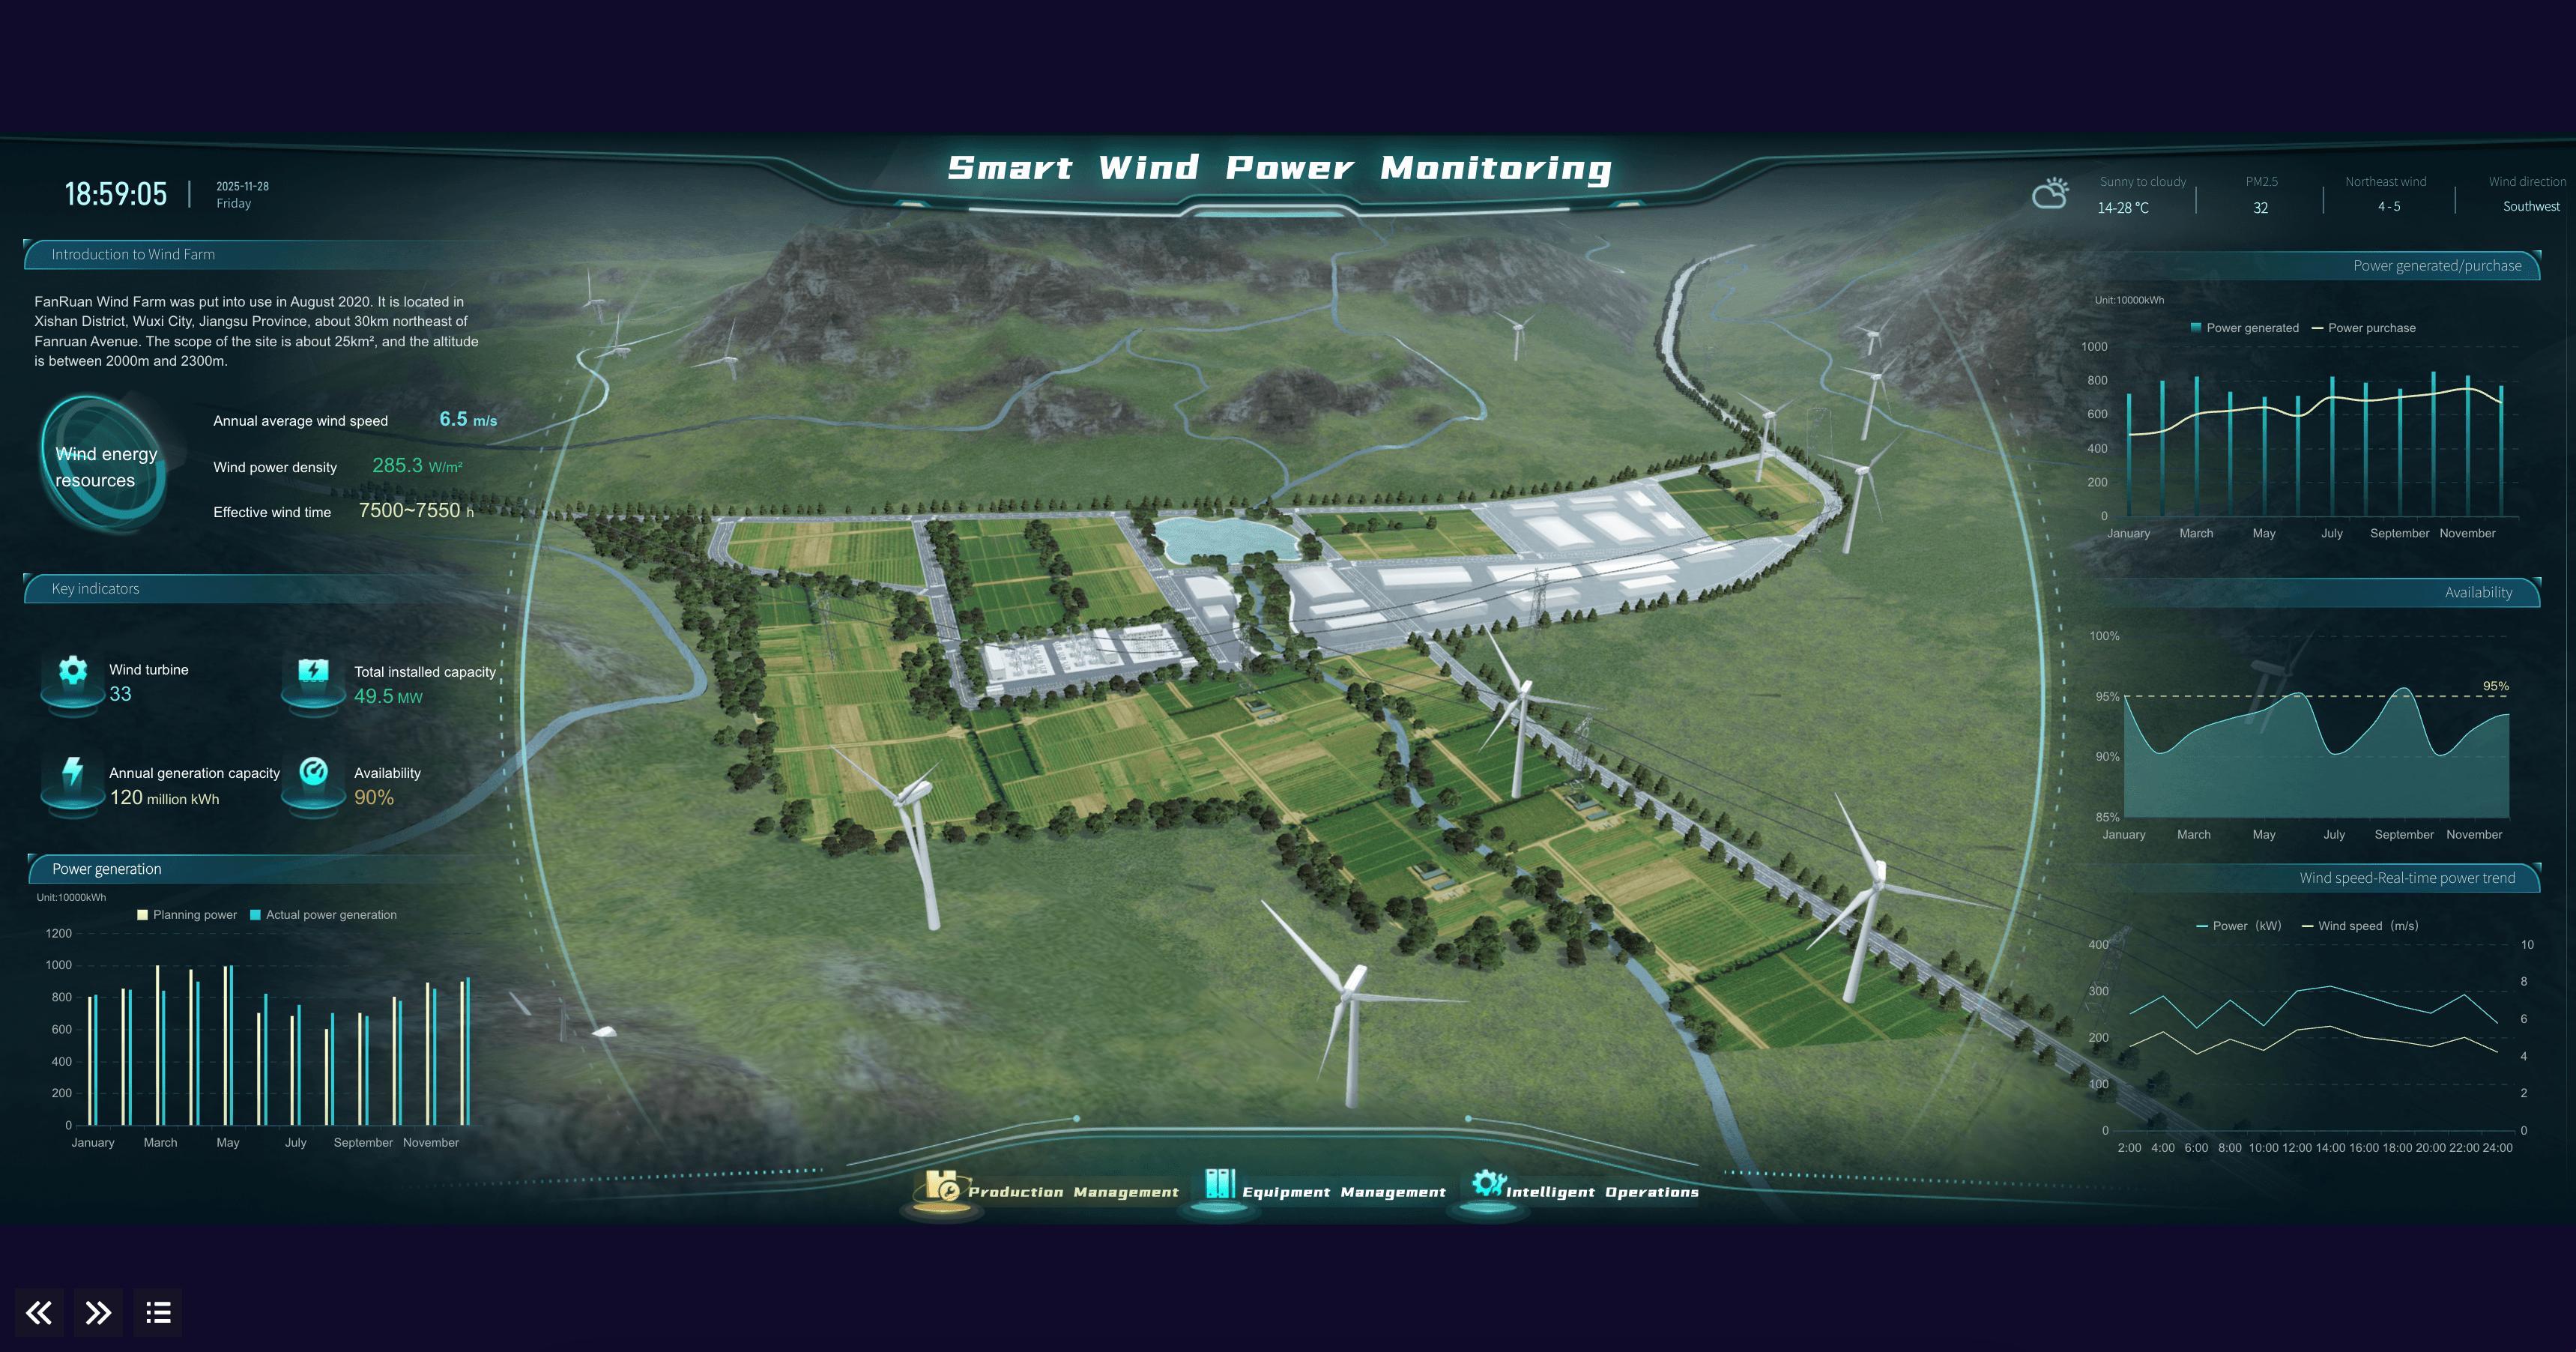
- Smart Wind Power Monitoring: Useful for renewable energy operations, asset monitoring, generation performance, and exception handling.
- Water and Wastewater Dashboards: Useful for water quality, treatment performance, leakage, compliance thresholds, and operational reliability.
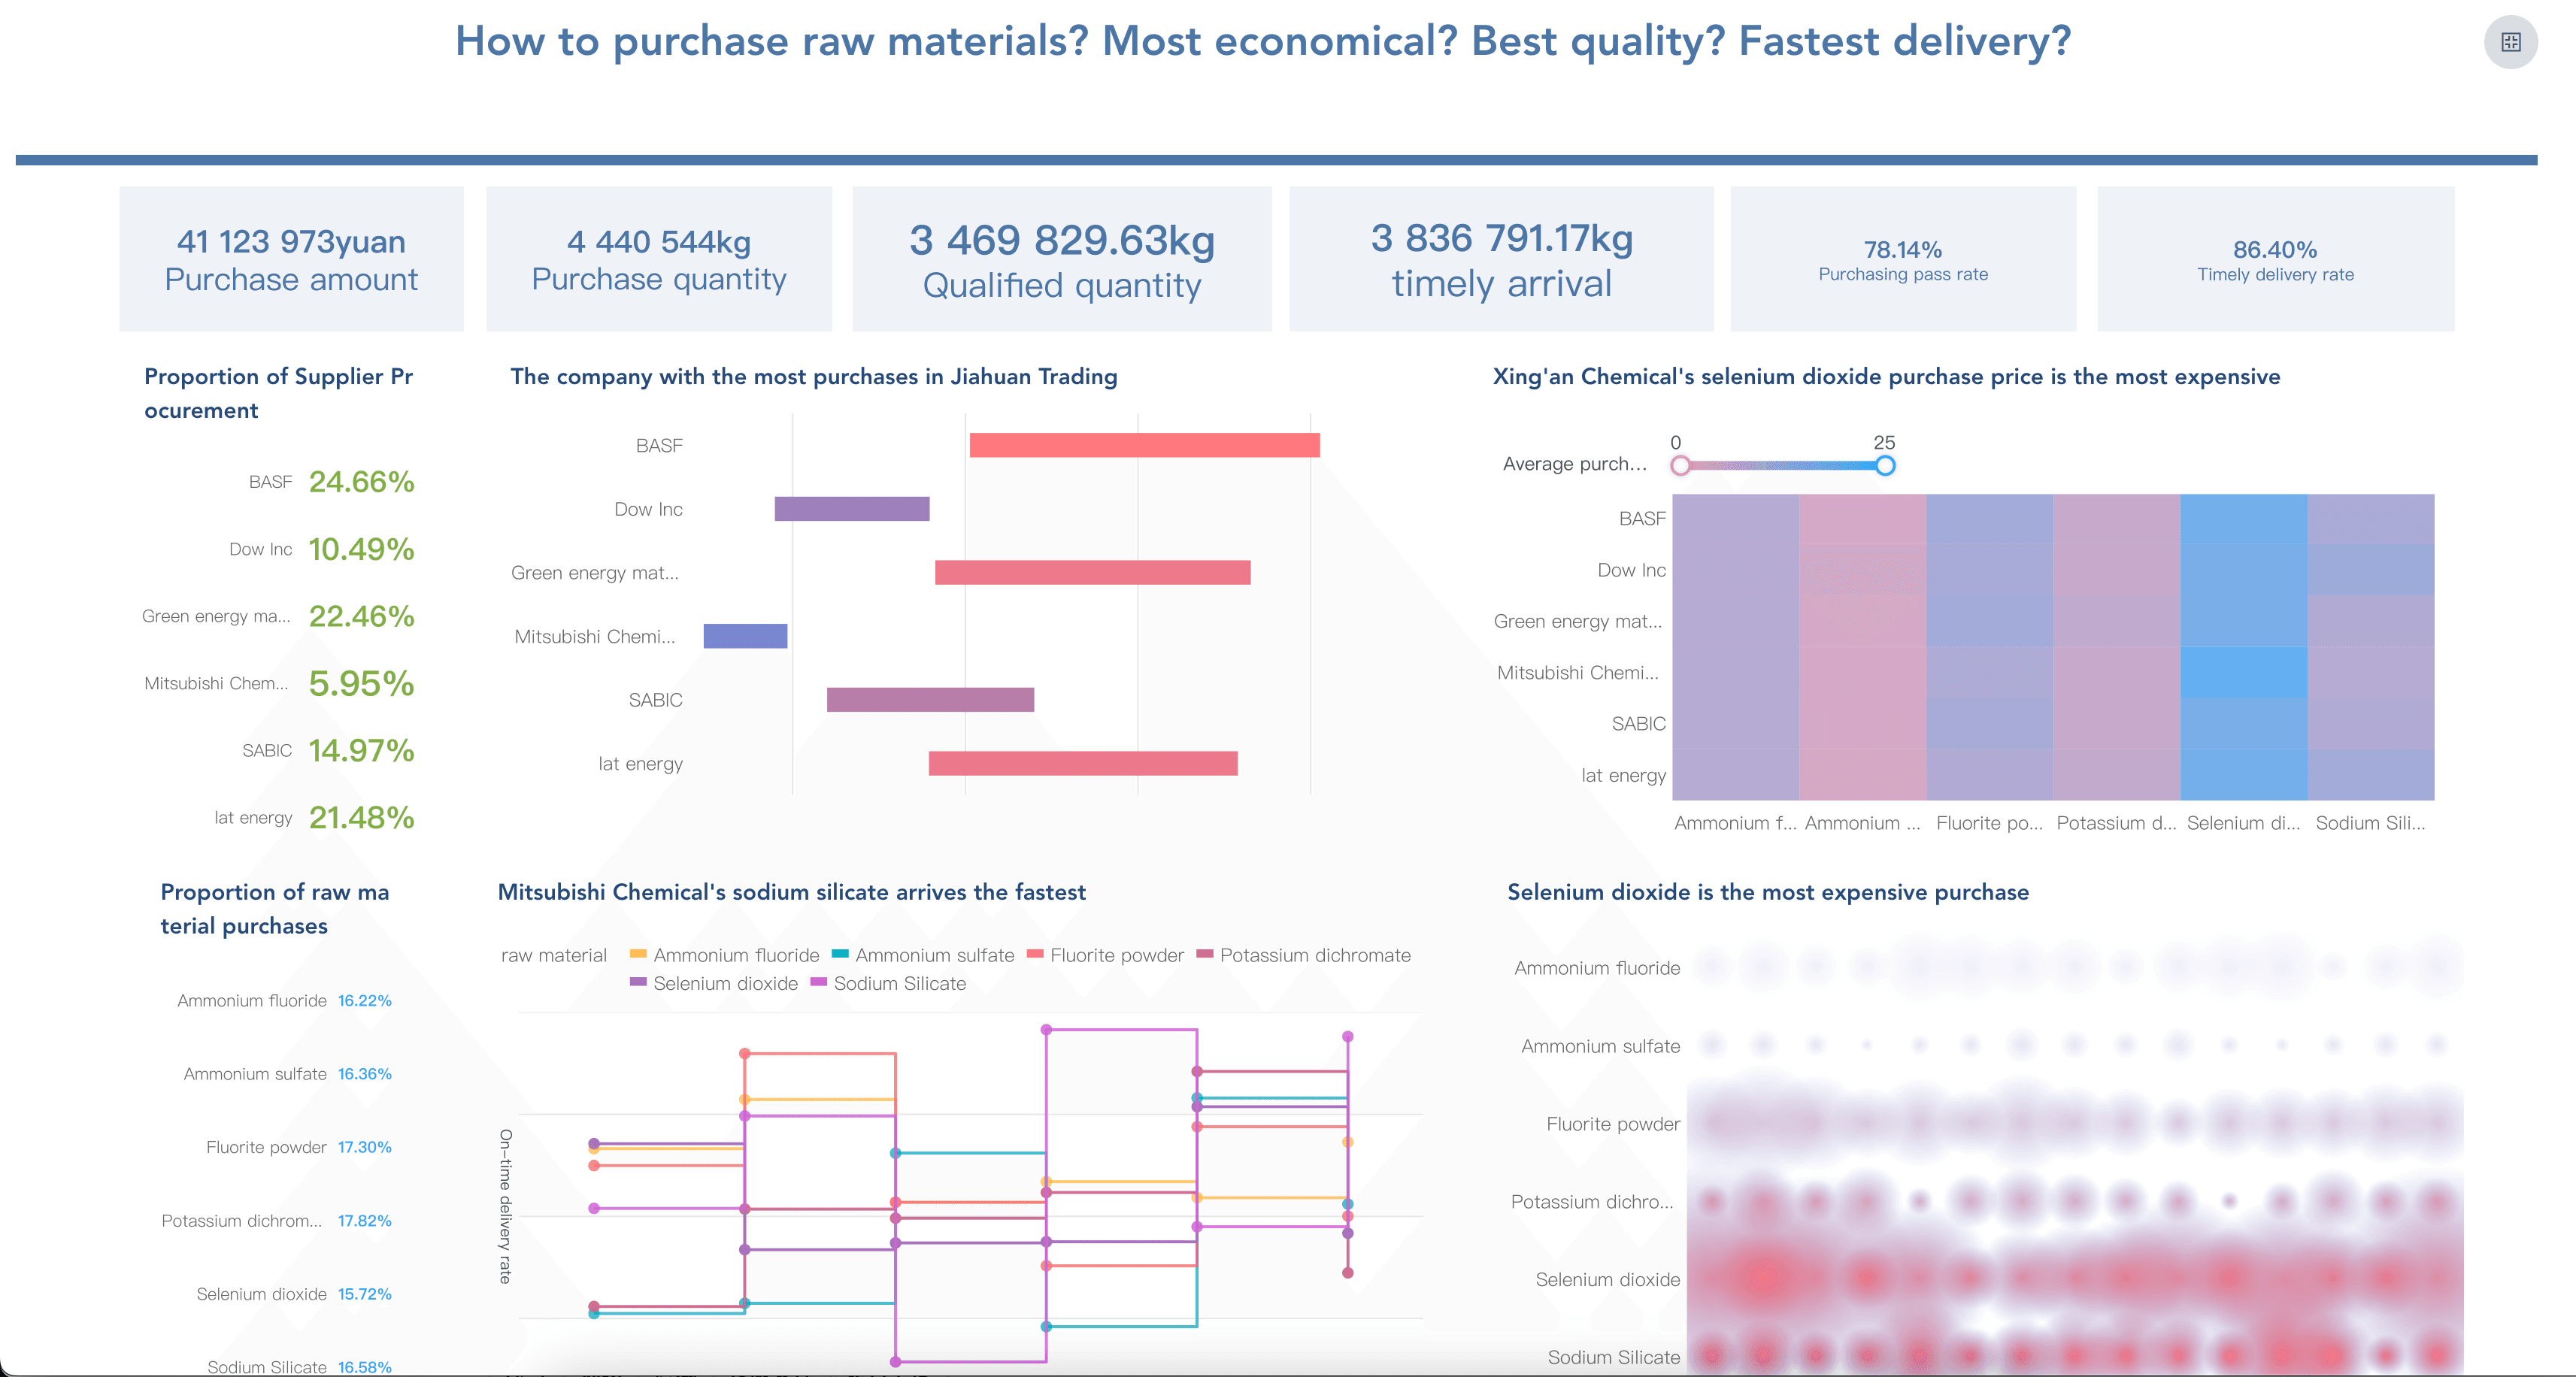
- Procurement Dashboard: Useful for supplier performance, responsible sourcing, cost-quality-delivery balance, and supply chain ESG data collection.
A good sustainability reporting example should not only look polished. It should help readers move from a headline metric to the evidence behind it.
Sustainability Reporting Process
Sustainability reporting works best when it follows a repeatable workflow. The process does not need to be heavy at the beginning, but it does need clear ownership.
Use this workflow:
- Define the reporting purpose. Decide whether the report is for regulatory disclosure, investor communication, customer questionnaires, internal ESG management, executive review, or all of the above.
- Confirm reporting obligations. Identify which standards, frameworks, customer requirements, lender requirements, or local rules apply to your entity and reporting period.
- Map stakeholders and material topics. List the sustainability topics that matter most to the business and stakeholders. Include environmental, social, governance, supply chain, and industry-specific issues.
- Set the reporting boundary. Define entities, facilities, geographies, products, suppliers, and time periods included in the report.
- Build a metric dictionary. Document formulas, units, data sources, owners, targets, baseline year, and quality checks.
- Collect and validate data. Pull data from systems, files, surveys, and evidence folders. Mark estimates, gaps, exceptions, and late submissions.
- Analyze variance. Explain what changed against baseline, target, previous period, and peer or site comparisons where appropriate.
- Create visual summaries. Use charts, tables, and commentary to make performance readable. Pair each main metric with target, trend, owner, and explanation.
- Review and approve. Involve sustainability, finance, legal, HR, procurement, operations, IT, and executive owners where needed.
- Publish and follow up. After publishing, turn findings into action plans, owner tasks, supplier requests, data-quality improvements, and next-cycle reporting standards.
The process should produce two outputs: the external sustainability report and the internal management system that makes next year's report easier.
This workflow also helps teams choose reporting tools carefully. The question is not "Which tool makes the prettiest ESG report?" The better question is "Which workflow helps us define, collect, validate, explain, and reuse sustainability data?"
Sustainability Reporting With FineBI + Dora
FineBI + Dora can support sustainability reporting as a learning and operating layer, not as a shortcut around governance.
FineBI can help with the structured BI layer:
- Connect sustainability data from spreadsheets, ERP, HR, procurement, EHS, facility systems, and other sources.
- Build reusable metric definitions for emissions, energy, water, waste, safety, supplier risk, and governance indicators.
- Create visual pages for executive ESG review, climate metrics, resource use, supplier performance, and data-quality tracking.
- Manage role-based access so sustainability, finance, HR, procurement, operations, and executives see the right level of detail.
- Keep recurring sustainability dashboards easier to refresh, review, and reuse.
Dora can support the AI Data Agent layer above trusted BI assets. Instead of asking teams to search through many dashboards or spreadsheet tabs, dora can help users ask questions, retrieve the right view, generate a chart-style answer, create a briefing, push an exception to an owner, and follow up inside a governed workflow.
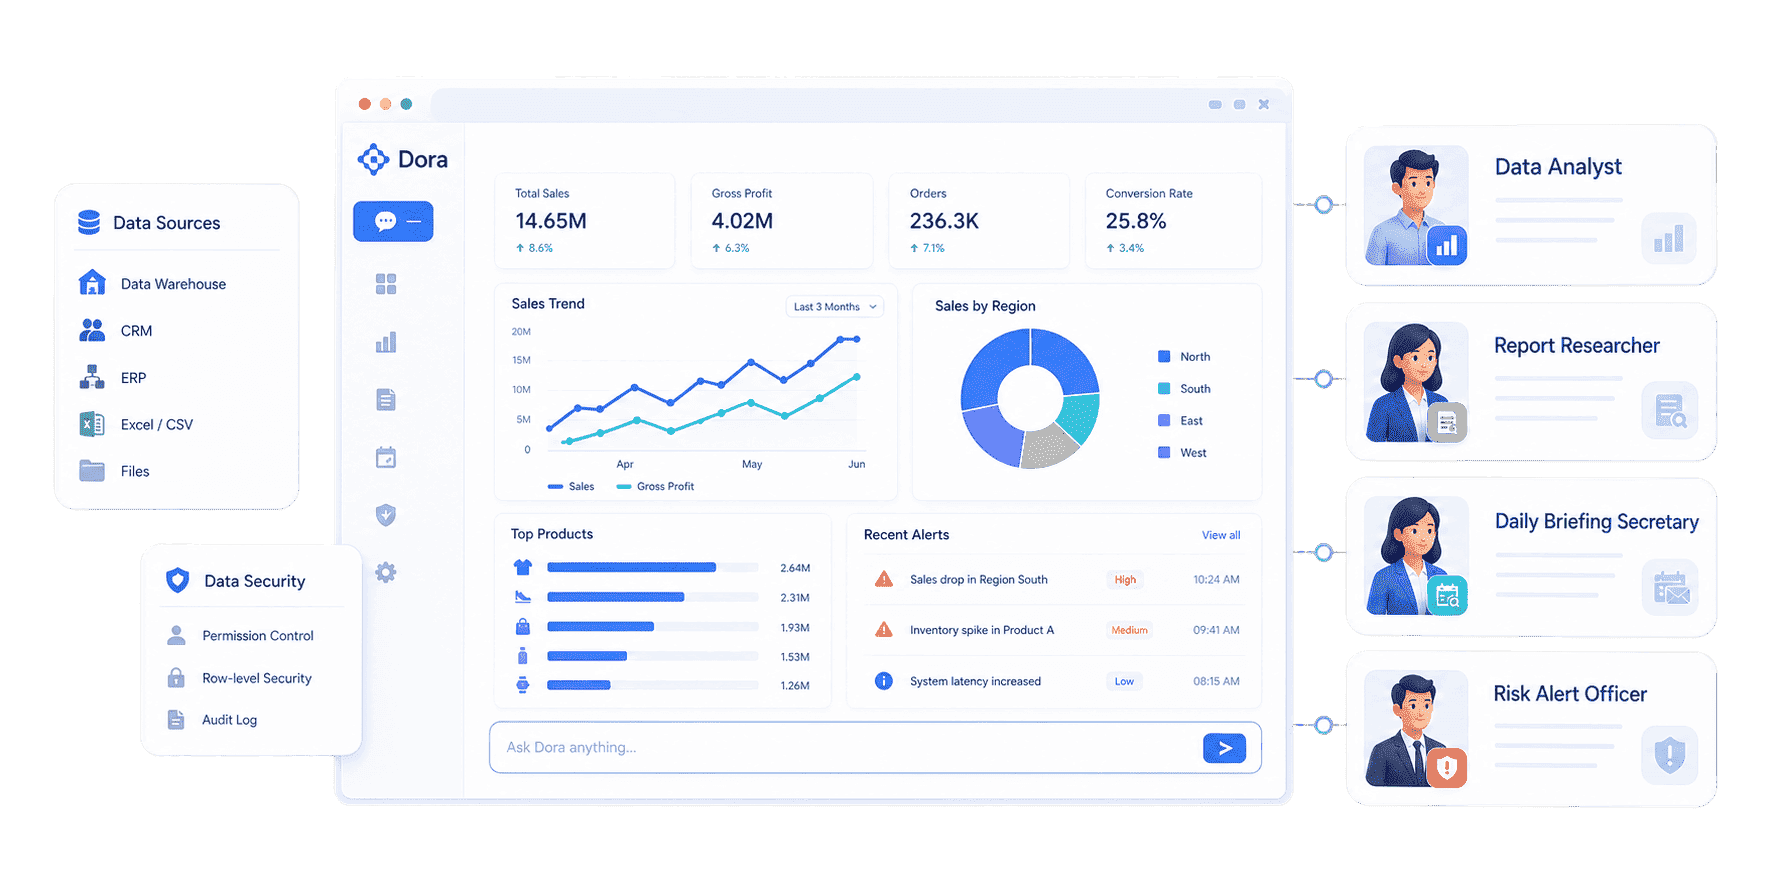
For sustainability reporting, the most relevant digital employees are:
- Report Researcher: Helps gather metric context, compare periods, draft structured sustainability reporting commentary, and prepare review-ready summaries from approved FineBI assets.
- Risk Alert Officer: Helps watch thresholds, missing data, abnormal changes, late submissions, supplier risk, energy spikes, water anomalies, safety incidents, or governance exceptions.
- Data Analyst: Helps business users ask follow-up questions in natural language and explore variance without manually rebuilding every view.
 Dora's Role-based Digital Employees
Example chat-style questions:
- "Show this quarter's energy intensity by facility, compare it with last year, and highlight the top three drivers."
- "Create a dashboard-style view of Scope 1 and Scope 2 emissions by source, region, and target progress."
- "Generate a sustainability reporting briefing for the ESG committee with missing data, late owners, and high-risk metrics."
- "Which suppliers have not submitted ESG data, and which procurement owners should follow up this week?"
- "Explain why water usage increased in the East region and show the facilities contributing most to the change."
 Natural-language Query
A closed-loop sustainability reporting workflow could look like this:
- Detect or retrieve data. FineBI connects approved ESG data sources and dora retrieves the relevant metric, dashboard, or report asset.
- Check definitions and permissions. dora uses configured business terms, KPI definitions, filters, and role permissions rather than uncontrolled tables.
- Explain the change. dora compares periods, segments, facilities, suppliers, or categories and suggests likely drivers for human review.
- Generate a view or briefing. dora prepares a chart-style answer, sustainability reporting summary, or review note based on governed assets.
- Push to the owner. dora can send an exception, missing-data reminder, or review task to the responsible team.
- Follow up and summarize. dora tracks responses and prepares a status summary for the next ESG review.
This is the fourth-generation Agentic BI pattern: natural-language request, trusted semantic layer, governed query, answer, action, and follow-up. The value is not that AI writes a sustainability report by itself. The value is that business teams can learn from approved sustainability data faster, with clearer definitions, permission boundaries, and human review.
A practical learning path:
- Week 1: Build the sustainability reporting topic map. List material topics, required disclosures, internal owners, and reader questions.
- Week 2: Create the ESG metric dictionary. Define formulas, units, sources, owners, baselines, targets, and evidence rules.
- Week 3: Prototype the visual layer in FineBI. Build a small set of ESG pages: summary, emissions, energy, social metrics, supplier risk, governance, and data quality.
- Week 4: Use dora for follow-up analysis. Ask variance questions, identify missing evidence, generate review summaries, and push owner-specific tasks.
- Week 5: Turn learning into standards. Document useful prompts, chart patterns, metric definitions, validation rules, and review workflows for the next cycle.
The commercial reason this scenario can land in a real enterprise is simple: sustainability reporting is recurring, cross-functional, evidence-heavy, and deadline-driven. The solution is not only software. It is scenario + product + service: define the reporting workflow, connect the data, build the metric layer in FineBI, configure dora Skills and permissions, and help teams adopt a repeatable ESG review rhythm.
Sustainability Reporting Hub
This sustainability reporting page should work as a spoke inside a broader reporting hub. Readers who start with sustainability often need adjacent resources on general reporting, finance, sales, dashboards, BI, and data visualization.
Use these related resources as the hub-and-spoke path:
The same report hub can also introduce business report, status report, ESG report, marketing report, regulatory reporting, report builder, expense report, financial reporting, sustainability reporting software, ESG reporting software, CSRD reporting, ESG data reporting, ESG reporting standards, ESG reporting tools, sustainability reporting tools, and supply chain reporting.
For dashboard-connected learning, pair sustainability reporting with dashboard examples, dashboard design, KPI dashboard, procurement dashboard, and supply chain dashboard resources. Sustainability reporting becomes more useful when readers can move from a published report to the dashboards that explain the underlying data.
FAQs
Sustainability reporting is the process of collecting, measuring, explaining, and publishing information about an organization's environmental, social, and governance performance. It helps stakeholders understand material ESG topics, performance trends, risks, targets, actions, and accountability.
A sustainability report should include reporting scope, material topics, standards used, ESG policies, metrics, targets, progress, data sources, calculation methods, governance, risks, actions, and limitations. The exact content depends on the reporting framework, jurisdiction, industry, and stakeholder audience.
Sustainability reporting is the broader practice of explaining environmental, social, governance, and long-term impact topics. ESG reporting usually organizes those topics for investors, regulators, rating agencies, lenders, and enterprise customers. In practice, many companies use both terms for the same reporting program.
The answer depends on your reporting obligation and audience. Common standards and frameworks include GRI, ESRS under CSRD, IFRS S1 and S2, SASB Standards, TCFD-aligned climate disclosure, integrated reporting, and local rules. Companies should confirm requirements with legal, finance, sustainability, and assurance advisors.
Start by defining the reporting purpose, audience, obligations, material topics, reporting boundary, and metric owners. Then build a small metric dictionary, collect data from trusted sources, validate the numbers, create visual summaries, review with owners, and document lessons for the next reporting cycle.
Credible sustainability reporting uses clear definitions, consistent data sources, documented assumptions, evidence trails, internal controls, owner review, transparent limitations, and appropriate assurance where required. The report should make it possible for readers to understand where the numbers came from and what they mean.
Dashboards help teams monitor sustainability metrics during the year instead of waiting for the annual report. They can show targets, trends, missing data, source quality, facility comparisons, supplier status, and open actions. The report can then focus on interpretation, accountability, and stakeholder communication.
Yes, if AI works on trusted BI assets, metric definitions, permissions, and review workflows. An AI Data Agent such as dora can help retrieve ESG data, answer follow-up questions, generate briefings, flag missing data, push owner tasks, and summarize progress. Human review is still necessary for disclosure decisions.
