
What is Edge AI for Real-Time Analytics?
Architecture of Edge AI for Real-Time Analytics
Edge AI for Real-Time Analytics architecture should start with one question: where does the business need the first useful answer?
If a camera detects a possible defect on a production line, the first answer may need to happen near the line. If a monthly cost review compares defect cost by plant, product, supplier, and shift, that answer belongs in the central analytics layer. If a business owner asks which recurring defects need follow-up, the answer needs trusted data, context, and a workflow.
A typical architecture has several parts:
Edge Devices and Sensors
Role Generate operational data such as images, signals, logs, and events.
Risk Data volume grows faster than teams can interpret or operationalize it.
Edge Gateway or Local Server
Role Filter, buffer, and route device data into upstream systems.
Risk Gateway logic can become a hidden black box.
AI Inference
Role Detect anomalies, classify inputs, and predict short-term outcomes.
Risk Models may generate confident but poorly explainable outputs.
Event Rules
Role Trigger alerts, local actions, and upstream data recording.
Risk Threshold logic becomes outdated as operations change.
Streaming / Message Layer
Role Move selected events into central systems for analysis.
Risk Poor event design limits downstream analytical value.
BI and Analytics Layer
Role Provide dashboards, metrics, and diagnostic views over historical data.
Risk Dashboards may lack upstream context for decisions.
AI Agent Workflow
Role Turn governed data into briefings, questions, and action routing.
Risk Generic AI may bypass governance, permissions, or business logic.
The architecture should not send every raw signal to every user. It should separate urgent events, reviewable exceptions, summary metrics, and historical learning data.
For example, a smart factory may keep high-frequency machine signals close to the line, send exceptions and summary windows to the analytics layer, and preserve source context for quality or maintenance review. A smart building may process occupancy and equipment signals locally, then send status, exception, and energy usage summaries to a data dashboard. A logistics operation may detect route or handling issues near the operation, then use an operational dashboard to compare service risk across sites.
Good architecture also decides what should not be automated. Edge AI can detect and suggest. Humans still decide on production stoppage, supplier escalation, customer communication, safety response, budget changes, and policy changes. The closer AI gets to operations, the more clearly teams need permission rules, source traceability, review steps, and fallback processes.
Edge AI for Real-Time Analytics vs. Cloud Analytics
Edge AI for Real-Time Analytics is often mixed with Cloud Analytics. They overlap, but they solve different parts of the work.
The best design usually combines them. Edge AI filters and interprets local signals. Streaming infrastructure moves events that matter. Cloud system stores history, calculates shared metrics, and supports comparison. A data agent or AI assistant for business helps users ask follow-up questions, generate review notes, and route issues.
This matters because many teams try to solve every real-time problem with one tool. A local model may detect a defect, but it cannot explain whether defect cost is rising across plants. A dashboard may show machine downtime, but it may not inspect every sensor event before a failure. A cloud model may train on rich history, while a local system may be the better place for millisecond-level decisions.
What should an AI assistant for business actually do?
Download the Enterprise Data Agent Guide to learn:
- How an AI assistant for business differs from chatbots and copilots
- What trusted data and governance it needs to work reliably
- Real use cases across sales, finance, manufacturing, and retail

Use Cases
Edge AI for Real-Time Analytics is most useful when fast signals affect cost, quality, safety, customer experience, service levels, or asset performance. The details differ by industry, but the pattern is similar: detect early, explain with context, and guide the next review.
Manufacturing and quality
Manufacturing teams can use Edge AI for Real-Time Analytics to inspect product images, monitor machine vibration, detect abnormal temperature, watch production pace, identify quality risk, and flag work orders that need review. The edge layer can classify possible defects or equipment changes. The analytics layer can compare by line, shift, product, batch, supplier, operator, and maintenance history.
This connects naturally with predictive analytics tools, but prediction is only useful when teams can act on it. A model that predicts equipment risk still needs downtime cost, production priority, spare parts status, maintenance owner, and customer impact.
Supply chain and logistics
Supply chain teams can use edge signals from warehouses, vehicles, scanners, routes, temperature monitors, and dock operations. Edge AI can detect unusual handling, delayed movement, route deviation, temperature risk, or inventory mismatch. The broader analytics workflow can connect those events to customer orders, supplier commitments, inventory exposure, and service-level risk.
For this scenario, an event should not stop at "risk detected." It should answer what order is affected, what material or asset is involved, which site owns the issue, and what can be checked before the next cutoff time.
Smart buildings, utilities, and facilities
Facilities and utilities often have dense sensor networks. Edge AI for Real-Time Analytics can help detect leaks, abnormal flow, energy waste, equipment anomalies, occupancy changes, water quality events, or safety issues. Local processing matters because many readings are repetitive and only a small share need immediate attention.
The analytics layer should preserve enough context for review: site, equipment, time window, threshold, previous behavior, weather or load condition, and responsible team.
Retail, branches, and customer operations
Retail and branch teams can use edge signals from stores, POS systems, shelves, cameras, traffic counters, service queues, and local inventory systems. Edge AI may detect abnormal queue length, shelf gaps, unusual transactions, footfall changes, or product availability risk. Central analytics can compare stores, regions, campaigns, inventory, staffing, and customer behavior.
This is where analytics dashboard design matters. A store manager needs a simple next step. A regional manager needs comparison. Headquarters needs trend, root cause, and policy learning.
Financial, healthcare, and regulated operations
Some use cases require stricter governance. Fraud signals, medical operations, patient flow, branch risk, and regulated reporting may benefit from local detection, but the organization still needs controlled access, audit trails, traceable definitions, and human review. Edge AI can help surface the signal. It should not hide the reasoning or remove accountability.
In these settings, teams should pair Edge AI for Real-Time Analytics with data governance platform, data quality software, and data quality monitoring tools practices. The AI result is only as useful as the data definitions, permissions, lineage, and review process behind it.
Examples and Templates
The demo cards below come from the Gallery demo file. They are not all "Edge AI products" by themselves. Use them as practical learning examples for Edge AI for Real-Time Analytics because they show the kinds of operating views, monitoring patterns, exception lists, and management dashboards that edge signals should eventually feed.
Before copying a layout, ask what the edge signal is, what local AI should detect, what the dashboard should explain, and what action the team should review.
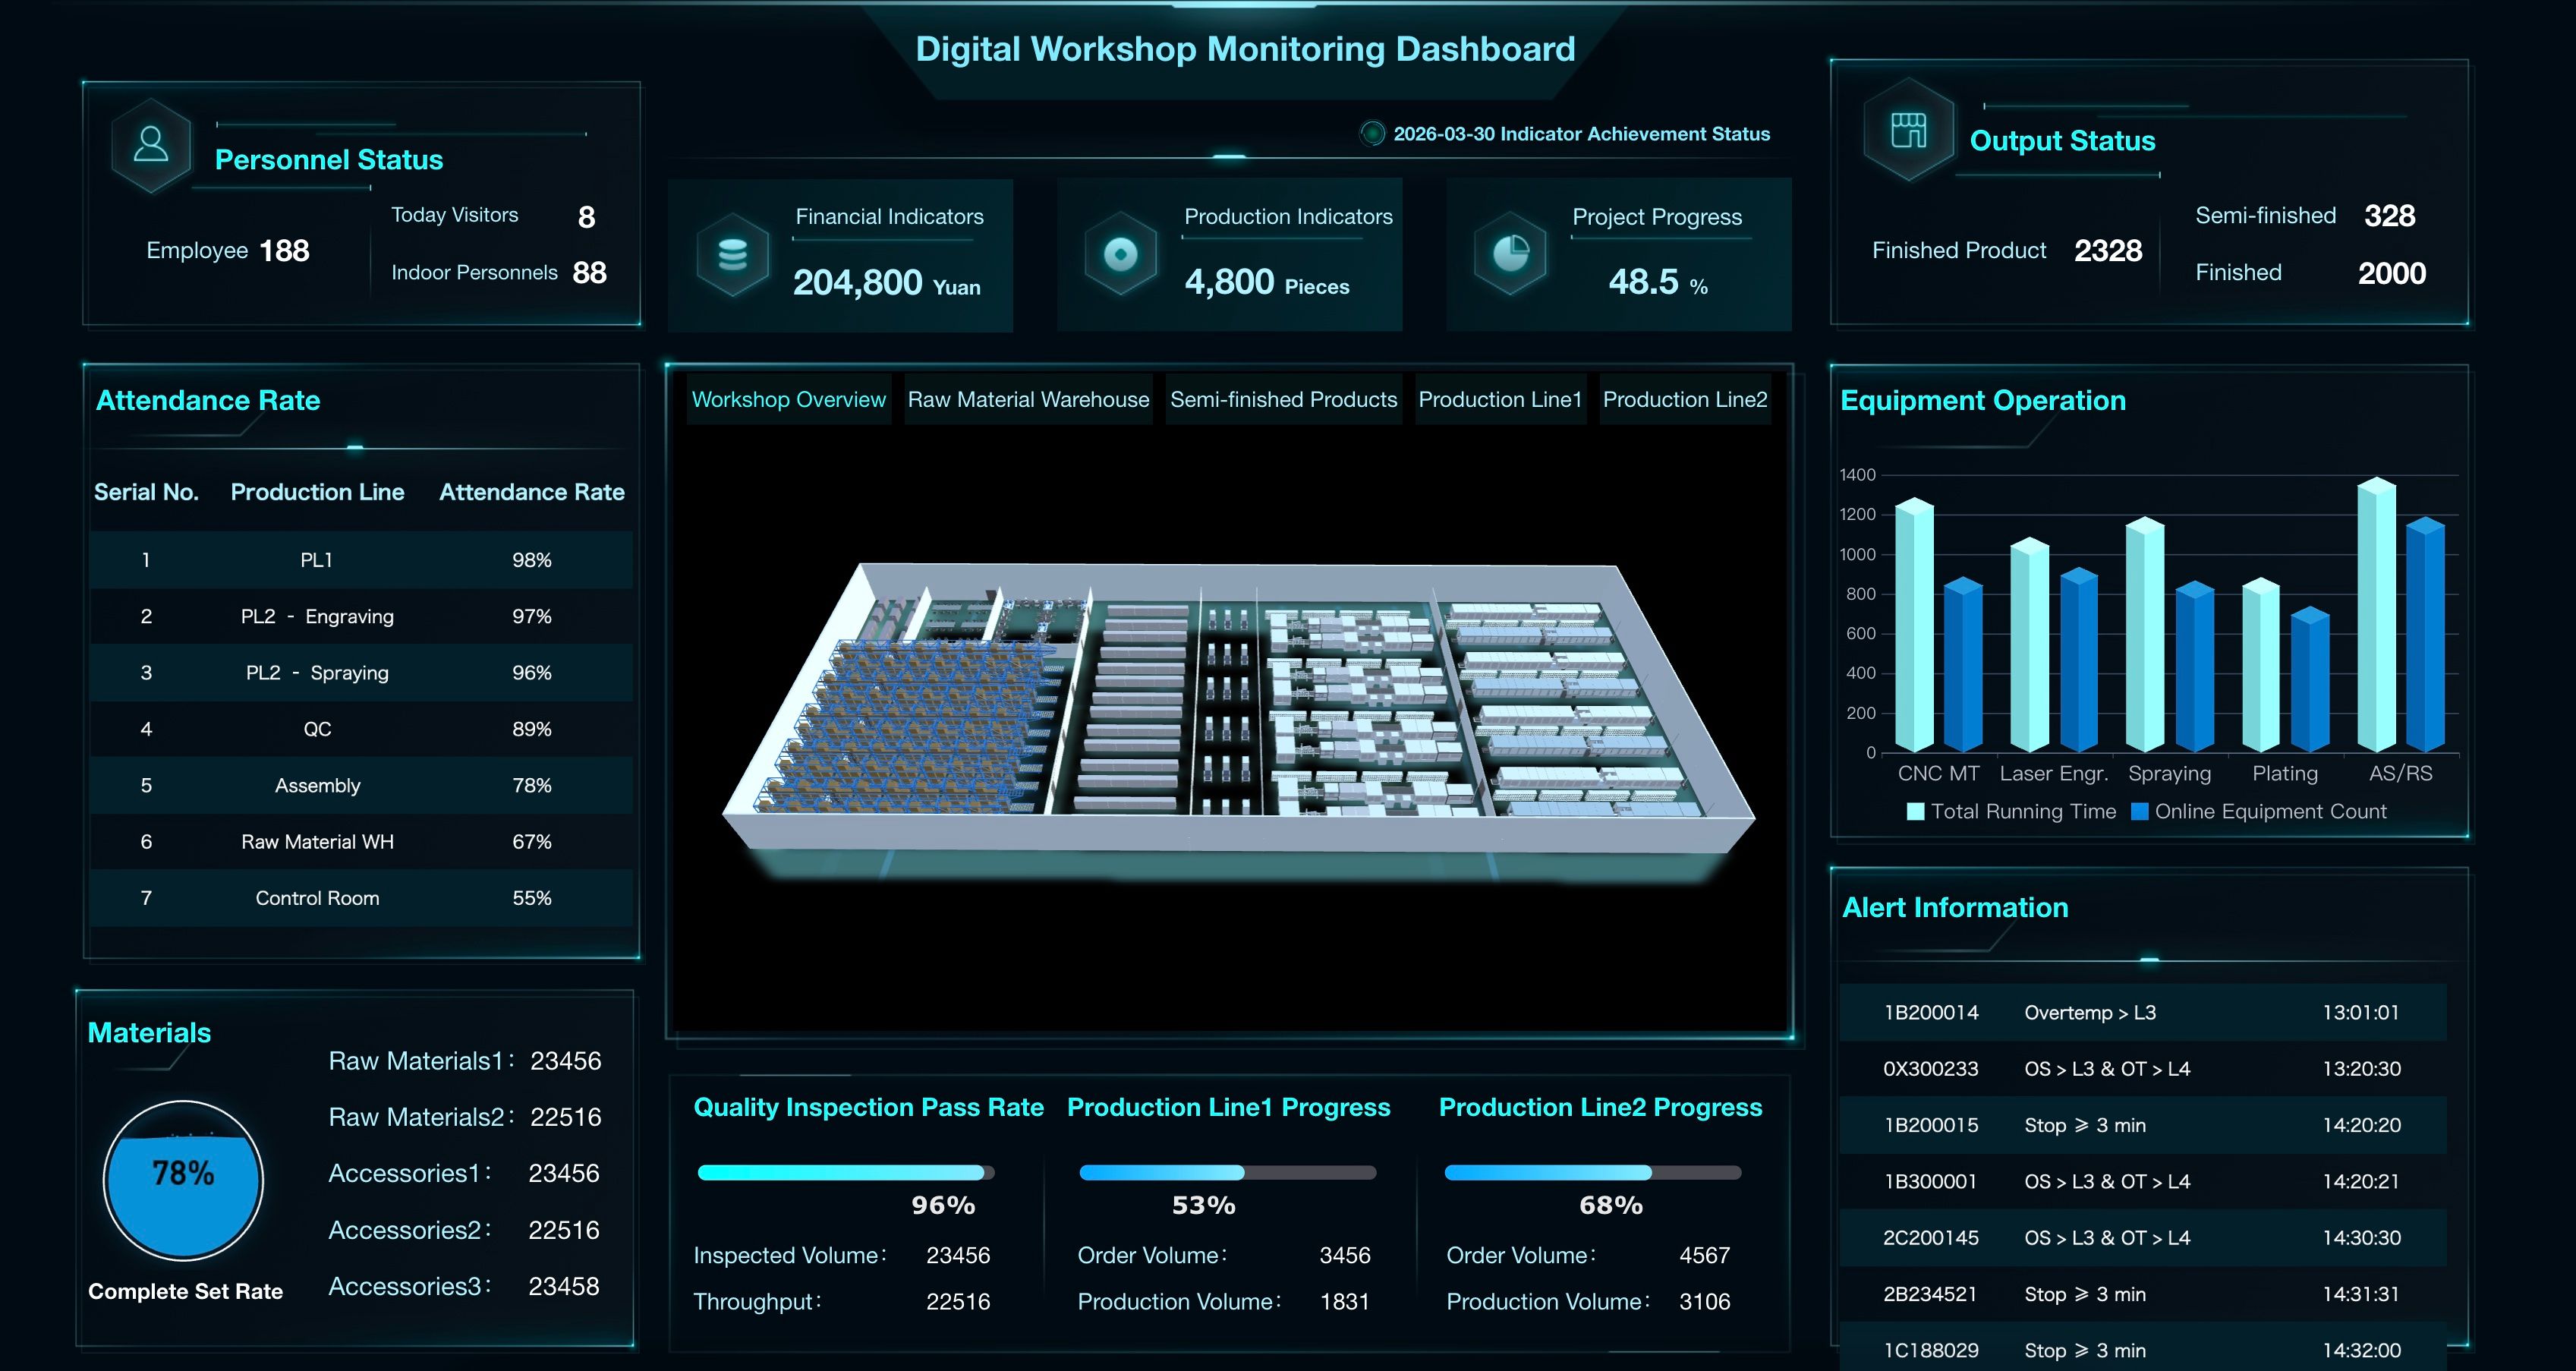
Digital Workshop Monitoring Dashboard

Smart Factory Control Hub
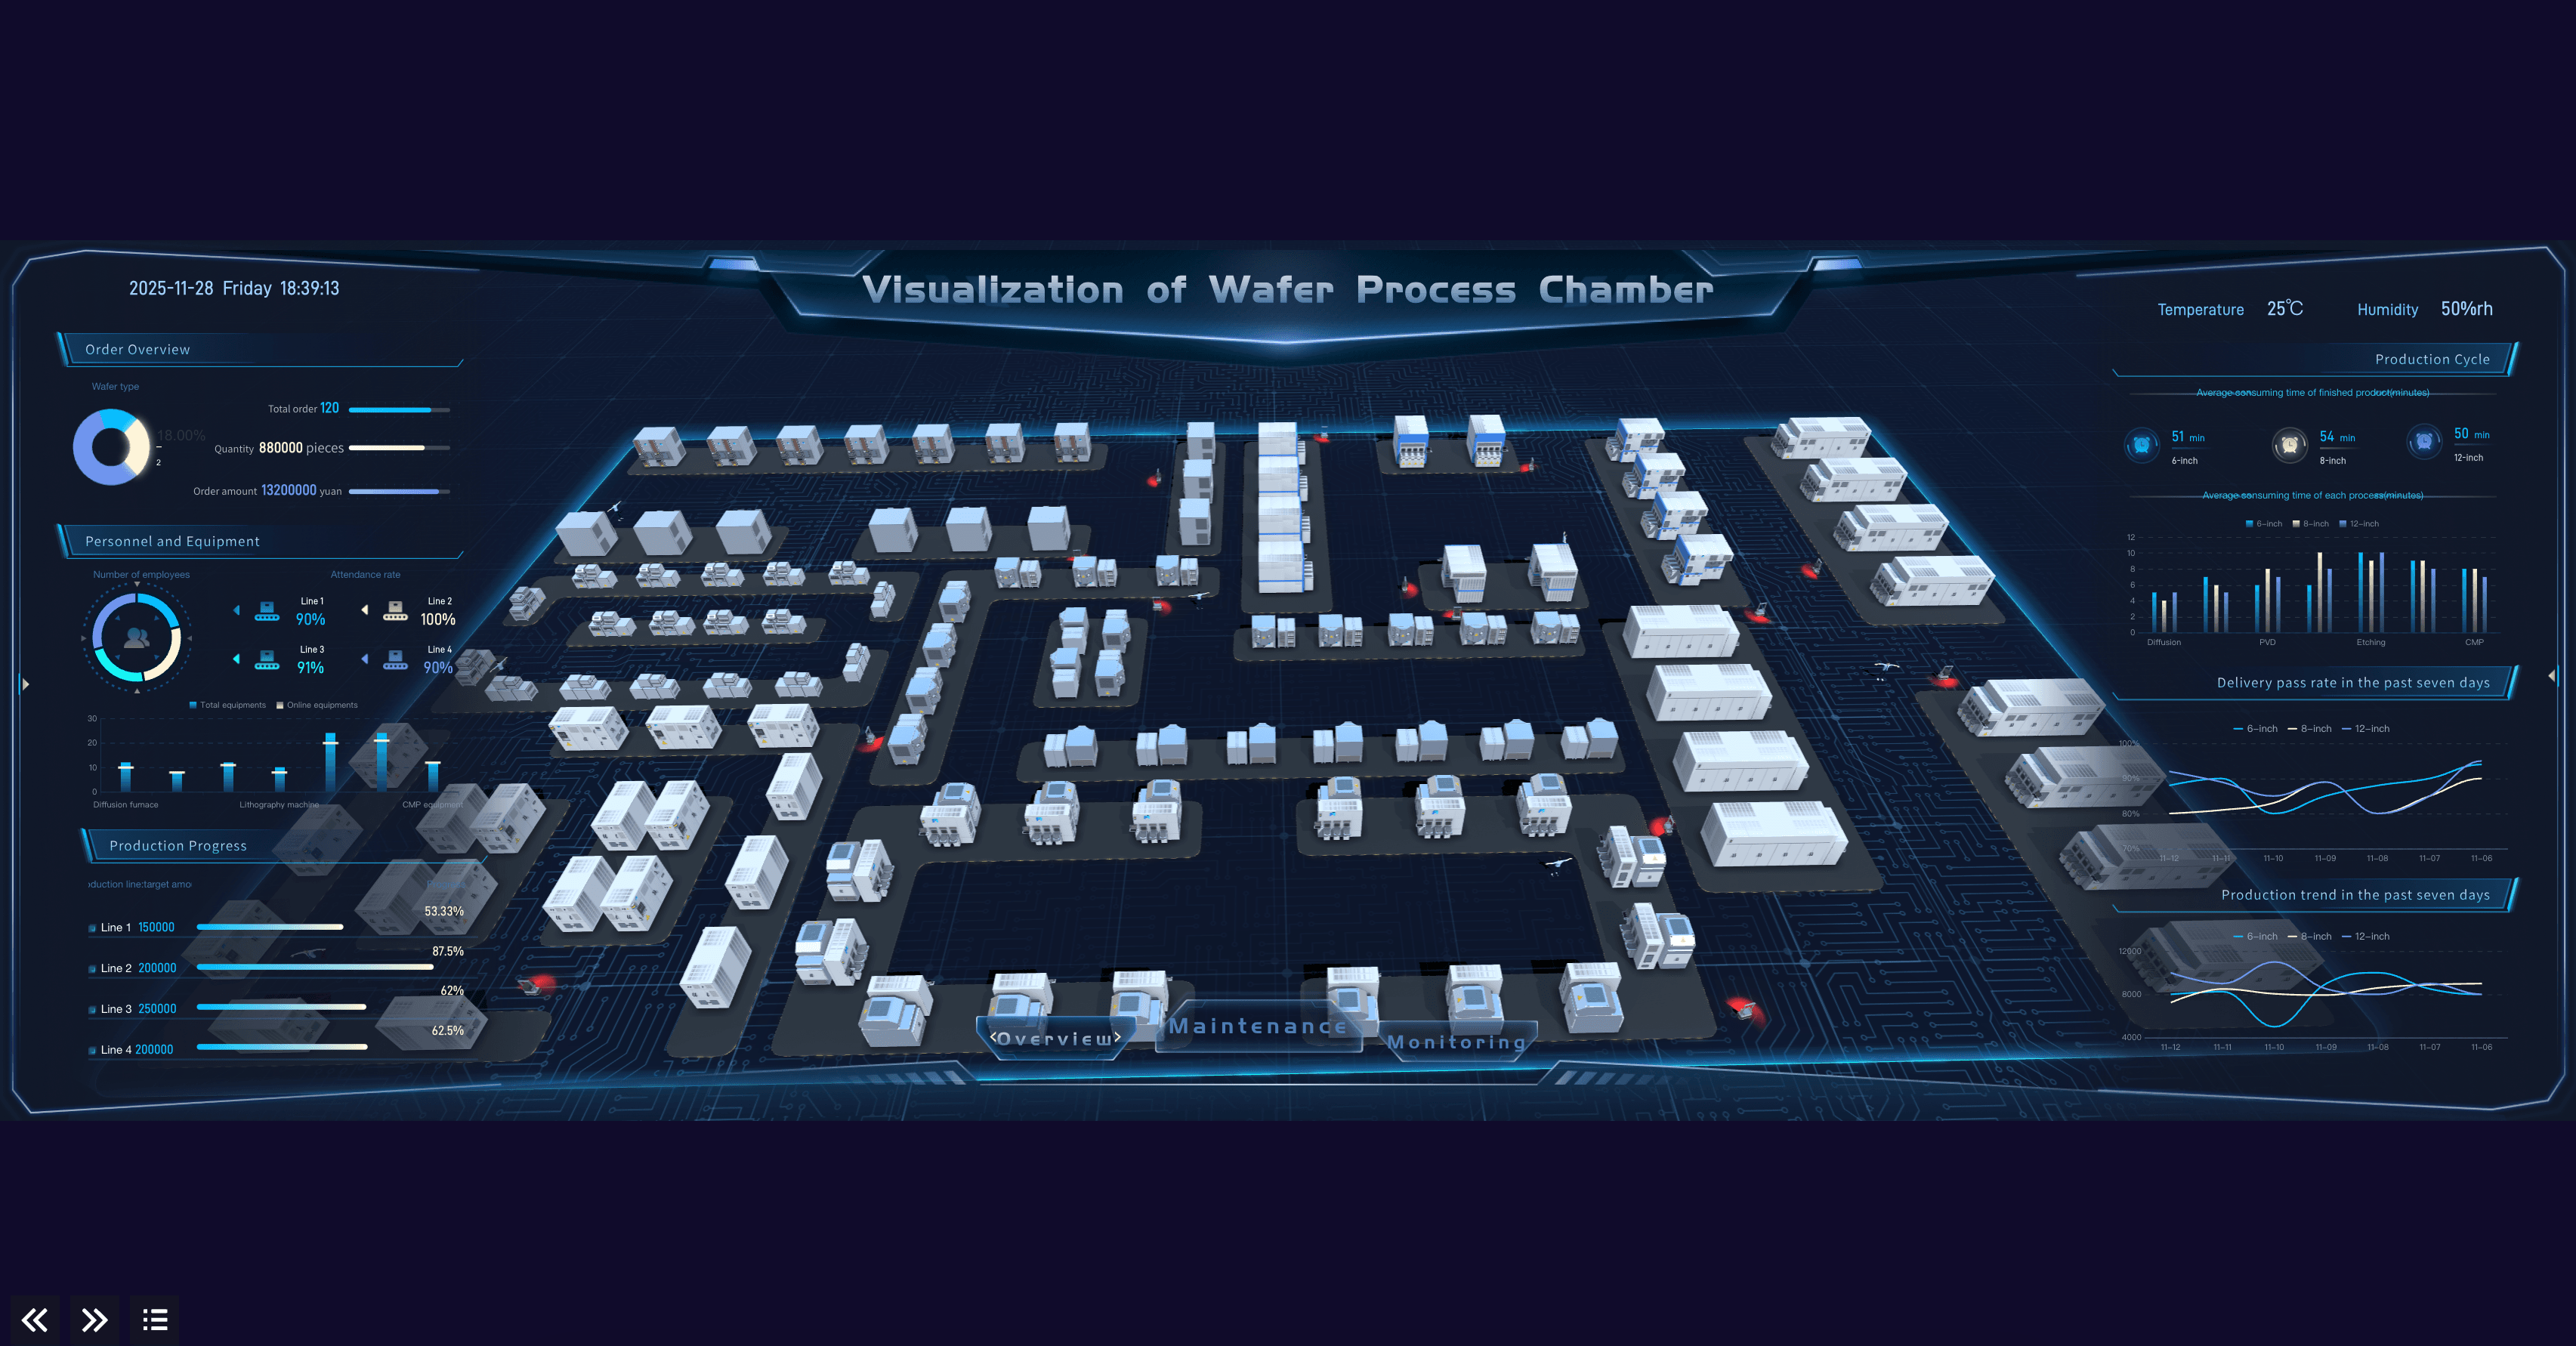
Visualization of Wafer Process Chamber
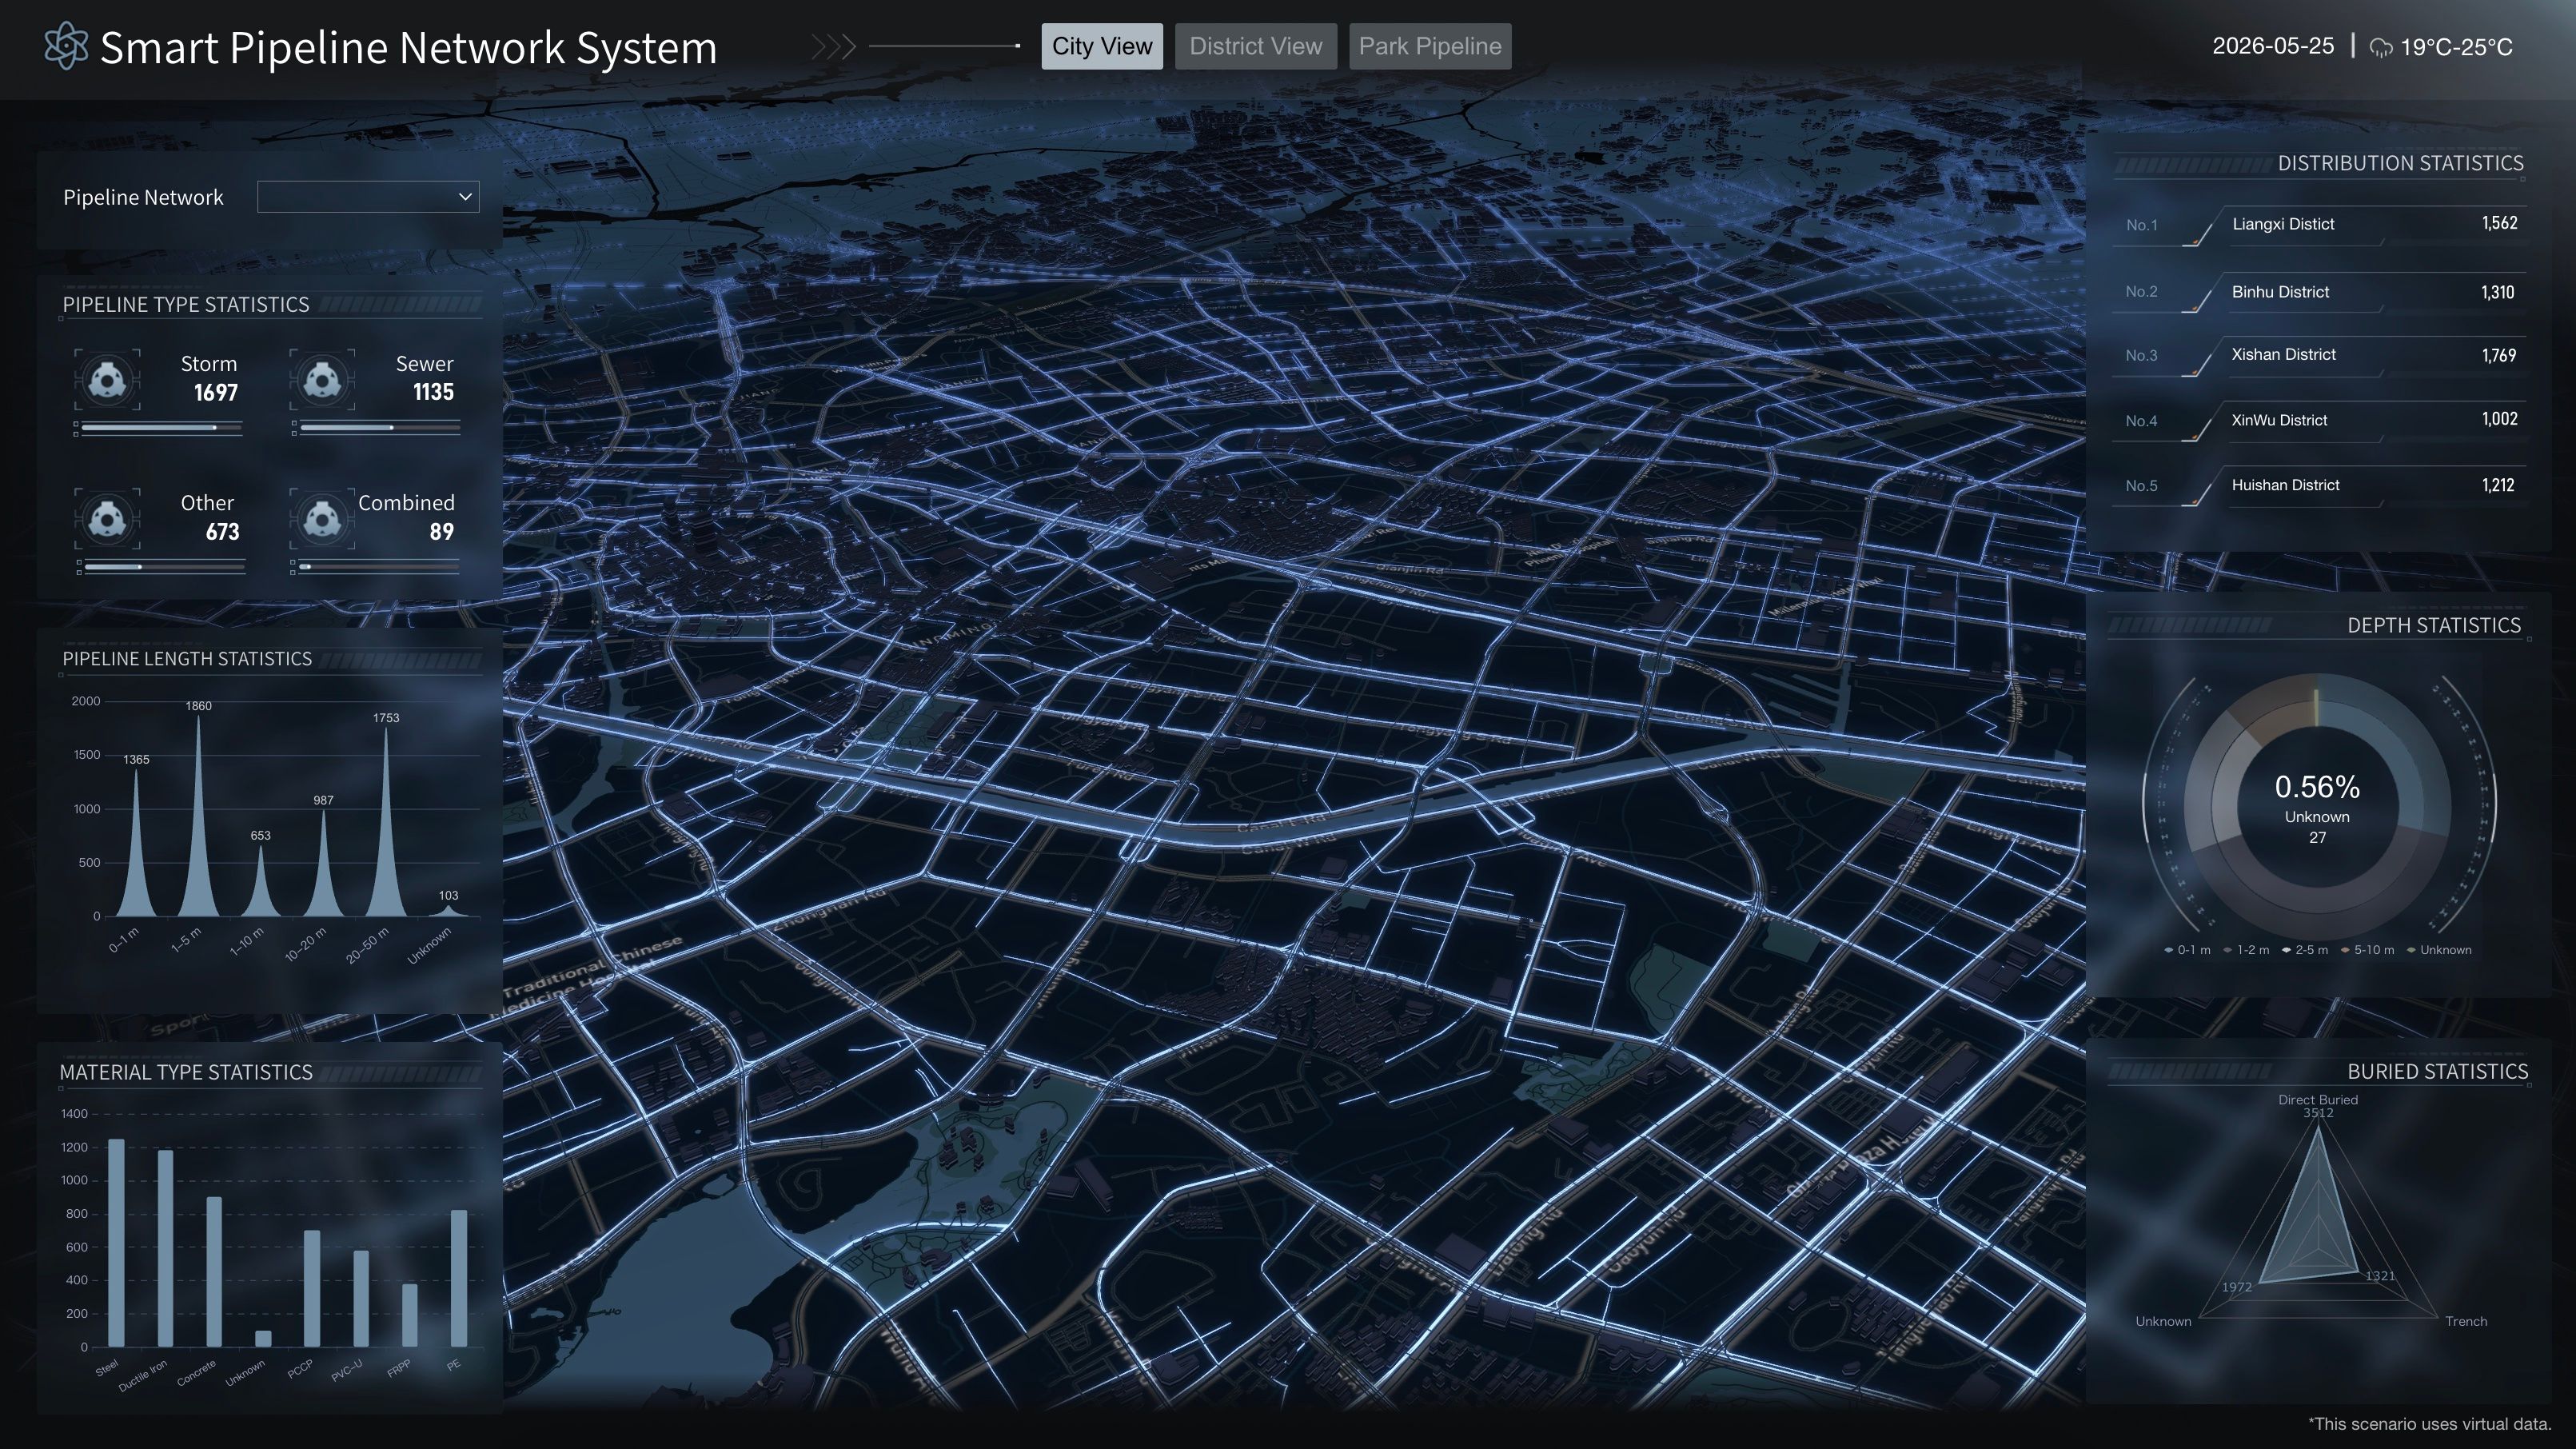
Smart Pipeline Network System
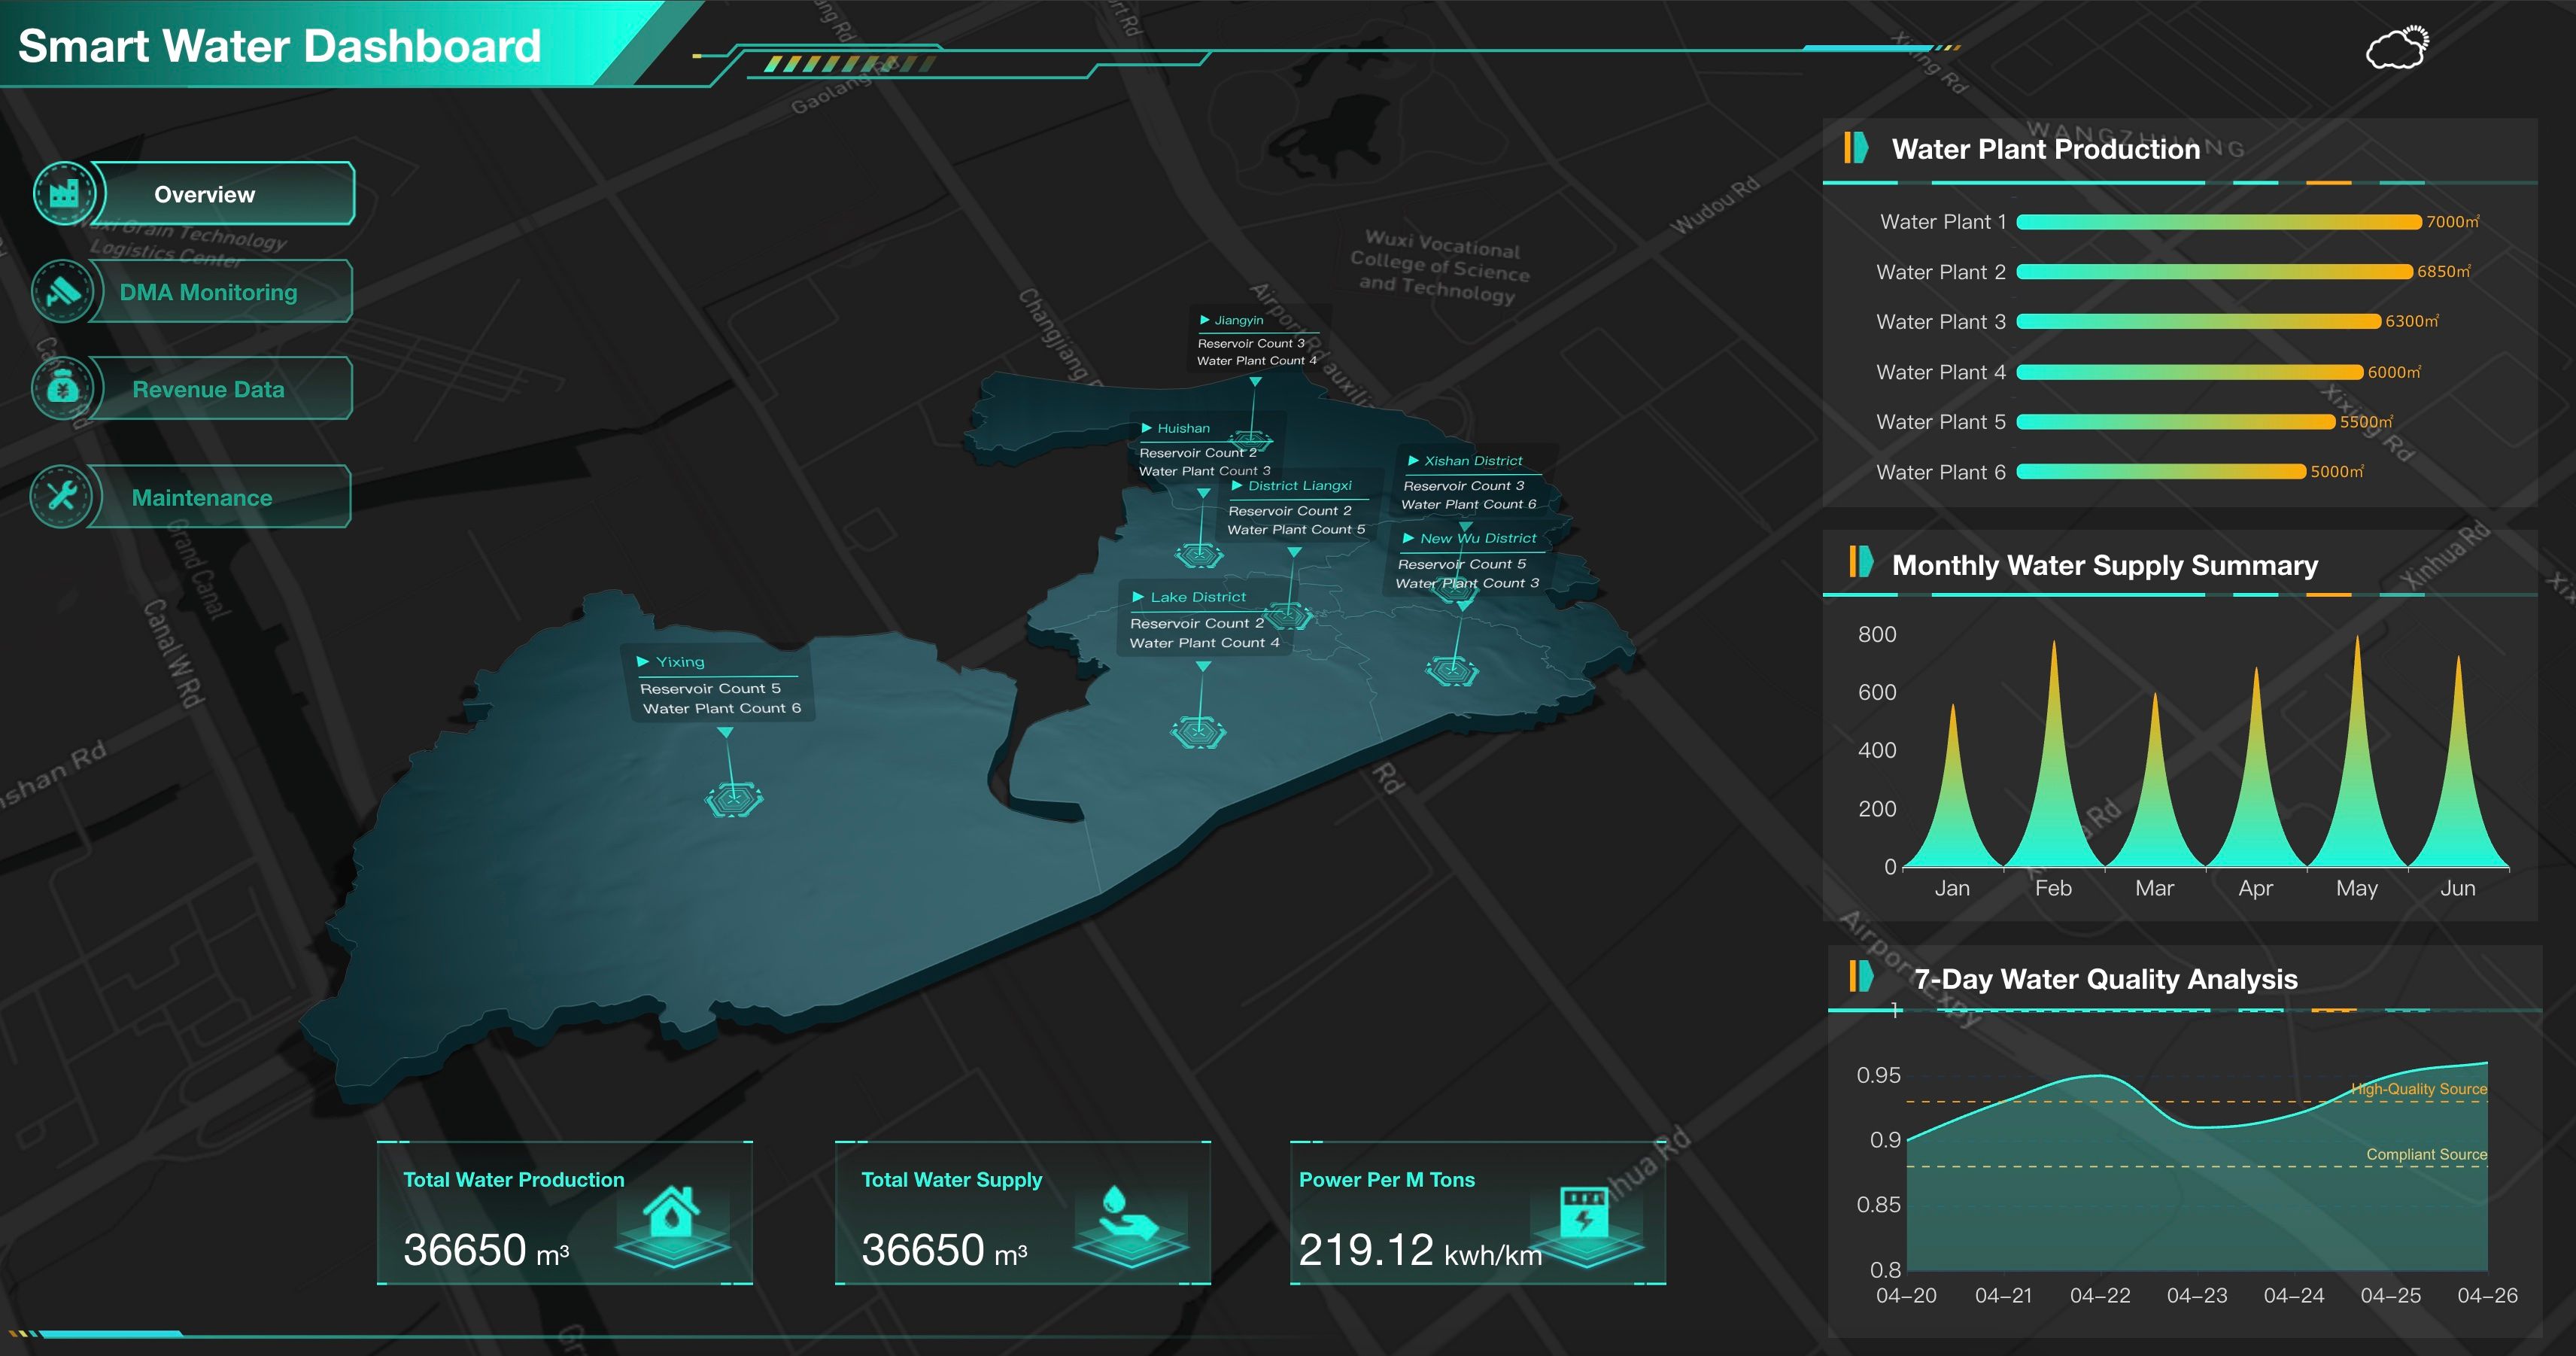
Smart Water Dashboard
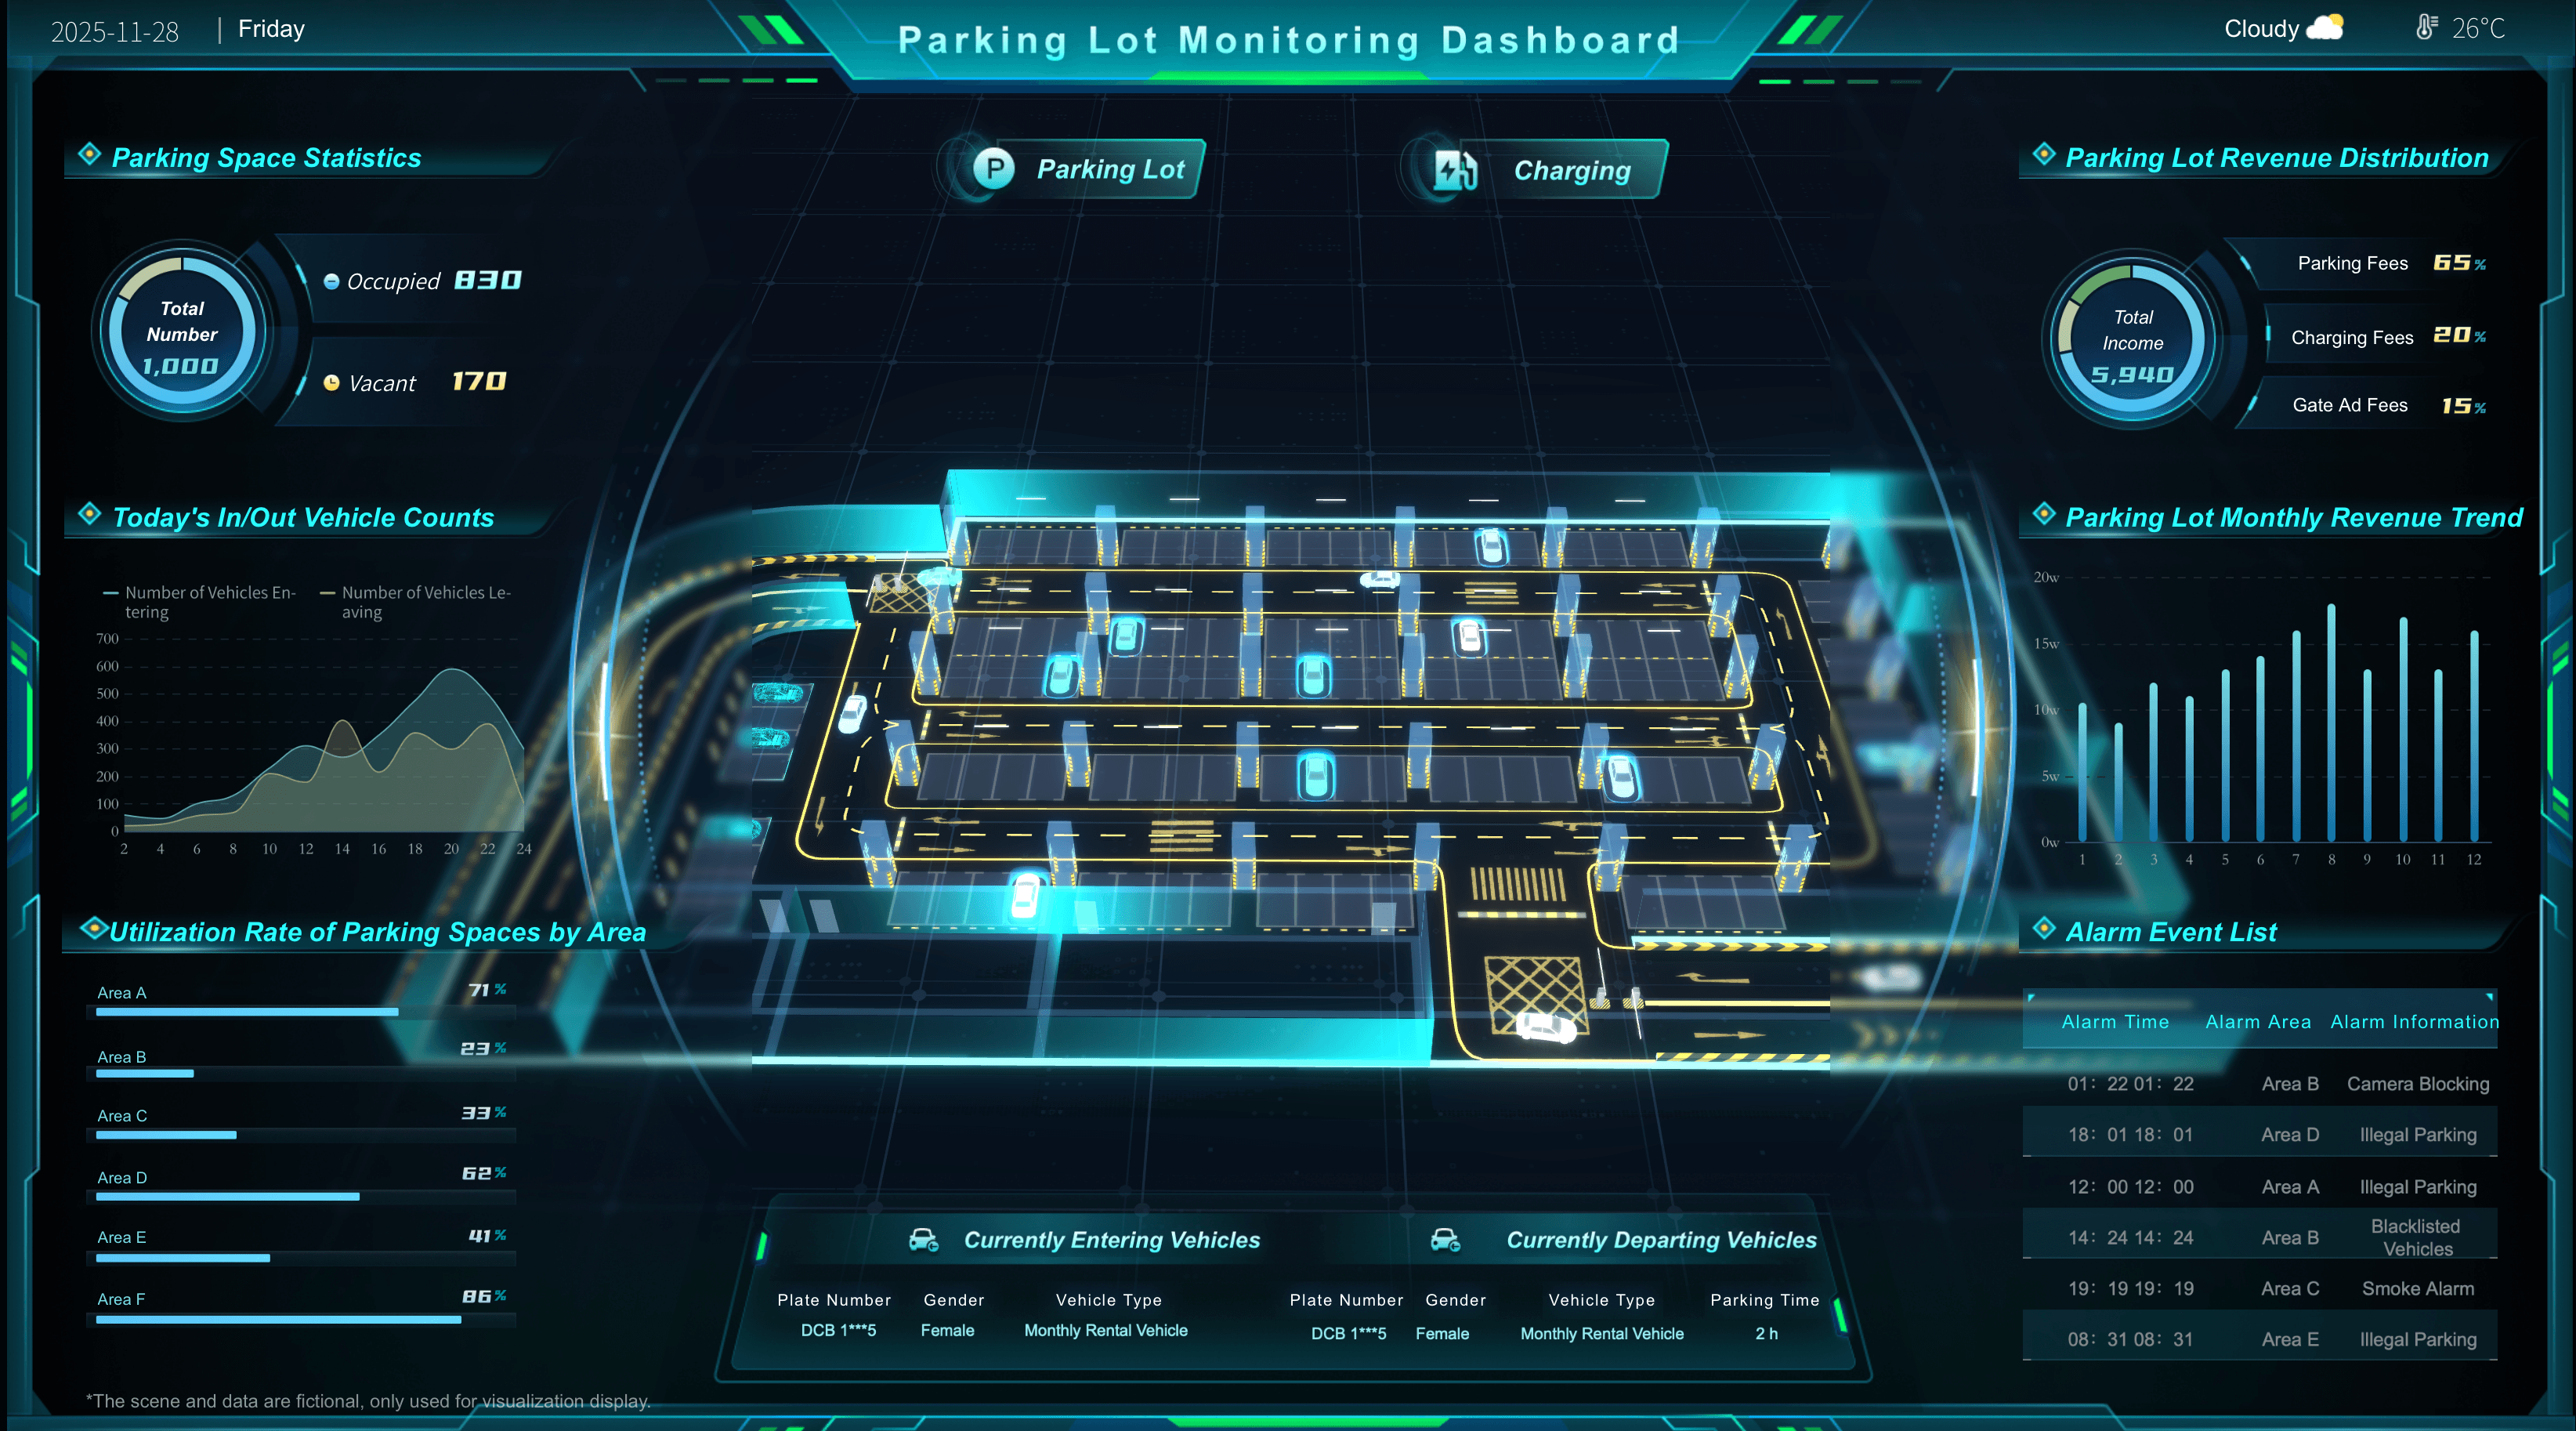
Real Time Occupancy Monitoring
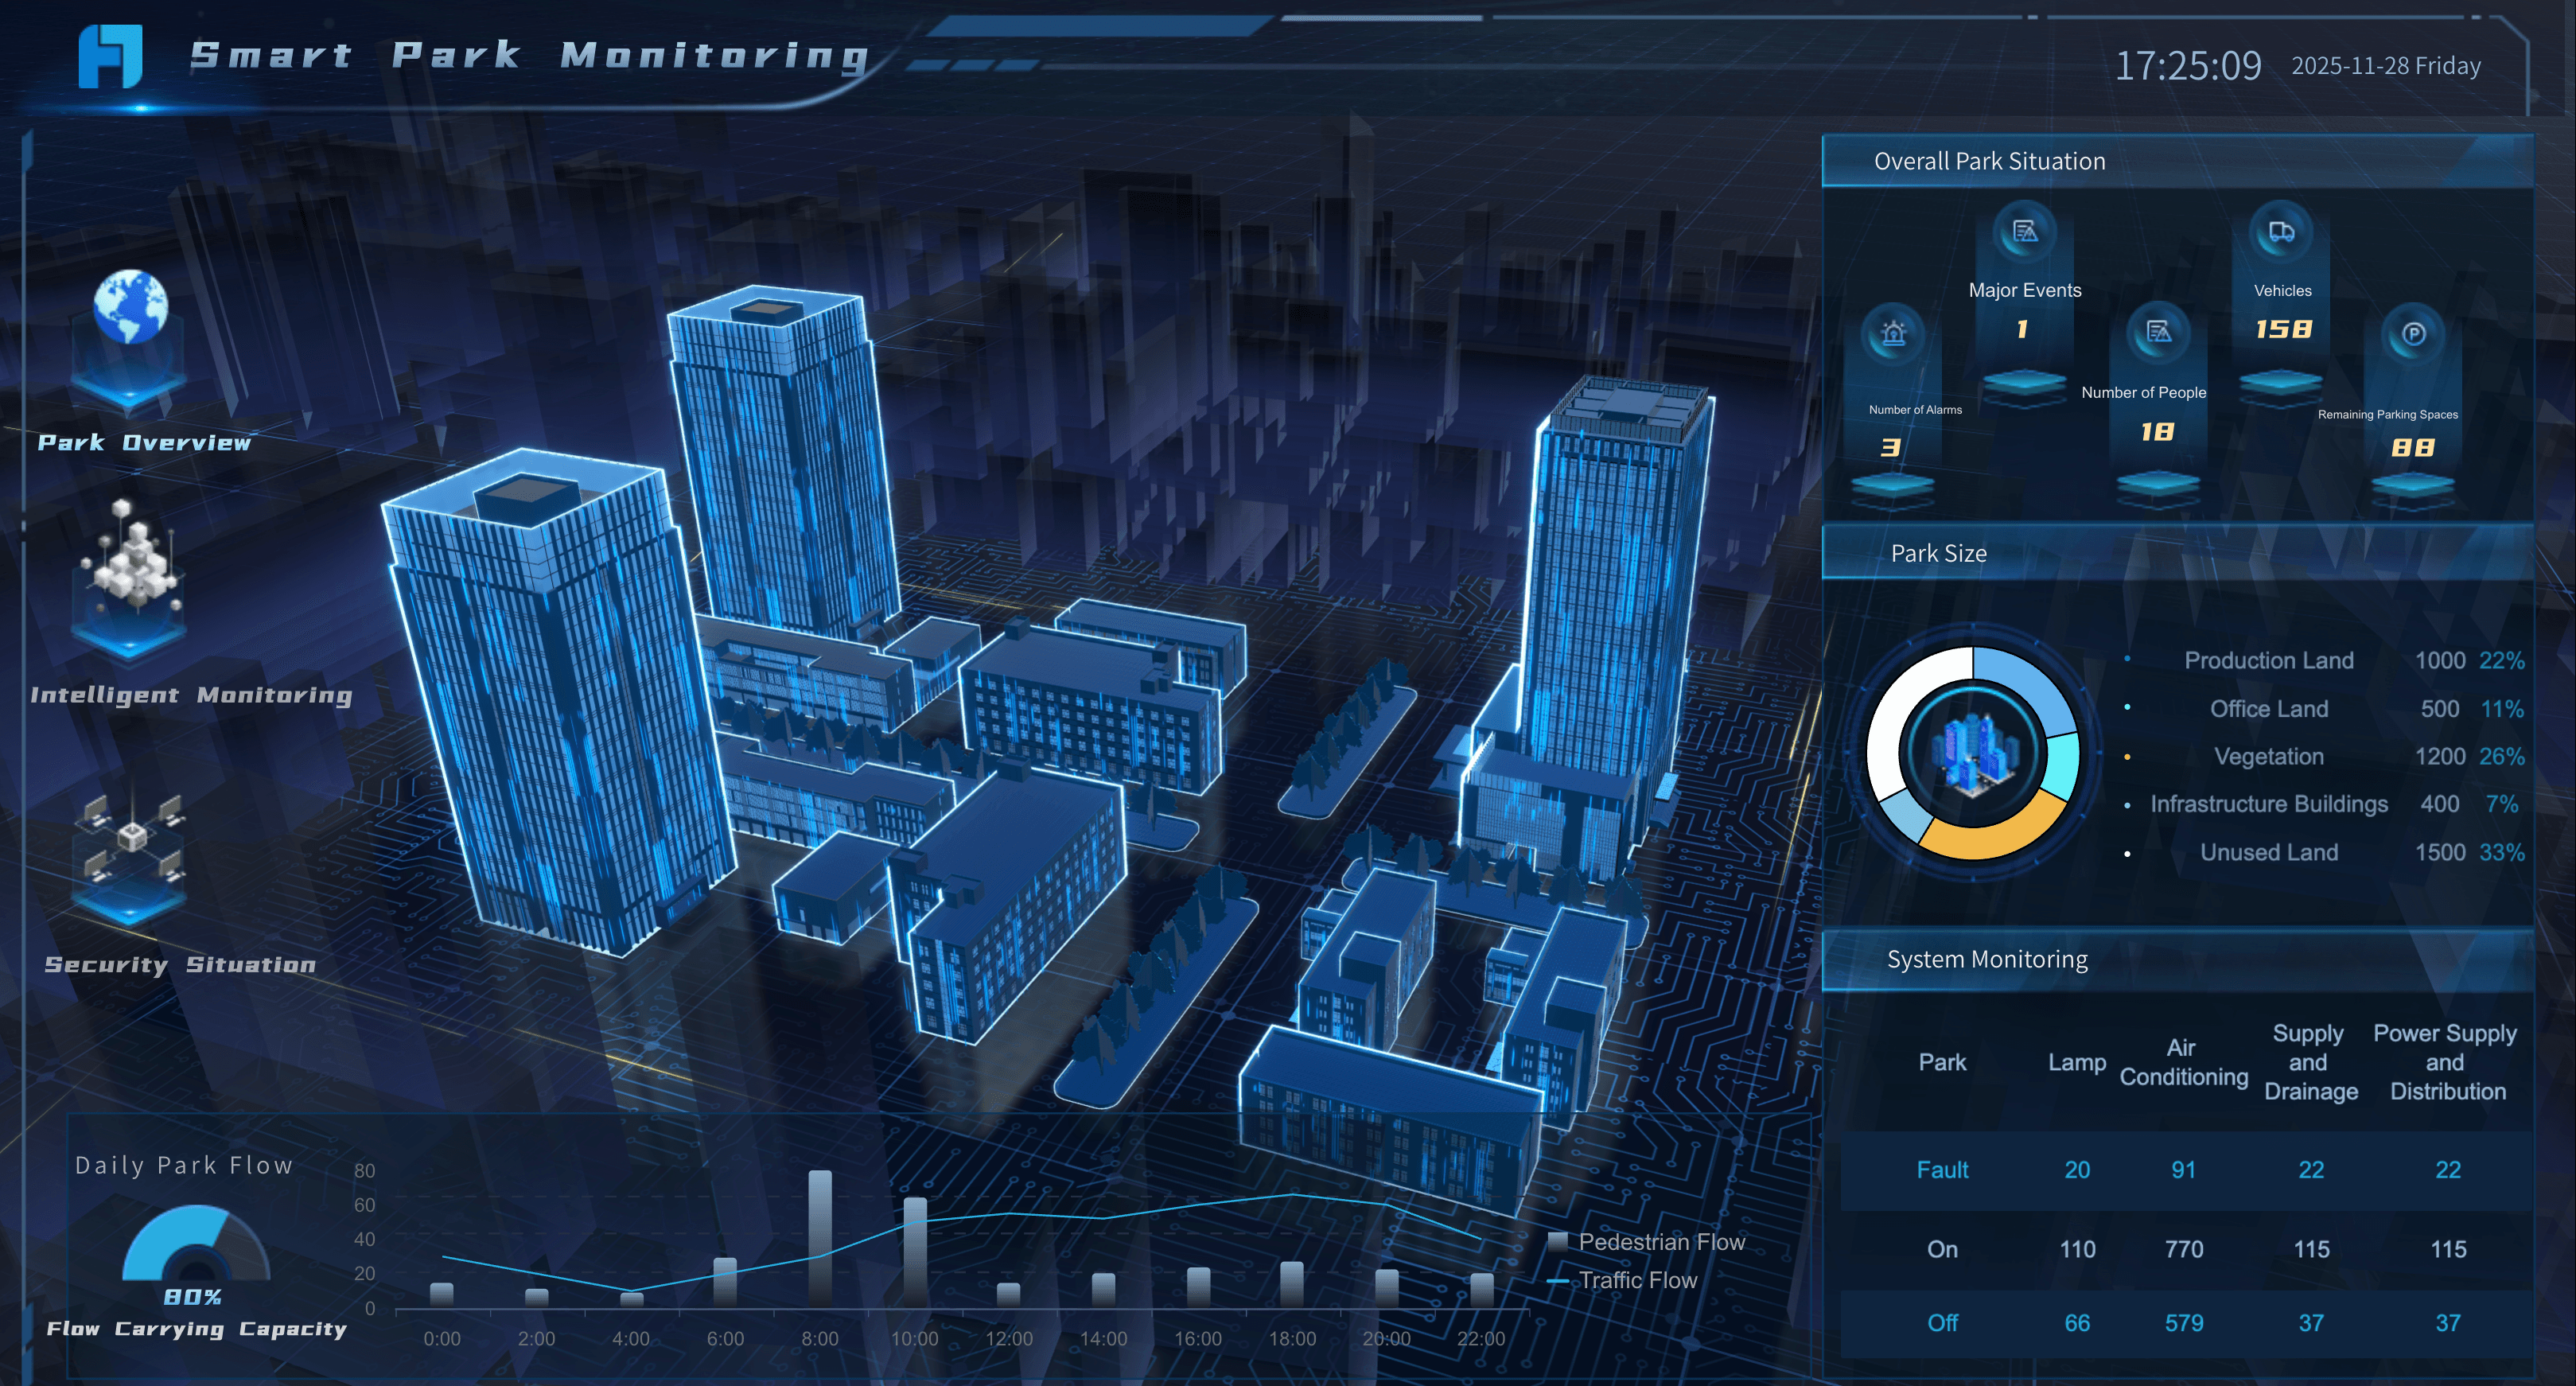
Smart Park Monitoring

Airport Ground Handling Dashboard
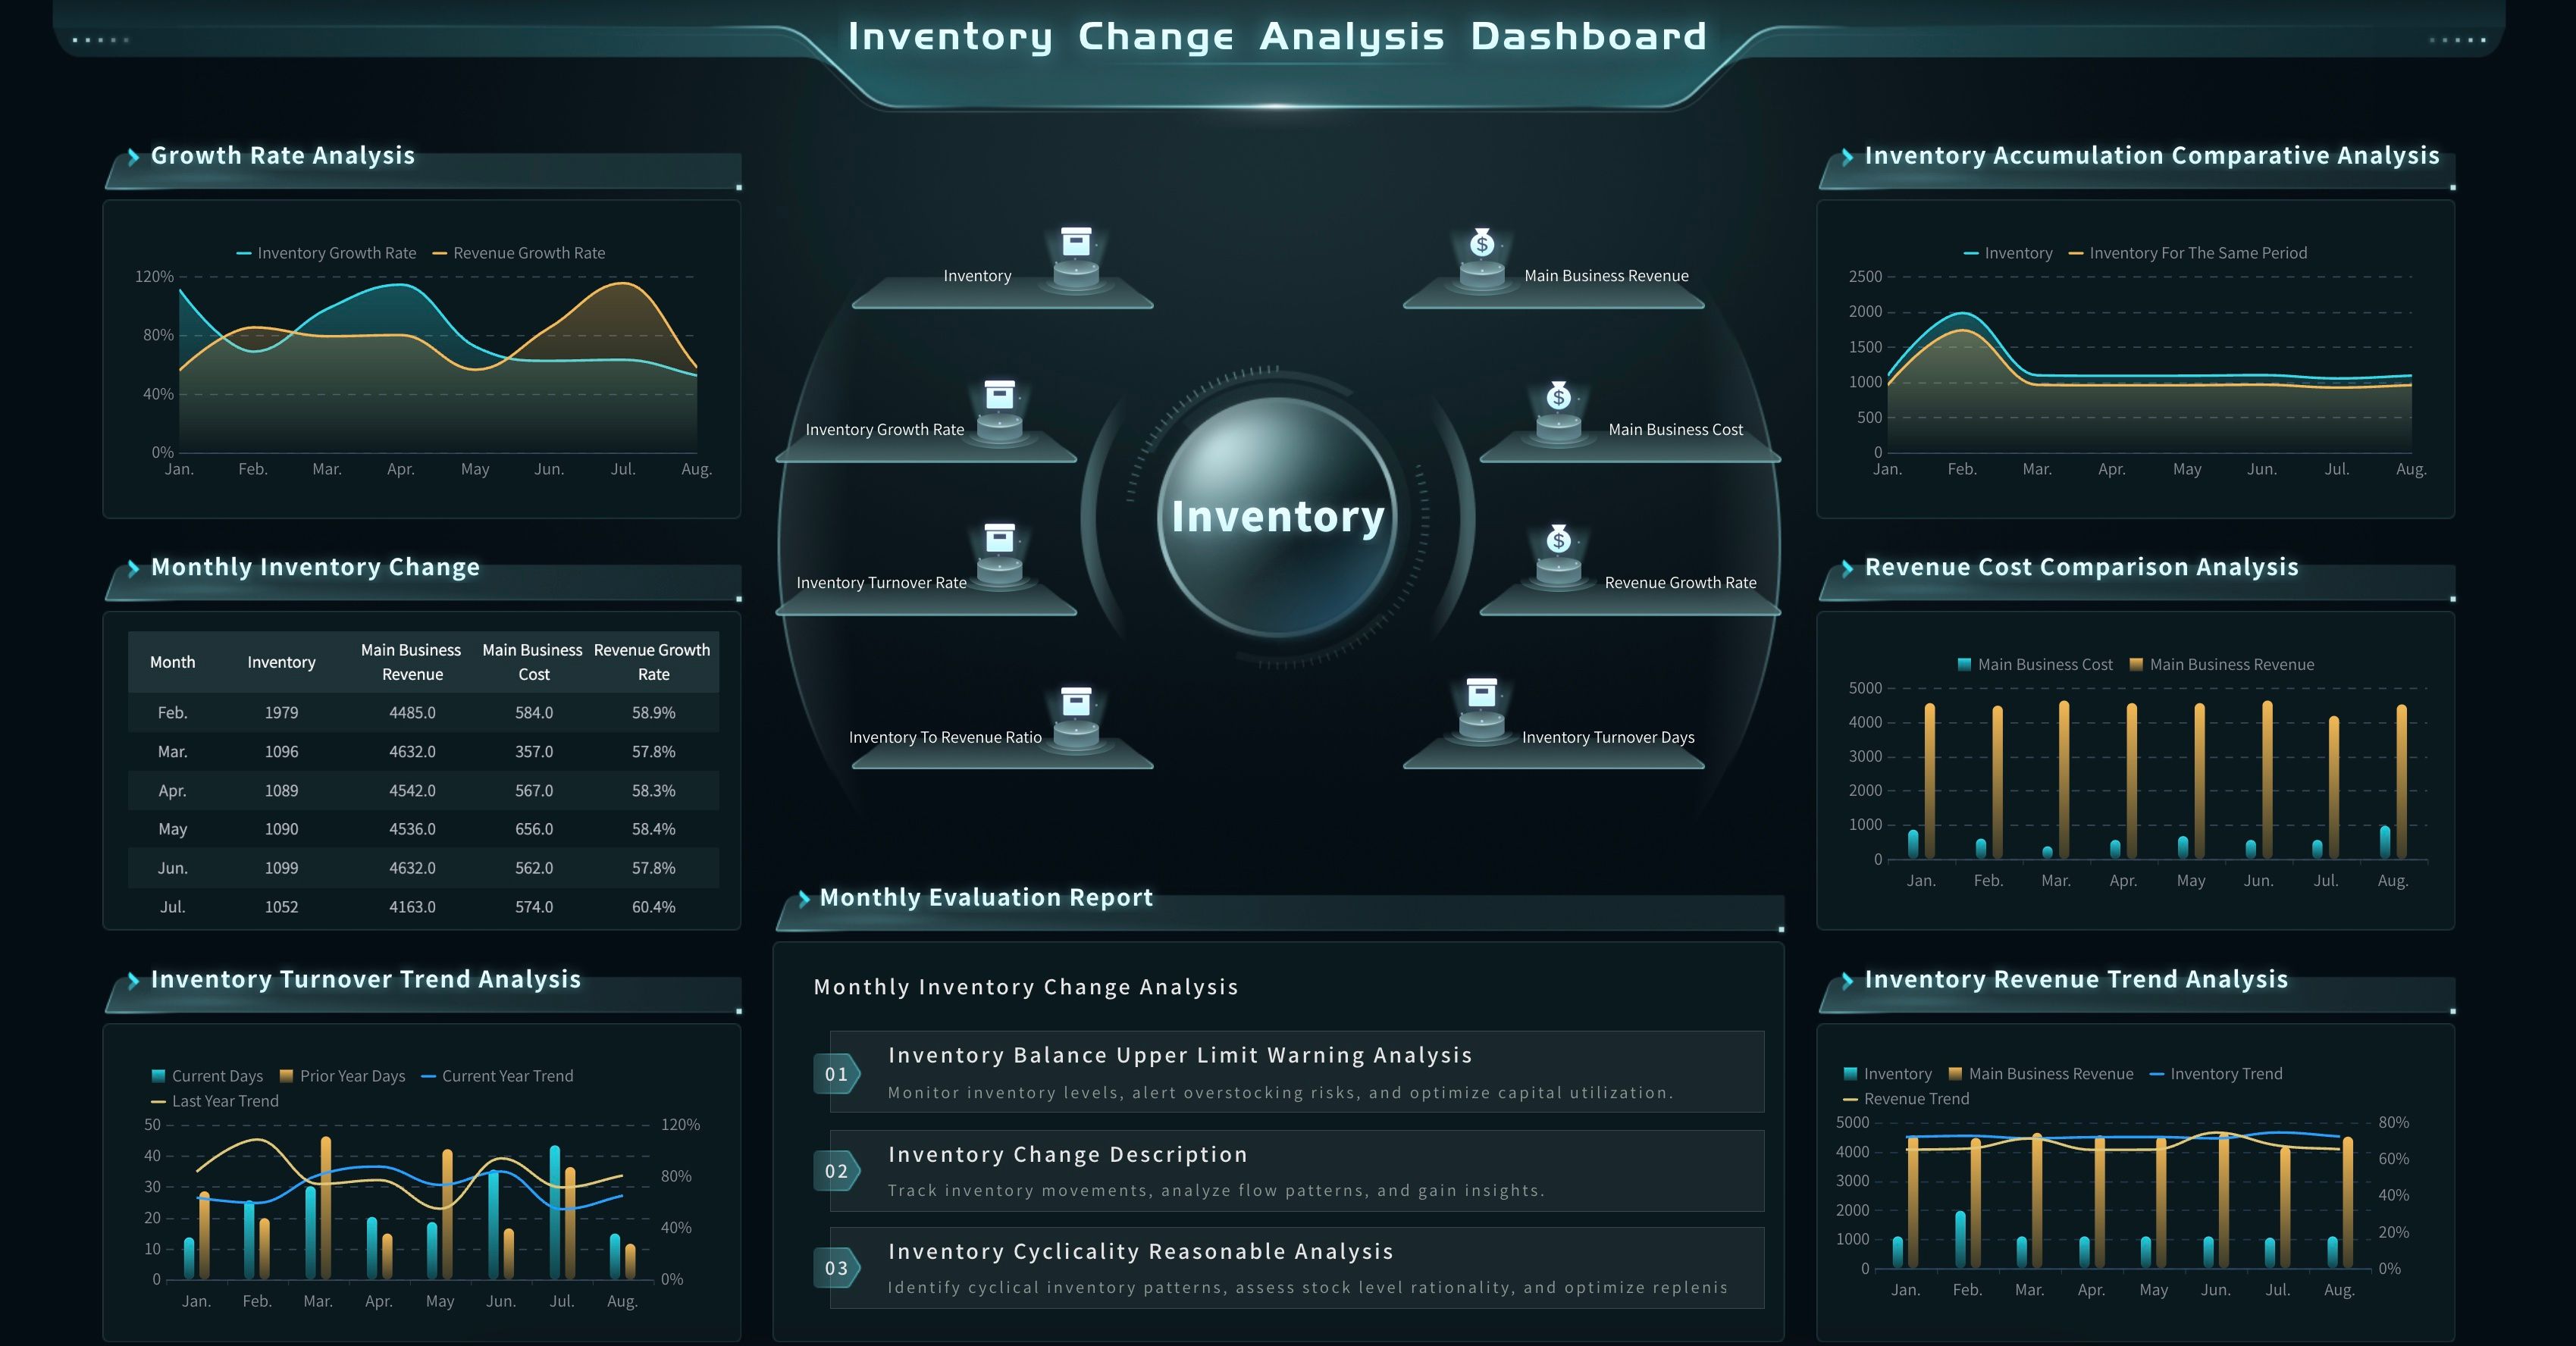
Inventory Movement Analysis Dashboard
Requirements
Edge AI for Real-Time Analytics usually fails for ordinary reasons: unclear data ownership, weak event definitions, untested thresholds, missing source context, and dashboards that do not show what to do next.
Before building, define these requirements:
Decision Window
Definition Milliseconds to daily briefings depending on business action speed.
Why it matters “Real-time” must align with operational decision cycles.
Edge Signal
Definition Sensor, image, log, event, transaction, or device status data.
Why it matters Users must understand what the AI is actually interpreting.
Local Rule or Model
Definition Thresholds, classifiers, anomaly detection, forecasts, and routing logic.
Why it matters Enables validation of false positives and false negatives.
Event Payload
Definition Structured event fields including time, entity, metrics, score, and ownership.
Why it matters Ensures downstream analytics usability and consistency.
Data Freshness
Definition Latency, timestamps, sync status, and data delay rules.
Why it matters Prevents misinterpretation of stale data as real-time insight.
Permission Model
Definition User, agent, BI, and system-level access rules.
Why it matters Prevents AI from bypassing governance constraints.
Source Traceability
Definition Lineage across dashboards, datasets, models, and rules.
Why it matters Ensures auditability and trust in outputs.
Human Checkpoint
Definition Ownership of confirmation, escalation, and override actions.
Why it matters Keeps humans accountable for final decisions.
This requirement work is not paperwork for its own sake. It is how teams prevent a local AI signal from becoming an unreviewable alert. Edge AI should help users notice important movement earlier, but it should also give them enough context to trust, question, or reject the suggestion.
Workflow
Edge AI for Real-Time Analytics becomes useful when it forms a closed loop. A signal appears, AI interprets it, the analytics layer explains it, an owner reviews it, and the system learns from the result.
Use this workflow as a practical build path:
- Choose one recurring operational question. Start with a focused question such as "Which production line exceptions need review in the next 30 minutes?" or "Which facility alerts should be escalated before the shift ends?"
- Map the edge data. List the devices, sensors, cameras, logs, gateways, local systems, and event fields involved.
- Define the first AI judgment. Decide whether the AI detects anomaly, classifies event type, predicts risk, scores severity, filters noise, or recommends a check.
- Create the event record. Include source, timestamp, asset, site, metric, score, rule, model version, confidence, and business owner where possible.
- Connect the analytics view. Build a dashboard or report that shows trend, comparison, affected entity, source context, and open exceptions.
- Generate guided insight. Let the AI data agent summarize what changed, likely drivers, confidence limits, and follow-up questions.
- Push to the right owner. Route the issue to production, quality, maintenance, supply chain, operations, facilities, finance, service, or leadership.
- Capture review feedback. Track whether the alert was useful, false positive, duplicate, late, missing context, or ready to become a recurring rule.
The workflow should be small enough to test. A first project that catches one high-value risk is better than a large AI initiative that collects every signal but changes no decision.
Example prompts for a governed AI data agent:
- "Summarize the top Edge AI for Real-Time Analytics alerts from the last shift. Group them by plant, line, severity, source system, likely cause, and unresolved owner."
- "Show abnormal equipment behavior detected today. Compare downtime, maintenance backlog, production priority, and affected orders."
- "Create a briefing for facility managers. Include occupancy anomalies, energy spikes, device alerts, and actions that still need review."
- "Find inventory movement exceptions that may affect tomorrow's production plan. Include material, work order, stock level, inbound commitment, and responsible department."
- "Explain which AI-generated alerts were confirmed by humans last week and which rules need adjustment."
These prompts work only if the agent has access to governed data assets, metric definitions, business terms, permissions, and source records. Without that foundation, a prompt can sound fluent while still being wrong.
Metrics of Edge AI for Real-Time Analytics
Edge AI for Real-Time Analytics metrics should measure both operational performance and AI usefulness. A model can look accurate in a lab and still create work for frontline teams if alerts are late, noisy, or poorly routed.
Track metrics in four groups:
Operating Performance
Metrics Downtime, defect rate, throughput, service delay, energy use, occupancy, delivery risk, inventory exposure.
Key question Is the business process improving over time?
Real-time Performance
Metrics Event latency, detection time, alert age, sync delay, and missed event rate.
Key question Is the system fast enough for timely decisions?
AI Quality
Metrics Precision, recall, false positives/negatives, confidence distribution, drift indicators, confirmed alert rate.
Key question Is the AI signal reliable and actionable?
Workflow Adoption
Metrics Response time, closure rate, repeat issues, briefing usage, unresolved alerts, user feedback.
Key question Are people actually acting on insights and alerts?
Do not stop at model metrics. A high precision alert that reaches the wrong owner is still a workflow problem. A fast detection that does not show source context may still fail in review. A beautiful chart built with disconnected definitions may still create argument in the next meeting.
A focused BI reporting layer can help turn edge events into recurring summaries. Teams can use reporting software to preserve review history, create scheduled briefings, and document what happened during a period. They can use data visualization tools to make patterns easier to inspect, but the metric design still has to start with the decision.
Challenges
Edge AI for Real-Time Analytics sounds technical, but the hardest problems are often organizational.
Too much signal, not enough decision logic
Edge systems can create a large volume of events. If every event becomes an alert, teams stop paying attention. Define severity, owner, threshold, duplicate logic, suppression rules, and escalation paths before expanding the signal set.
Unclear metric and event definitions
Terms such as "downtime," "abnormal," "late," "high risk," "active device," "occupied," "quality issue," and "confirmed alert" need written definitions. If each site calculates them differently, the central analytics layer will compare mismatched signals.
Model drift and changing operations
Operations change. Machines age. Suppliers change. Product mix changes. Store traffic changes. Weather, seasonality, campaigns, staffing, and maintenance schedules change. Edge AI models and thresholds need review after deployment.
Missing source context
An alert should show what signal triggered it, which rule or model interpreted it, what period it covers, what data may be missing, and where a human can inspect the underlying record. Without source context, users either over-trust or ignore the output.
Latency confusion
Some data is live, some is near real time, and some is refreshed by schedule. Mixing them without labels can mislead users. A dashboard may show a current machine alert beside yesterday's cost data. That is acceptable only if the time context is clear.
AI overreach
AI can detect, explain, suggest, push, and follow up. It should not make final operational, financial, safety, compliance, or customer decisions without human review. This is especially important when the output affects production stoppage, pricing, staffing, supplier escalation, patient care, fraud handling, or customer communication.
The practical fix is to make trust visible: source, metric, rule, owner, timestamp, permission, confidence, and review status. Edge AI for Real-Time Analytics should reduce uncertainty, not hide it.
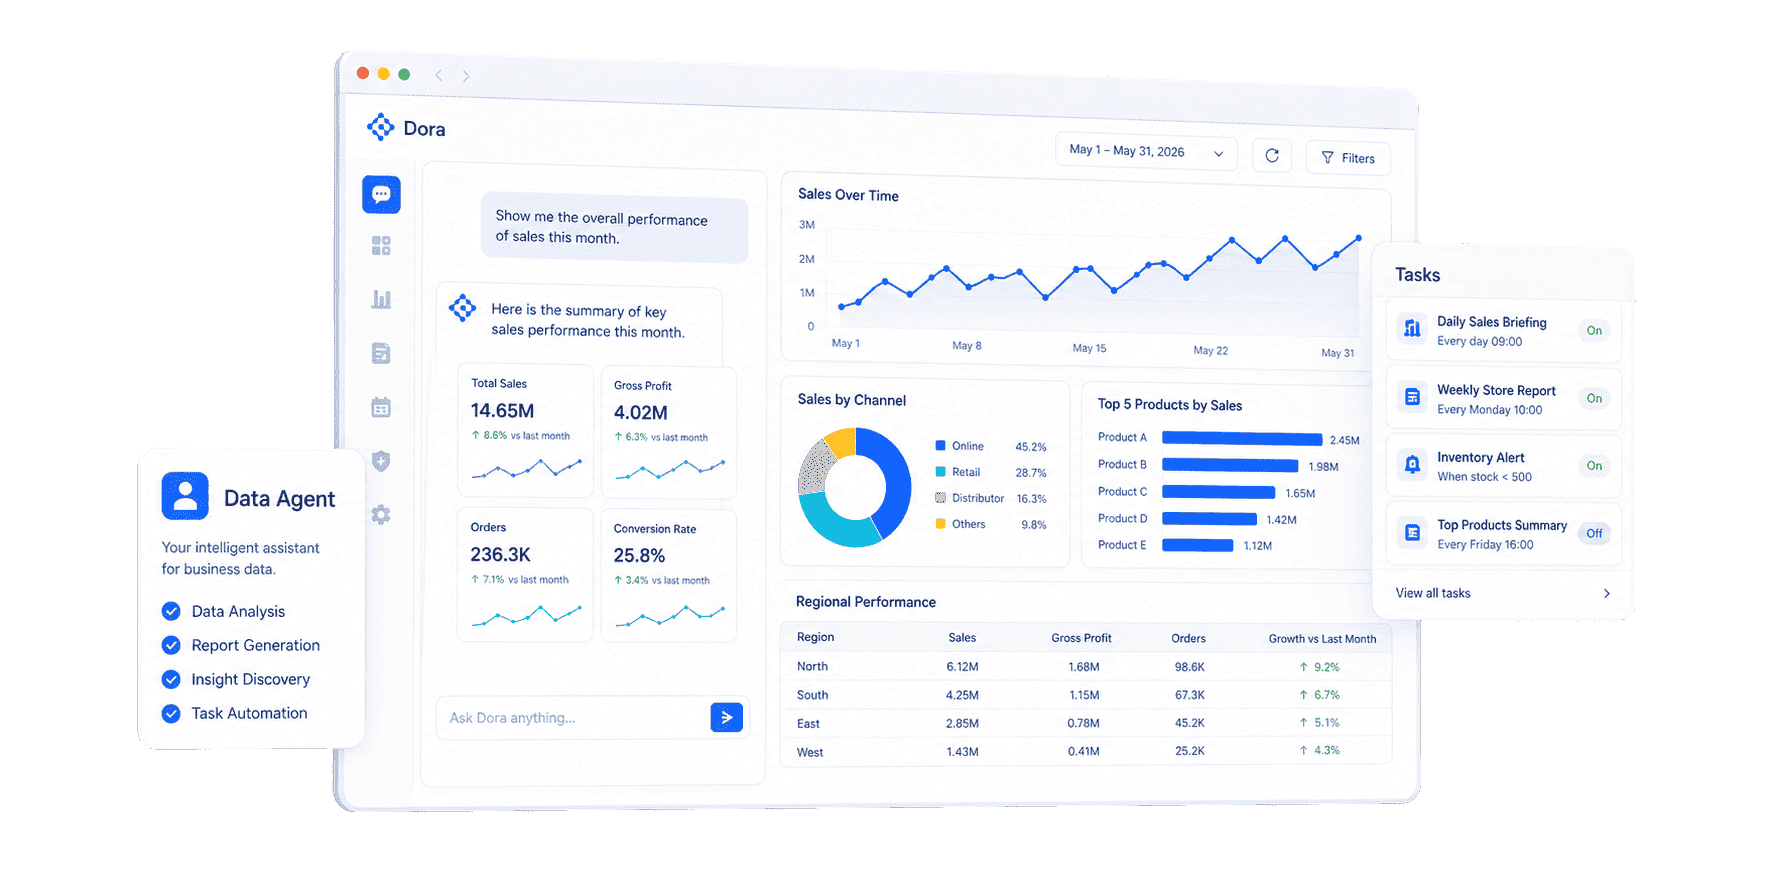
Edge AI for Real-Time Analytics with FineBI + Dora
After the Edge AI for Real-Time Analytics method is clear, FineBI + Dora can be introduced as a learning and operating layer rather than as a hard product pitch.
FineBI can support the governed analytics layer:
- Connect edge event summaries with ERP, MES, IoT, WMS, TMS, CRM, finance, facility, service, and spreadsheet data.
- Build reusable datasets, metric definitions, dashboards, drill-down paths, and management views.
- Create operational dashboard pages for frontline review and executive views for trend, cost, risk, and performance.
- Manage role-based access so users see the right site, device, department, order, customer, or financial data.
- Preserve historical comparison so teams can learn whether the edge signal is improving operations over time.
Dora adds the AI action layer above governed FineBI assets. As a data agent, Dora can help users ask natural-language questions, search existing FineBI dashboards, generate chart-based analysis, summarize real-time or near real-time exceptions, push scheduled briefings, and follow up with responsible owners. Dora should not replace analysts, operators, engineers, managers, or executives. It works best when it operates on trusted metrics, semantic rules, permissions, reusable Skills, source traceability, and human review.
For Edge AI for Real-Time Analytics, two useful Dora digital employees could be:
- Operations Insight Analyst: Answers follow-up questions about alerts, sites, devices, assets, orders, customers, cost impact, and performance movement using governed FineBI assets.
- Risk Alert Officer: Watches exception views, summarizes likely drivers, routes owner-specific issue lists, and prepares unresolved-risk briefings before the next review.
A closed-loop FineBI + Dora workflow could look like this:
- Retrieve trusted events and metrics: Dora reads configured FineBI assets, edge event tables, KPI definitions, metric dictionaries, source mappings, and permission rules.
- Detect meaningful movement: It compares current exceptions with targets, thresholds, previous periods, sites, assets, orders, or customer segments.
- Explain likely drivers: It points to dimensions worth checking, such as device, line, facility, route, product, material, supplier, campaign, or owner.
- Generate an insight briefing: It prepares a chart, short explanation, source context, data quality warning, and recommended review questions.
- Push to owners: It sends the relevant issue list to operations, quality, maintenance, supply chain, facilities, service, sales, finance, or leadership.
- Follow up and summarize: It tracks open questions, captures human feedback, and prepares a clearer summary for the next review.
This is where enterprise AI agents become practical. The value is not a generic chatbot that guesses from disconnected edge data. The value is a governed workflow where natural-language questions map to trusted BI assets, semantic rules, reusable Skills, permission-aware outputs, and human approval.
It also connects to the digital employee idea. A digital employee is useful when it has a clear job, a known data boundary, a repeatable workflow, and a human owner. In Edge AI for Real-Time Analytics, that job might be shift risk briefing, facility anomaly follow-up, production alert triage, inventory shortage review, or customer service threshold monitoring.
The commercial reason this scenario can work in a real enterprise is simple: scenario + product + service. Start with one recurring high-value decision, use FineBI to govern the analytics assets, use Dora to make insight and follow-up easier, and support rollout with data connection, semantic setup, KPI governance, Skills configuration, permission design, and user training.
For IT teams, the work shifts from manually answering every alert question to maintaining data connections, event models, semantic rules, permissions, and reusable AI workflows. For business users, the wait between a signal and a useful first analysis becomes shorter. For executives, the review becomes clearer: what changed, why it matters, who owns the next step, and what will be checked next.
Edge AI for Real-Time Analytics Hub
Edge AI for Real-Time Analytics should sit inside a wider AI and analytics content hub. It answers a specific question: how can teams turn local, fast-moving operational signals into trusted insight and guided action?
Use these related pages as the hub-and-spoke path:
This page can also link outward to more specific use cases over time: real-time manufacturing analytics, smart facility analytics, edge quality inspection analytics, logistics exception analytics, inventory risk analytics, and AI-assisted operations dashboards.
FAQs
Edge AI for Real-Time Analytics means using AI close to where data is created so teams can detect, classify, score, or filter fast-moving events before sending selected signals into central analytics, dashboards, reports, and follow-up workflows.
Edge AI focuses on fast local interpretation near devices, machines, cameras, gateways, or local systems. Cloud analytics is better for scalable storage, model training, historical comparison, and cross-system analysis. Most enterprise workflows need both.
No. Real-time should match the decision window. Some use cases need millisecond response. Others need alerts within minutes, shift-level summaries, or daily exception briefings. The design should state latency, refresh frequency, and what humans are expected to review.
Common sources include sensors, machine logs, images, video frames, device status, gateways, MES, SCADA, IoT platforms, WMS, TMS, POS, facility systems, CRM, support systems, ERP, finance data, and spreadsheets that provide business context.
Common use cases include production monitoring, visual quality inspection, equipment anomaly detection, smart building operations, utility monitoring, warehouse movement, inventory risk, logistics exceptions, retail branch performance, and service threshold alerts.
Teams should define event fields, metric formulas, thresholds, model versions, confidence rules, permissions, source traceability, data freshness labels, review owners, escalation rules, and human approval checkpoints.
FineBI can connect edge event summaries with enterprise data, build governed dashboards, model metrics, manage access, and preserve historical comparison. Dora can act as the AI Data Agent layer that answers follow-up questions, generates insight briefings, flags exceptions, pushes owner-specific updates, and summarizes unresolved issues based on trusted FineBI assets.
No. It can reduce manual monitoring and help teams notice signals earlier, but humans still review context, approve actions, handle exceptions, and decide operational, financial, compliance, safety, or customer responses.
