
What is Data Analytics Consulting?
Data Analytics Consulting Scope
Data analytics consulting can start at different points. Some teams need a roadmap. Some already have dashboards but do not trust the numbers. Some have a strong BI team but need better business adoption. Some want AI summaries, but their KPI definitions are not ready yet.
The scope should match the problem. If the problem is unclear definitions, the first answer is not a new dashboard. If the problem is slow reporting, the answer may be a reusable reporting workflow. If the problem is low adoption, the answer may be better audience design, training, and review rituals.
Use this table to separate common consulting scopes:
Analytics Strategy
Key question What should we build first, and why?
Deliverables Use case map, priority score, roadmap, and ownership model.
Data Source Assessment
Key question Can the data support the decision?
Deliverables Source inventory, data quality notes, gap list, and refresh plan.
KPI & Metric Design
Key question Which numbers should people trust?
Deliverables Metric dictionary, formulas, filters, owners, and business rules.
Dashboard & Reporting Design
Key question How should users consume the insight?
Deliverables Wireframes, dashboard hierarchy, report templates, and commentary model.
Governance Setup
Key question How do we keep analytics consistent?
Deliverables Permission logic, definition control, data lineage, and review cadence.
Adoption & Enablement
Key question How do teams actually use the work?
Deliverables User training, meeting workflow, playbooks, and feedback loop.
AI-Assisted Analytics
Key question Where can AI reduce manual data work?
Deliverables Prompt patterns, Skills, alerts, briefings, and human review rules.
Good scope is narrow enough to land. "Improve analytics" is too broad. "Build a weekly revenue review that explains region, product, customer, margin, owner, and next action" is much easier to deliver and measure.
This is also where data analytics strategy matters. A strategy does not need to be a thick document. It should say which decision comes first, which data is required, who owns the metric, how the output will be reviewed, and how the next use case will build on the first one.
Data Analytics Consulting Services
Data analytics consulting services often fail when they jump too quickly to tools. Tool selection matters, but it should come after the team has named the decision, audience, metrics, data sources, and review workflow.
A practical consulting engagement usually includes these workstreams:
Business Question Framing
What we define Business decisions, review meetings, and stakeholder ownership.
Business value Prevents generic dashboards that nobody owns.
Data Audit
What we define Data sources, refresh schedules, quality risks, access rules, and integration readiness.
Business value Confirms whether current data can answer the business questions.
Metric Modeling
What we define KPI definitions, formulas, dimensions, thresholds, and ownership.
Business value Creates a single source of truth for business metrics.
Dashboard Architecture
What we define Executive summaries, drill paths, exception analysis, and supporting views.
Business value Makes it easier to move from insight to action.
Reporting Workflow
What we define Reporting cadence, templates, approval, and distribution.
Business value Reduces repetitive reporting effort.
Governance & Permissions
What we define Roles, permissions, lineage, ownership, and change management.
Business value Keeps analytics secure, consistent, and trusted.
Adoption Support
What we define Training, workshops, meeting workflows, and feedback loops.
Business value Builds lasting adoption across teams.
AI Workflow Design
What we define AI prompts, scheduled summaries, alerts, Skills, and review rules.
Business value Automates repetitive analytics while maintaining governance.
Some related services have their own focus. Dashboard consulting usually centers on visual decision spaces. Data visualization consulting services focus more on chart choice, layout, and communication. Data management consulting focuses on the data foundation. Data analytics consulting should connect all three when the goal is a repeatable business decision workflow.
The best consulting output is often boring in a good way: clear definitions, a small set of useful views, known owners, and a meeting where people spend less time questioning the data.
Don't just collect data. Visualize what matters.
Download the KPI Dashboard Guide to support your data analytics consulting work:
- 10 essential steps to build effective KPI dashboards
- How to choose the right charts and avoid visual clutter
- 15 top-notch dashboard templates for 2026

Data Analytics Consulting Roadmap
Data analytics consulting works better when the first project is small enough to finish and important enough to matter. A broad transformation plan can be useful, but the first delivery should prove the method.
Use this roadmap:
- Choose one recurring decision. Pick a real workflow such as weekly sales review, inventory shortage risk, customer churn briefing, monthly margin analysis, campaign performance diagnosis, or workforce turnover review.
- Define the users. Separate executives, department leaders, analysts, frontline managers, and IT users. They do not need the same first screen.
- Map the current work. List the exports, dashboards, reports, manual checks, meetings, and approval steps people use today.
- Identify the pain. Find where the process slows down: missing data, unclear formulas, late updates, manual consolidation, weak commentary, or no owner follow-up.
- Define the metric layer. Write formulas, filters, exclusions, time windows, thresholds, dimensions, and owners.
- Build the minimum useful view. Start with one dashboard or report that answers the main question and supports drill-down.
- Add review context. Include commentary, data quality notes, assumptions, and suggested follow-up questions.
- Assign owners. Every meaningful exception should have a person or team responsible for review.
- Test it in a meeting. Watch where users hesitate, argue, ask for export, or ignore a chart.
- Improve the next cycle. Remove unused sections, fix definitions, add missing drill paths, and document the working pattern.
A data analytics framework can help teams keep this work organized. The framework should connect business question, data source, method, visual output, interpretation, and action. If it stops at chart selection, it is incomplete.
For early-stage teams, this roadmap may live in a spreadsheet and a few dashboards. For larger enterprises, it usually needs business intelligence, governed semantic definitions, access control, scheduled reports, and a stronger review workflow.
Metrics of Data Analytics Consulting
Metrics are where data analytics consulting becomes practical. If teams cannot agree on the metric, the dashboard will not fix the meeting.
Start with three layers:
- Outcome metrics show whether the business result is improving. Examples include revenue, margin, churn, on-time delivery, forecast accuracy, customer lifetime value, defect rate, employee turnover, and budget variance.
- Driver metrics explain what may have caused the outcome. Examples include traffic, conversion, product mix, discount rate, cost movement, inventory availability, supplier lead time, machine downtime, support response time, hiring pipeline, and sales activity.
- Diagnostic fields let users drill into the movement. Examples include date, region, product, customer, account, campaign, channel, supplier, plant, machine, department, owner, status, and reason code.
Use the decision to choose the first metric set:
Executive Performance
Key metrics Revenue, profit, margin, target achievement, cost, cash, and risk exposure.
Analyze by Region, business unit, product, customer segment, and owner.
Sales & CRM
Key metrics Pipeline, win rate, sales cycle, forecast, quota attainment, and average deal size.
Analyze by Account, opportunity stage, sales rep, region, product, and source.
Marketing
Key metrics Spend, traffic, leads, conversion, CAC, ROAS, and pipeline contribution.
Analyze by Campaign, source, medium, landing page, audience, and offer.
Supply Chain
Key metrics Inventory turnover, stockout risk, fill rate, on-time delivery, and freight cost.
Analyze by SKU, supplier, warehouse, order, route, and planner.
Manufacturing
Key metrics Output, OEE, yield, downtime, defect rate, plan attainment, and scrap cost.
Analyze by Plant, line, machine, shift, batch, work order, and material.
HR
Key metrics Headcount, hiring progress, turnover, retention, absence, and labor cost.
Analyze by Department, role, location, tenure, manager, and employee group.
Customer
Key metrics Retention, churn, repeat purchase, CLV, satisfaction, and support backlog.
Analyze by Segment, cohort, product, account owner, channel, and lifecycle stage.
Data Quality
Key metrics Missing values, duplicates, stale records, refresh delay, and definition conflicts.
Analyze by Source system, table, field, owner, refresh job, and data steward.
If the output will become a data analytics dashboard, define the dashboard around these layers. A strong analytics dashboard does not show every available metric. It shows the metrics that help a specific user understand status, cause, risk, and next action.
Use dashboard design principles to keep the first screen readable. Use a KPI dashboard when the main job is performance tracking. Use drill-down dashboards when the job is diagnosis. Use scheduled reports when the job is recurring review and accountability.
Examples and Templates
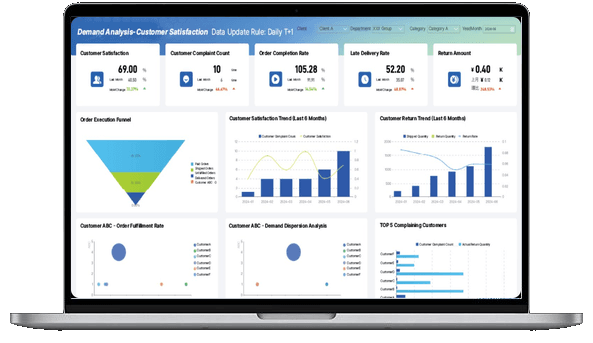
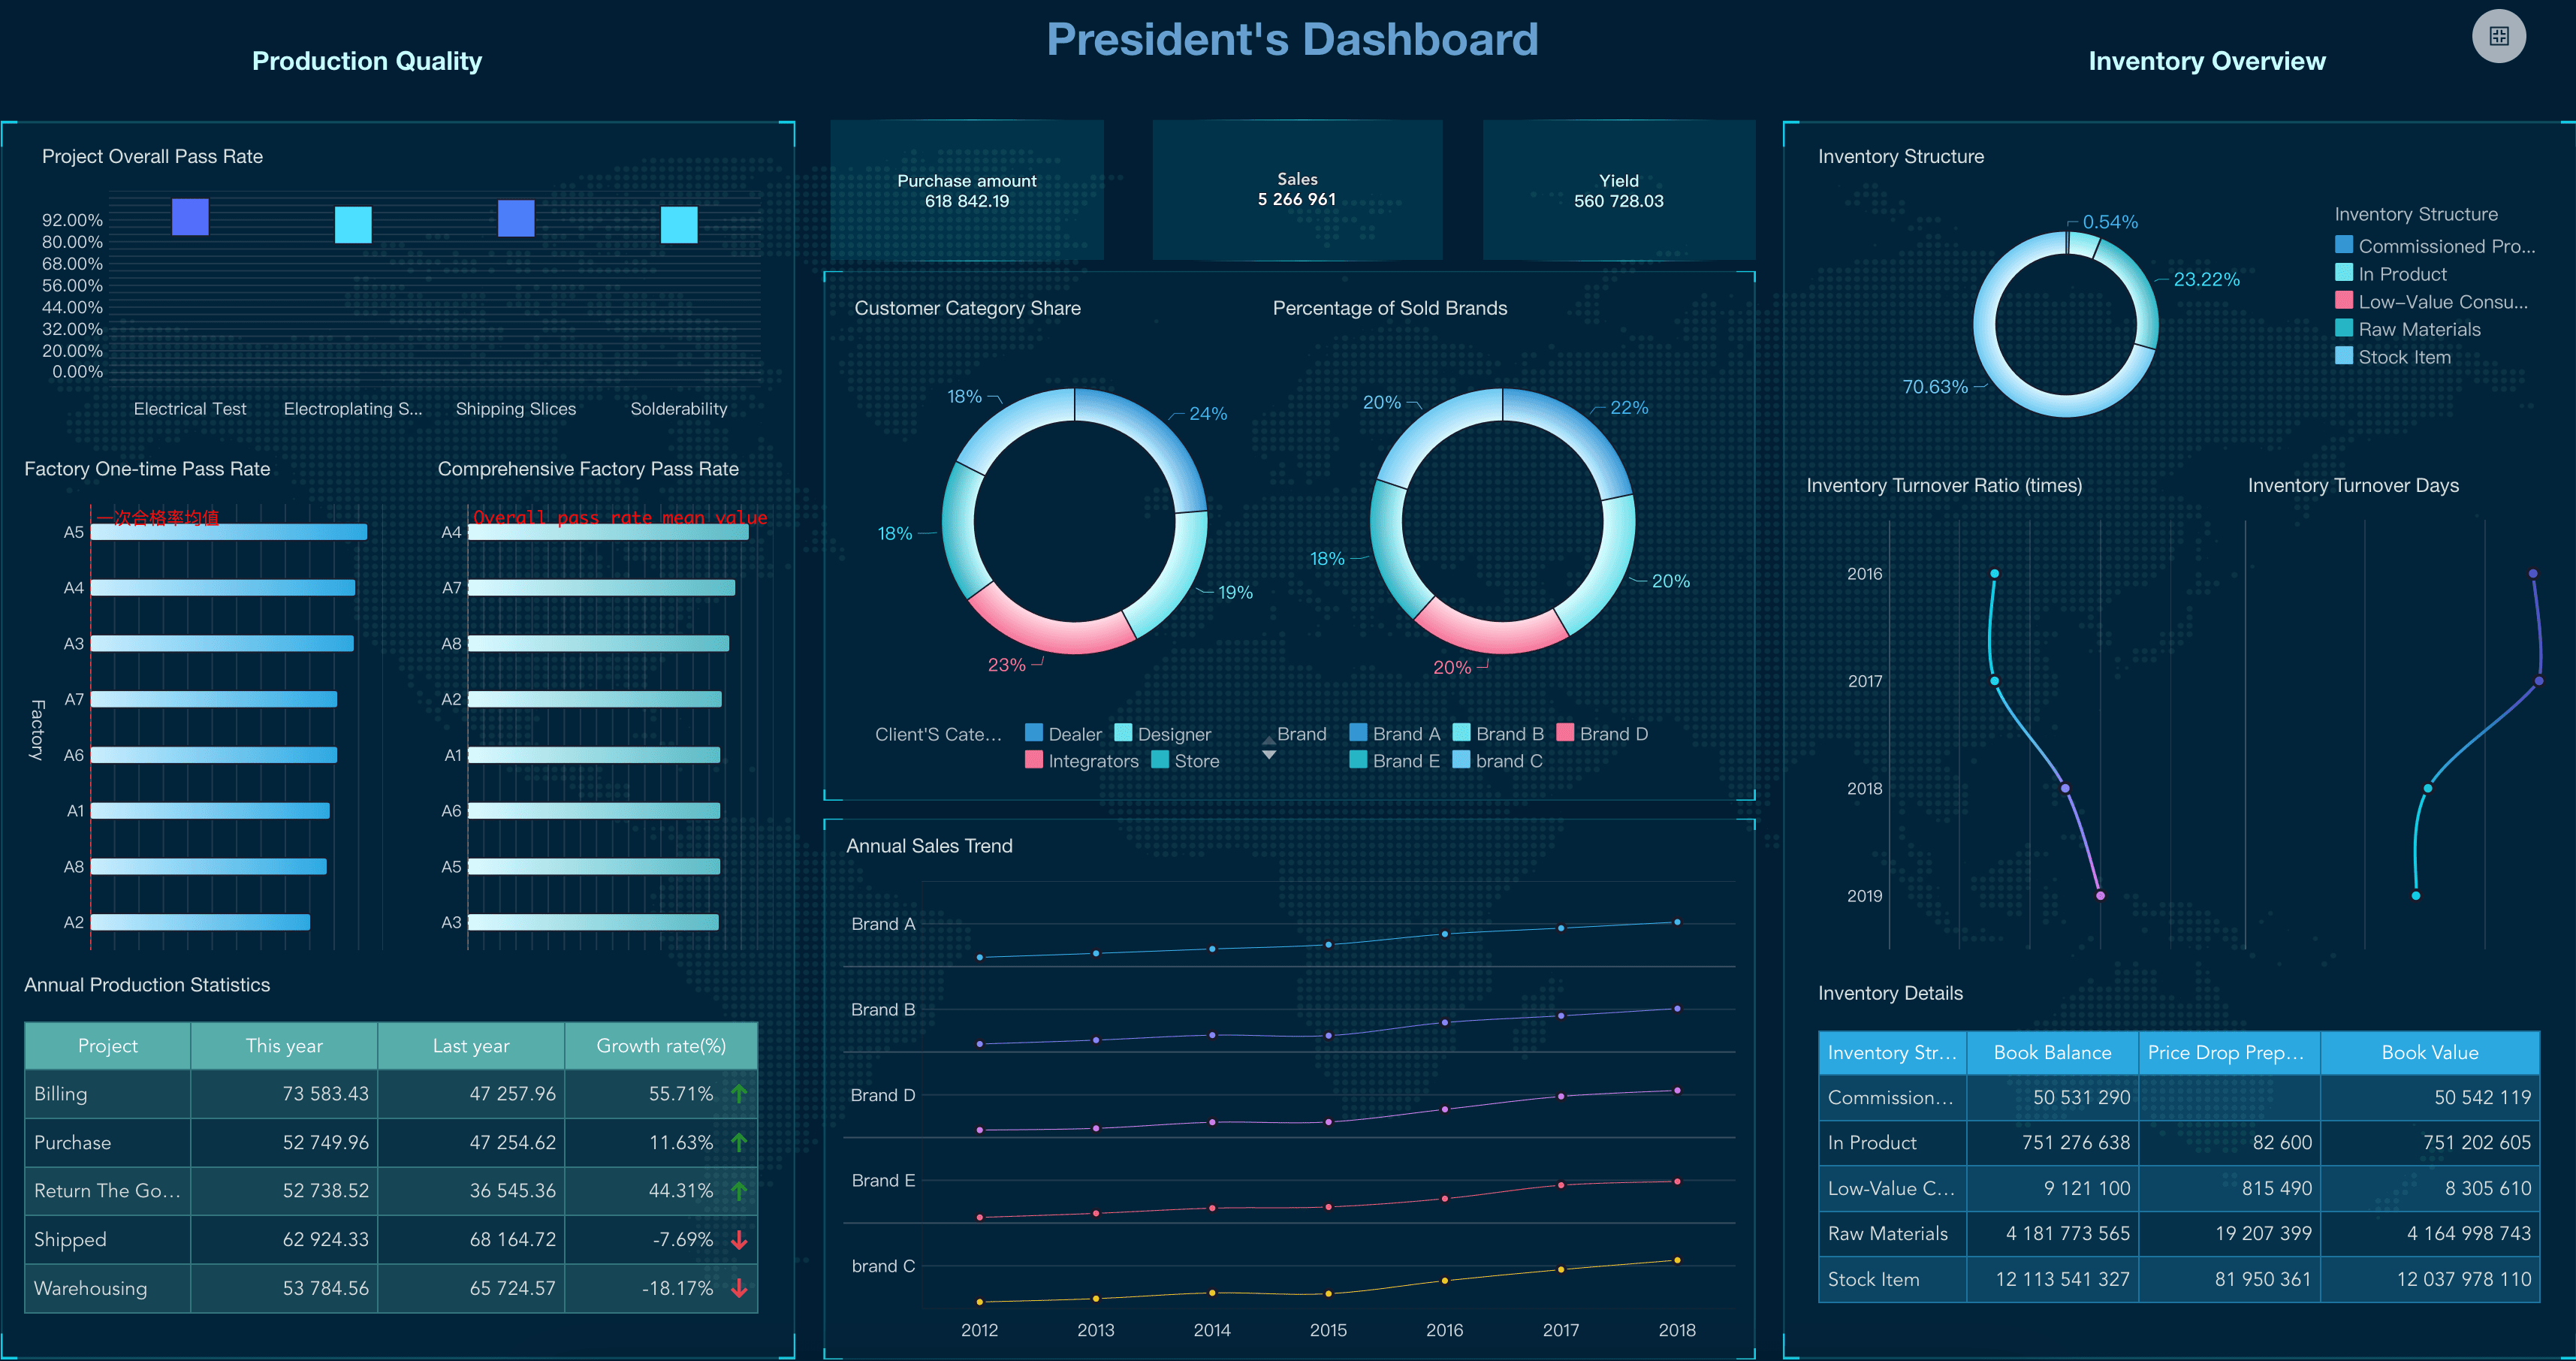
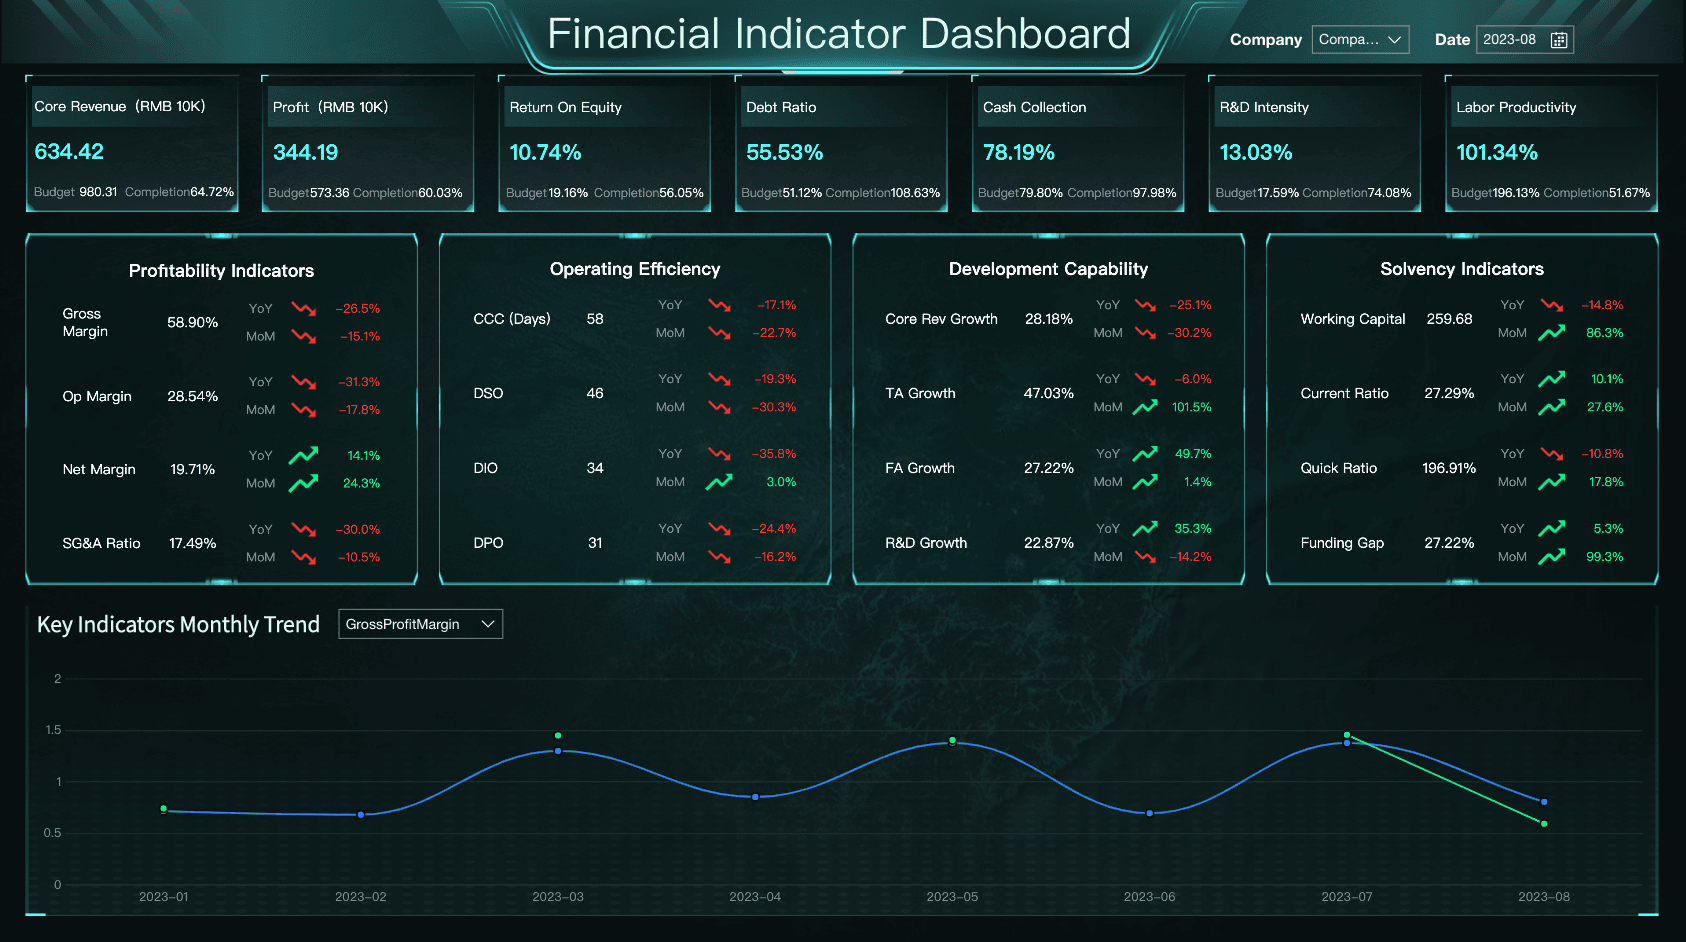
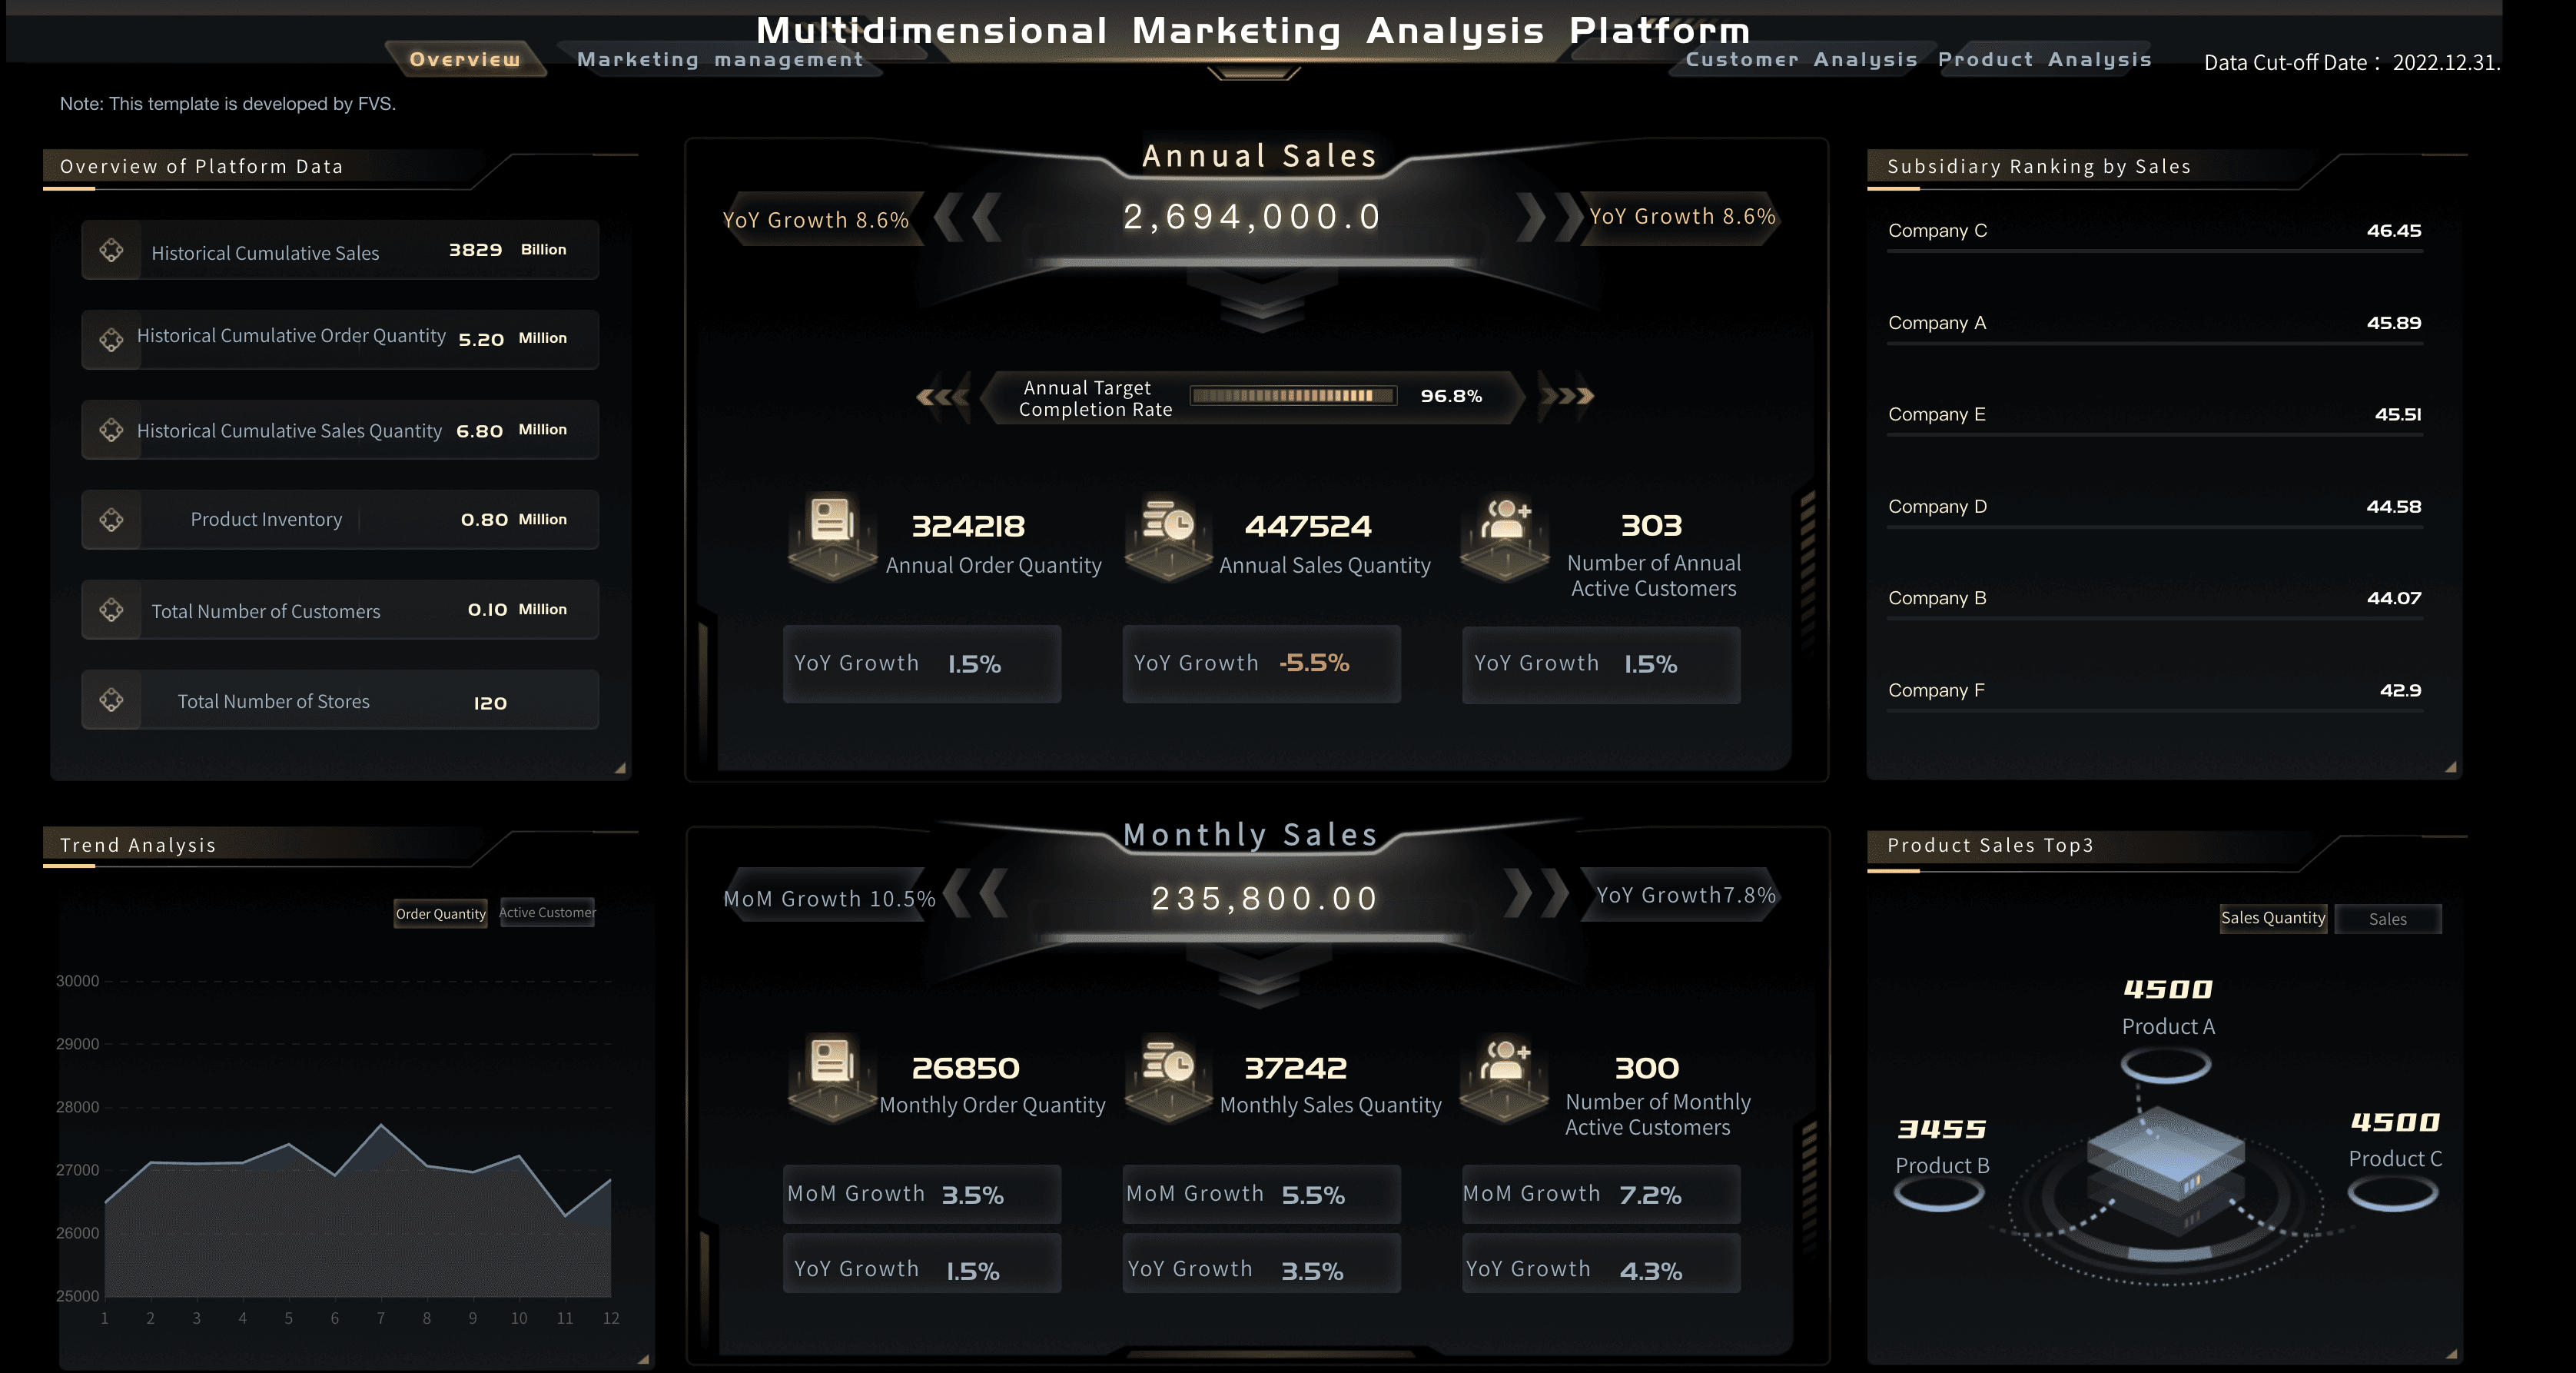
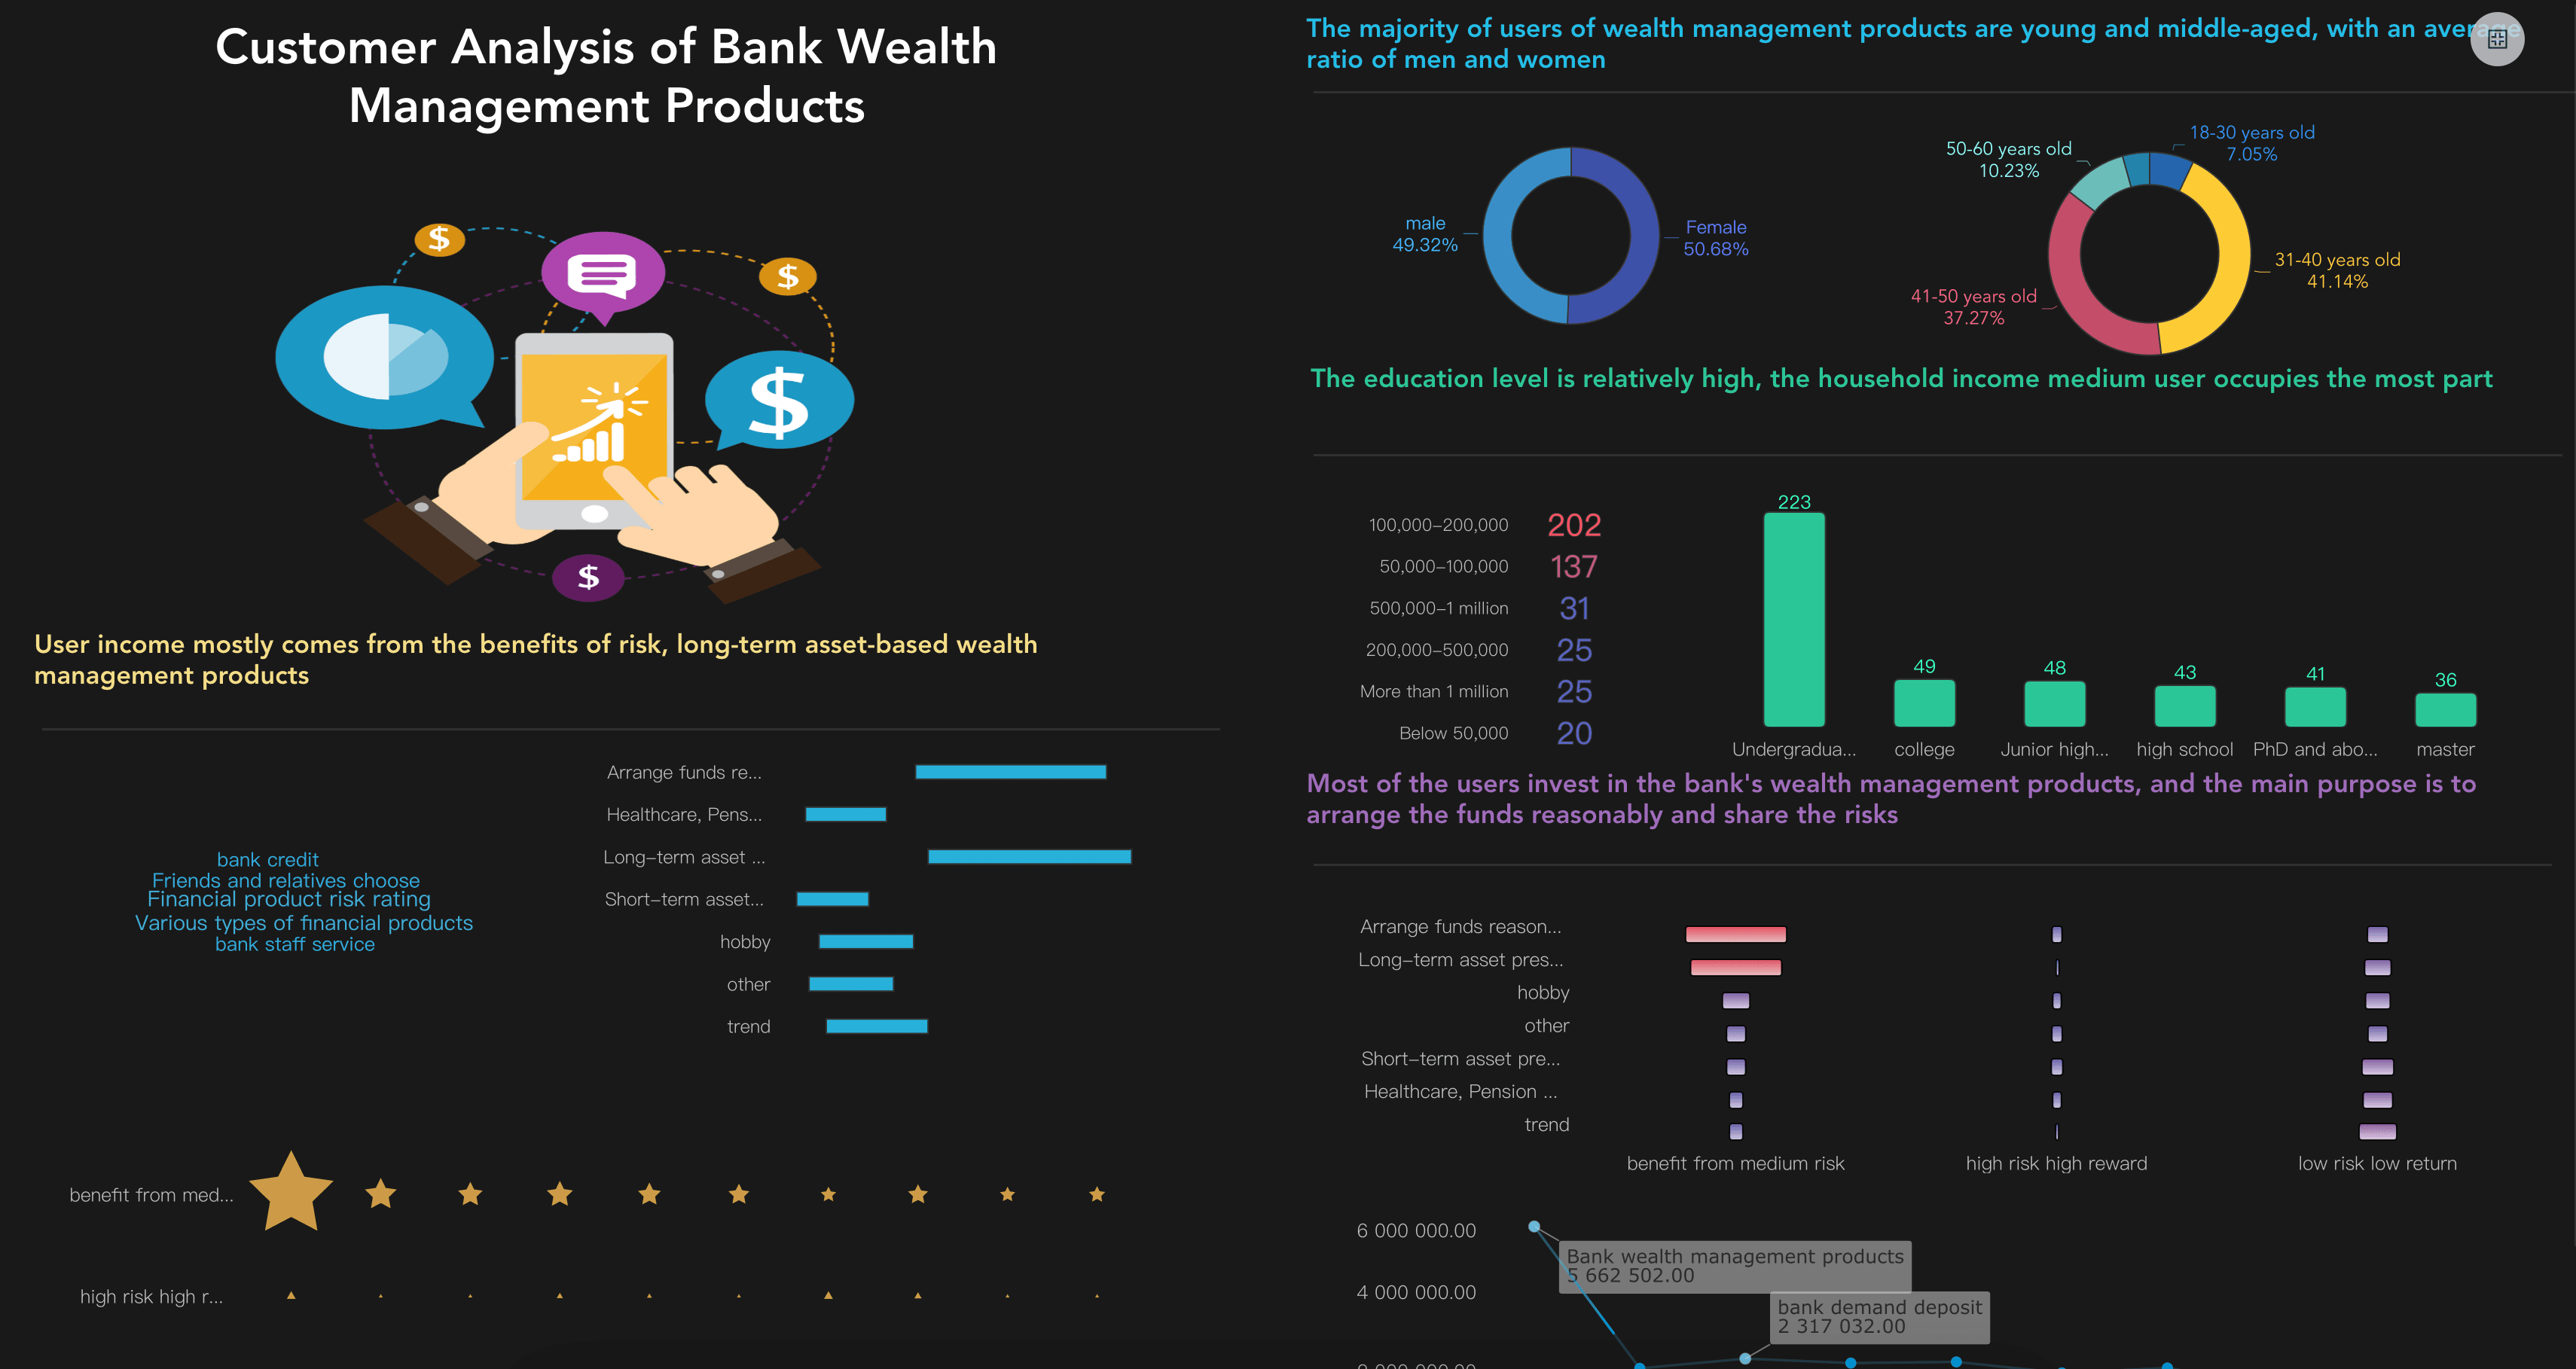
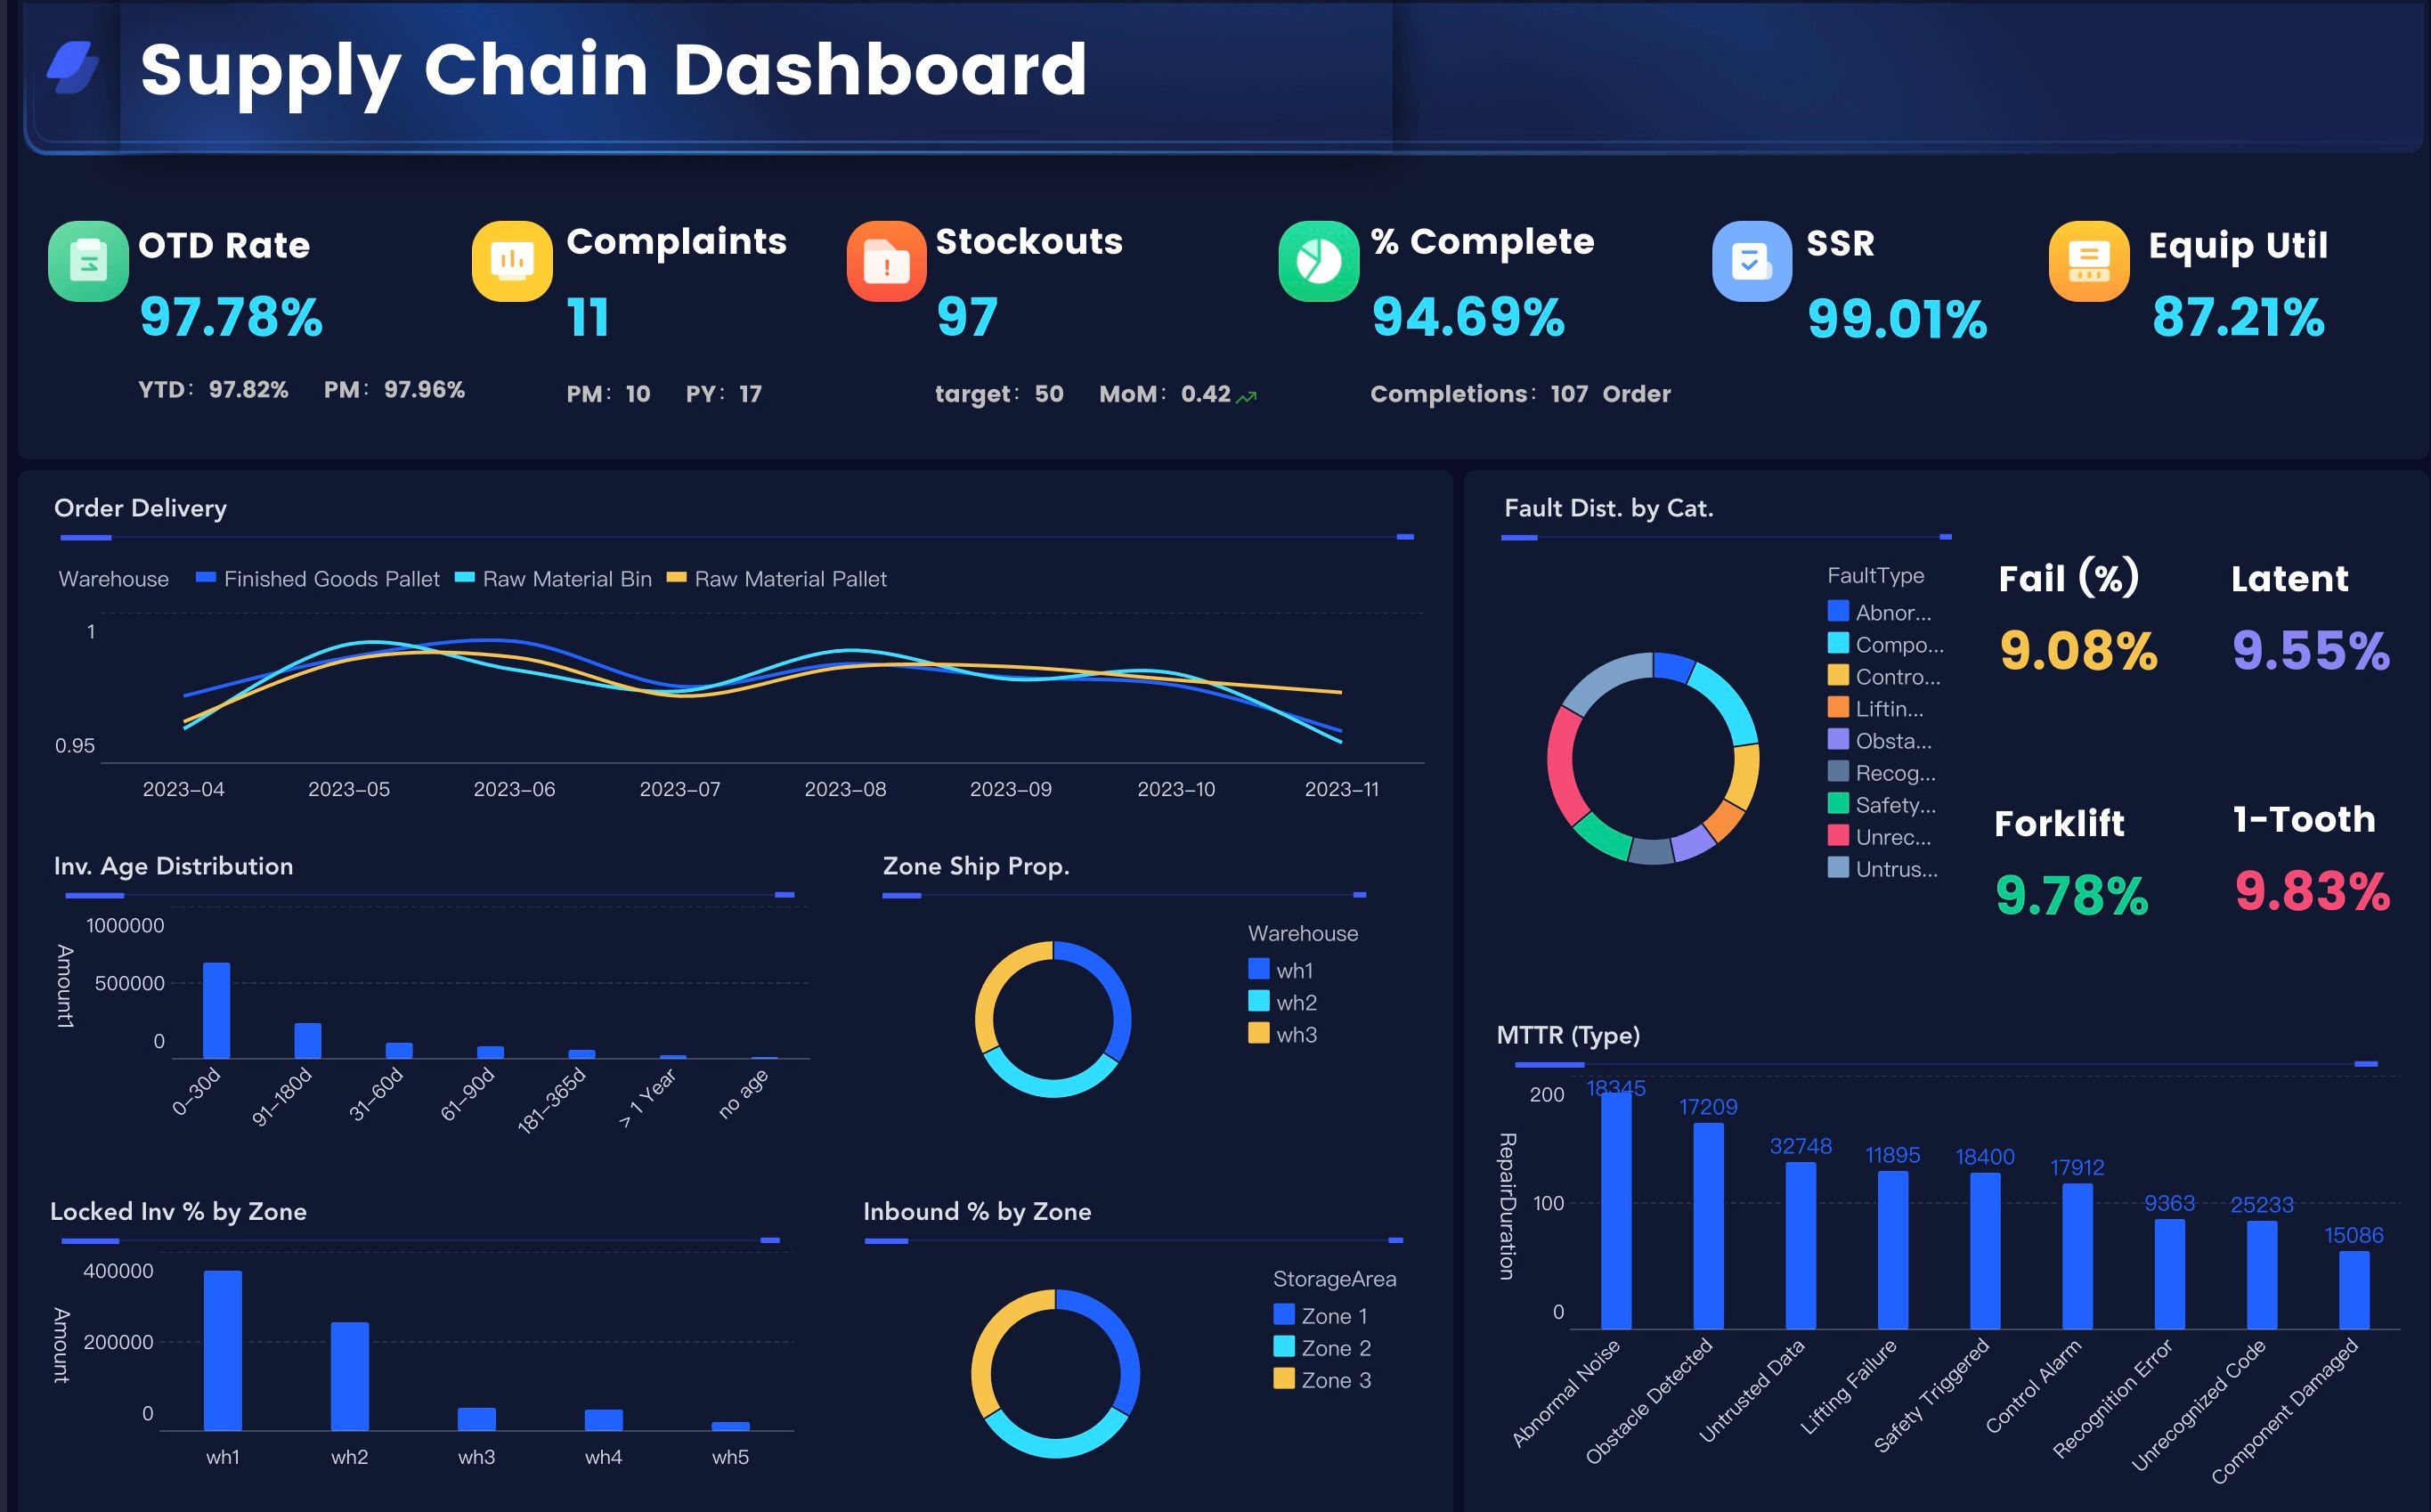
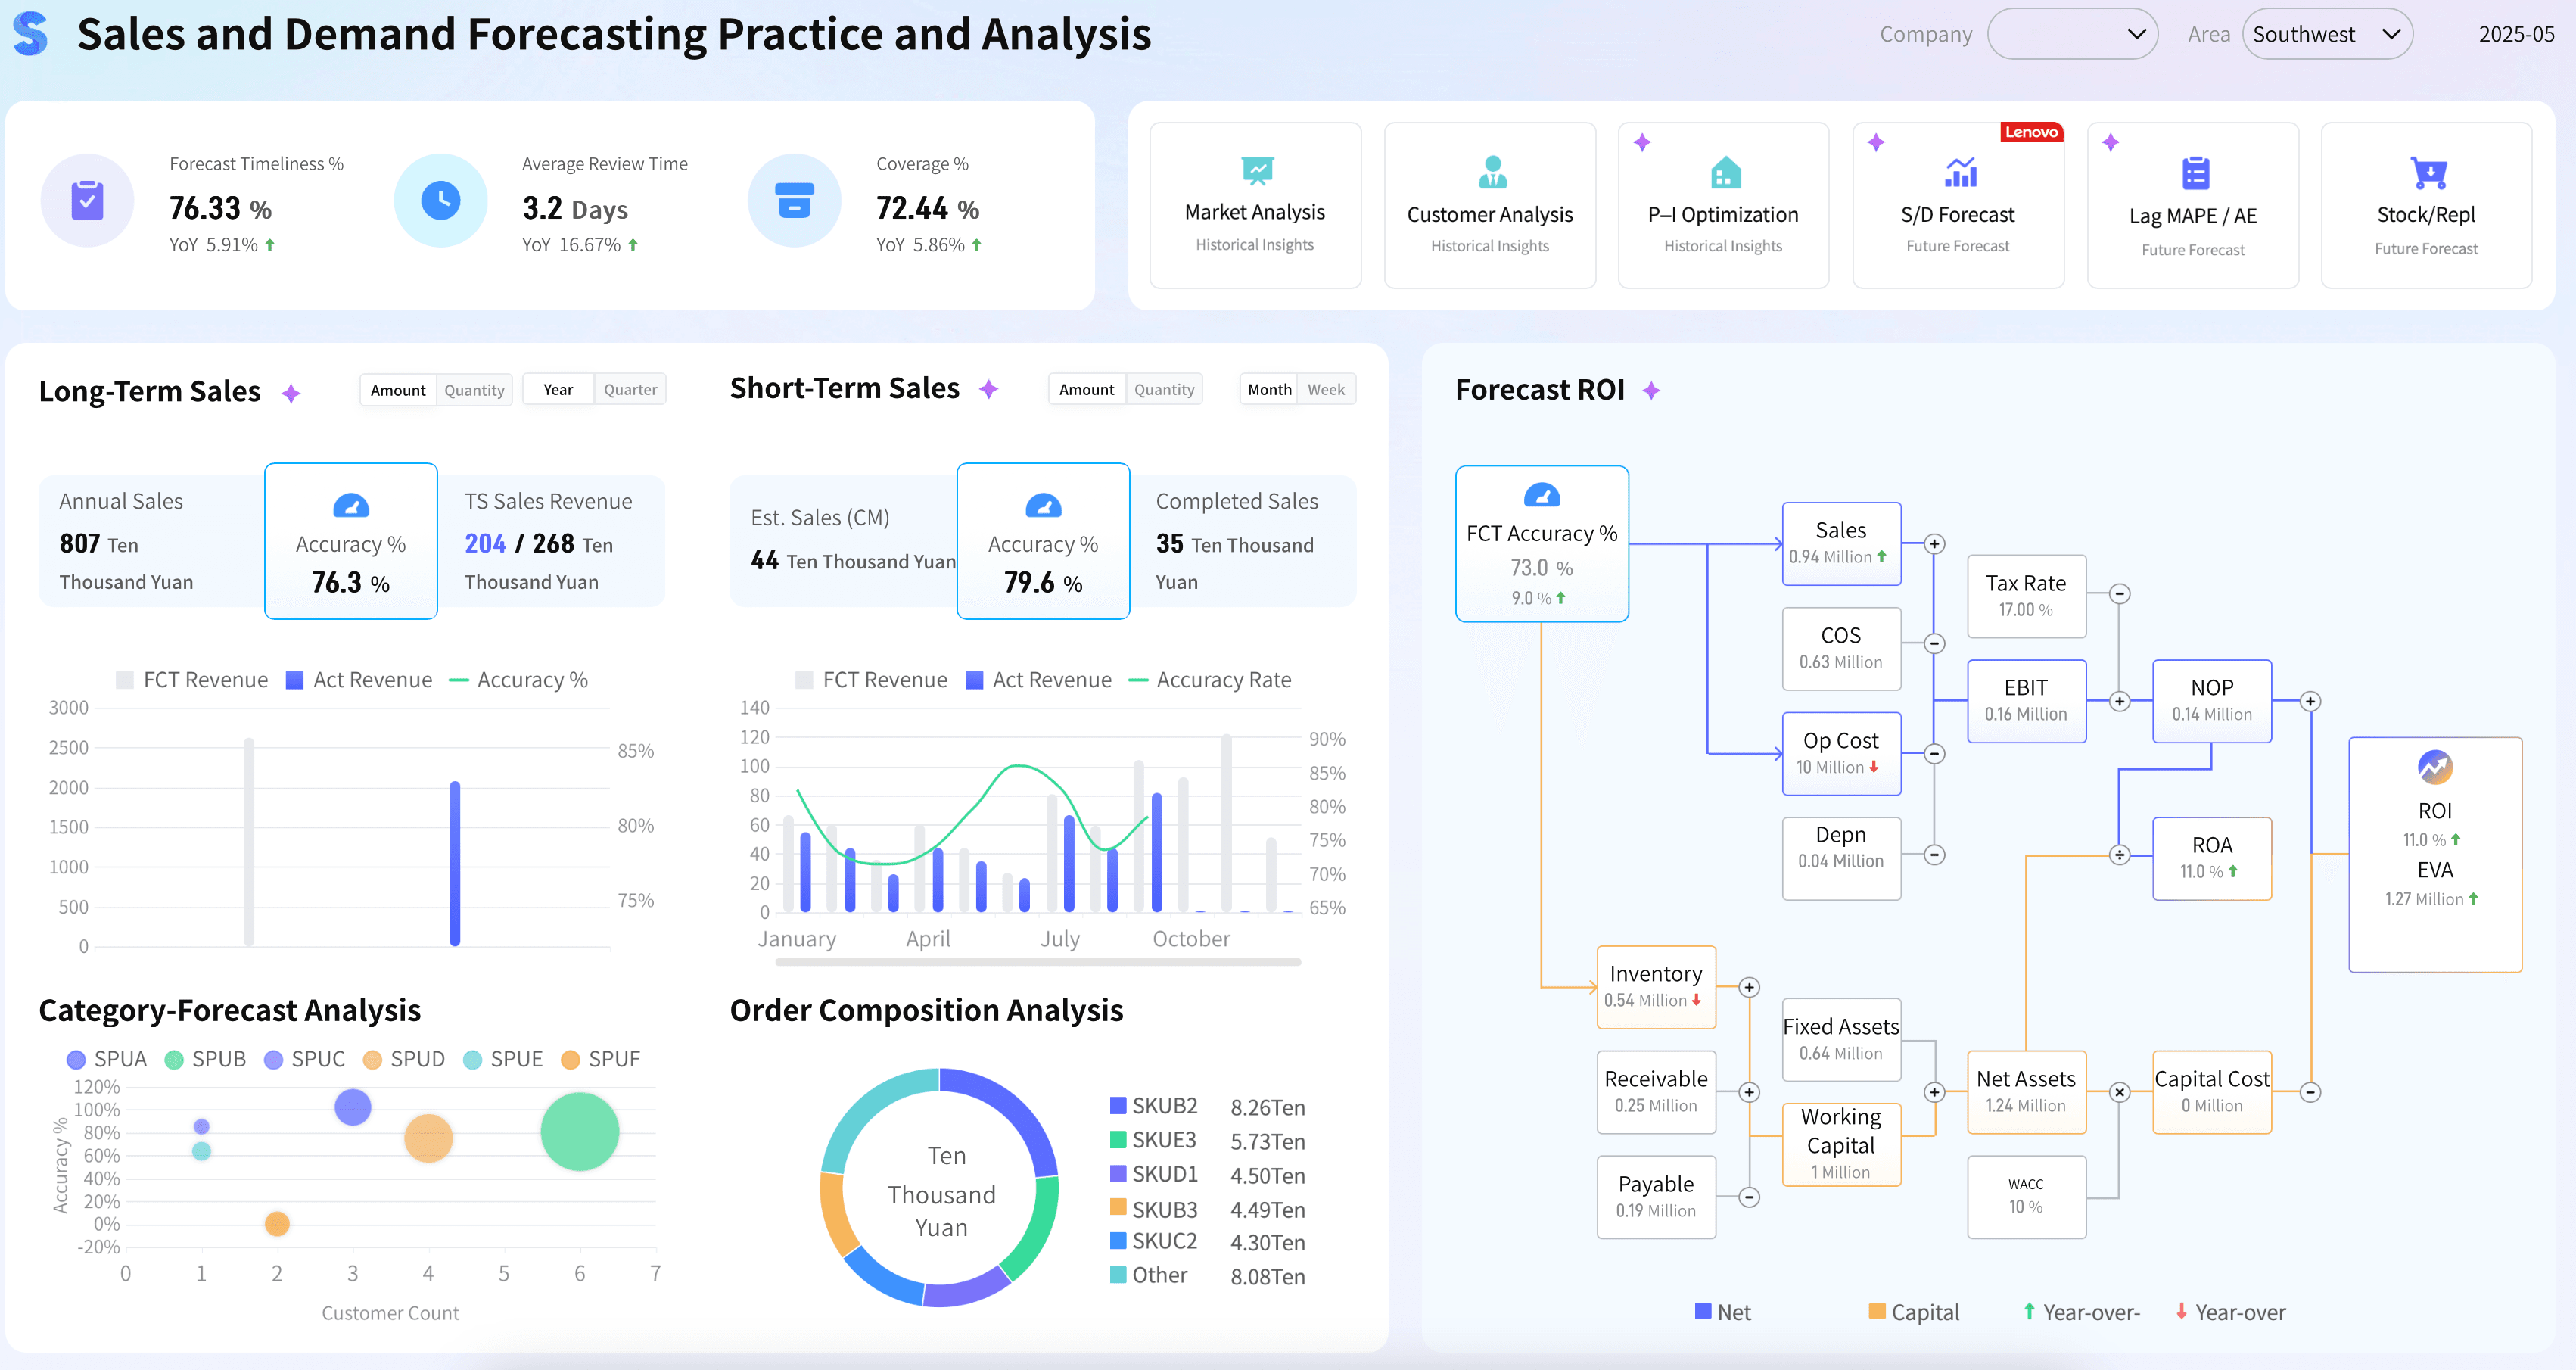
Examples help consulting teams move from abstract recommendations to concrete requirements. The demo cards below come from the Gallery demo file and match common data analytics consulting questions: governance, KPI design, executive review, drill-down diagnosis, marketing performance, customer insight, finance, inventory, supply chain, workforce, and forecasting.
Use them as scoping prompts, not as decorations. Before copying a layout, ask which decision the view supports, which metric definitions must be governed, which user owns the follow-up, and which part of the workflow could become a reusable report or AI briefing.
Deliverables
The best data analytics consulting deliverables should make the team more independent after the project ends. A dashboard without definitions, ownership, or review habits is fragile. A strategy deck without a working example is also easy to ignore.
Ask for deliverables that help the organization keep improving:
Use Case Backlog
Deliverables Business questions, audiences, priorities, data readiness, expected value, and ownership.
Business value Helps teams prioritize the next analytics initiative with less debate.
Metric Dictionary
Deliverables KPI definitions, formulas, filters, time grain, data sources, ownership, thresholds, and caveats.
Business value Keeps dashboards, reports, and AI-generated answers aligned.
Data Source Map
Deliverables Systems, tables, fields, refresh schedules, quality issues, access rules, and identified gaps.
Business value Provides transparency into data reliability and limitations.
Dashboard Blueprint
Deliverables Page hierarchy, summary cards, drill-down paths, filters, trend analysis, and exception views.
Business value Aligns business stakeholders, designers, and BI developers.
Reporting Playbook
Deliverables Reporting cadence, templates, distribution, commentary standards, and review workflows.
Business value Reduces repetitive reporting work.
Governance Model
Deliverables Permissions, stewardship, lineage, change management, and approval rules.
Business value Maintains trusted analytics as adoption expands.
Adoption Plan
Deliverables Training, workshops, meeting workflows, feedback loops, and success tracking.
Business value Turns analytics into part of everyday decision-making.
AI Workflow Guide
Deliverables Prompt libraries, Skills, trusted source assets, alert rules, briefing templates, and review processes.
Business value Supports scalable AI adoption with clear governance.
These deliverables also make tool discussions more productive. Instead of asking whether a platform has many features, the team can ask whether it supports the defined workflow: governed metrics, useful dashboards, scheduled reports, role-based access, commentary, drill-down, and AI-assisted follow-up.
If recurring distribution is a major part of the project, compare reporting tools, reporting software, and BI reporting needs before finalizing the design. If users need deeper exploration, make sure the project supports ad hoc analysis as well as scheduled output.
Tool Stack
Data analytics consulting should help teams choose tools based on the work to be done. A stack that looks strong in a feature checklist can still fail if users cannot find trusted metrics, understand definitions, or act on exceptions.
Most enterprise analytics stacks need these layers:
Source Systems
Purpose Connect ERP, CRM, HRIS, finance, manufacturing, warehouse, marketing, support systems, and spreadsheets.
Key consulting question Which system owns the trusted version of each field?
Data Preparation
Purpose Clean, integrate, model, calculate, validate, and refresh business data.
Key consulting question Which data is reliable enough for decision-making?
Semantic & Metric Layer
Purpose Standardize KPI definitions, business terms, filters, permissions, and calculation logic.
Key consulting question Can business users and AI interpret the same metric consistently?
BI & Dashboard Layer
Purpose Provide dashboards, drill-down analysis, and governed self-service analytics.
Key consulting question Can users answer both the first business question and the next one?
Reporting Layer
Purpose Automate recurring reports, executive packs, and formatted outputs.
Key consulting question Can reporting remain consistent and on schedule?
AI Agent Layer
Purpose Enable AI-powered queries, summaries, alerts, recommendations, and follow-up actions.
Key consulting question Can AI improve efficiency without compromising governance?
Adoption Layer
Purpose Support training, ownership, meeting workflows, and change management.
Key consulting question Are analytics embedded in daily decision-making?
For visual communication, data visualization tools matter because they help teams compare trends, spot exceptions, and explain context. For repeatable business use, the stack also needs metric governance, permissions, scheduled delivery, and review workflows.
The consulting recommendation should be honest about maturity. If data is messy, start with definitions and source cleanup. If definitions are ready but users still wait for analysts, build self-service views. If dashboards exist but people do not know what to do next, add commentary, owner workflows, and scheduled briefings. If the team wants AI, start with governed BI assets and a narrow scenario before moving to broader automation.
Data Analytics Consulting With FineBI + Dora
After the consulting scope is clear, FineBI + Dora can support a practical learning path from trusted BI assets to AI-assisted insight and follow-up.
FineBI can support the BI and dashboard layer of data analytics consulting:
- Connect business data from databases, ERP, CRM, finance, marketing, HR, operations, and spreadsheets.
- Model governed metrics, reusable dimensions, filters, and subject areas.
- Build dashboards for executive review, department analysis, operational monitoring, and self-service exploration.
- Support drill-down paths so users can move from a KPI to product, region, customer, campaign, supplier, plant, department, owner, or time-period detail.
- Manage permissions so different users see the right data.
- Preserve reusable analysis views instead of rebuilding the same report every cycle.
Dora adds the AI Data Agent layer above trusted BI assets. The stronger story is not "AI can answer anything." The stronger story is that Dora can work through configured FineBI assets, KPI definitions, business rules, knowledge libraries, Skills, source traceability, and permission boundaries.
In a data analytics consulting workflow, Dora can help teams:
- Ask natural-language questions over governed BI assets.
- Search existing dashboards and analysis views before creating another report.
- Generate chart-based answers and structured briefing notes.
- Explain metric movement with preliminary attribution and follow-up questions.
- Schedule daily, weekly, or monthly summaries for different roles.
- Detect abnormal changes and push the relevant issue to the right owner.
- Keep outputs within user, agent, and BI data permissions.
- Show which dashboard, dataset, metric, and rule supported an answer.
This is where the Dora operating guidance matters. Dora should not replace FineBI, analysts, consultants, or business owners. It should act as the AI action layer that helps more people consume governed BI assets through questions, briefings, alerts, recommendations, and follow-up.
Different consulting scenarios need different AI roles:
Data Analyst
Best for Ad hoc questions, drill-down diagnosis, chart generation, and KPI explanation.
Example output A chart-based answer explaining why margin changed by product and region.
Report Researcher
Best for Monthly reports, management summaries, and recurring review packs.
Example output A draft report that pulls approved charts and adds commentary for review.
Daily Briefing Secretary
Best for Scheduled updates before meetings or operating reviews.
Example output A weekly briefing for department owners highlighting risks and follow-up questions.
Risk Alert Officer
Best for Anomaly detection, threshold breaches, owner notifications, and unresolved issue tracking.
Example output A shortage, churn, quality, or budget alert with supporting evidence and recommended review actions.
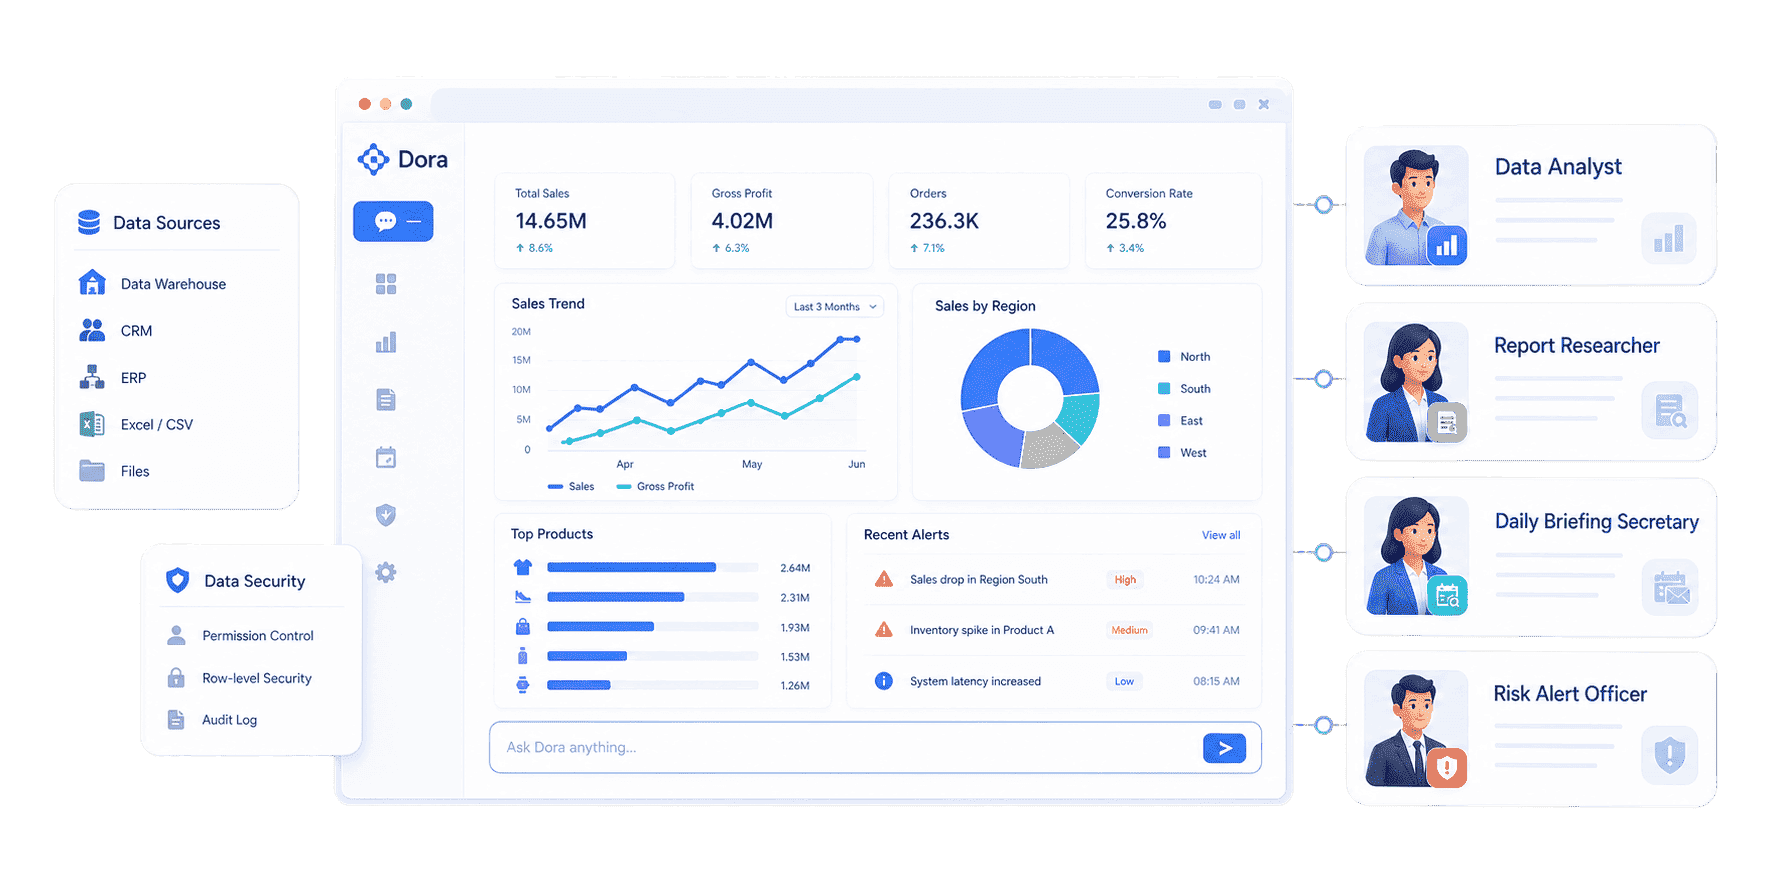 Dora's Role-based Digital Employees
This framing keeps the AI story tied to the consulting work. The consultant helps choose the scenario, define the data foundation, design the review workflow, and configure reusable assets. FineBI holds the trusted analytical workspace. Dora helps users ask, explain, brief, alert, recommend, and follow up.
Data Analytics Consulting Hub
This page works as a consulting spoke inside the broader data analytics hub.
The hub-and-spoke structure helps readers choose their path. Start with the data analytics hub when the team needs common language. Use this consulting page when the team needs scope, deliverables, roadmap, and governance guidance. Move to the scenario pages when the team already knows the business area and needs metrics, data sources, demo examples, and AI workflows.
FAQs
Data analytics consulting helps organizations turn business data into trusted insight and repeatable decision workflows. It can include analytics strategy, data source assessment, KPI design, dashboard planning, reporting workflow, governance, adoption support, and AI-assisted analysis.
A company may need data analytics consulting when teams do not trust metrics, spend too much time preparing reports, cannot connect data across systems, lack a clear analytics roadmap, or want AI-assisted analytics but do not yet have governed data assets and definitions.
Useful deliverables include a use case backlog, metric dictionary, data source map, dashboard blueprint, reporting playbook, governance model, adoption plan, and AI workflow guide. The project should leave behind working assets and clear operating habits, rather than a recommendation deck that nobody uses.
Dashboard consulting focuses mainly on visual decision spaces and dashboard usability. Data analytics consulting is broader. It covers the business question, data foundation, metric definitions, governance, reporting workflow, adoption, and follow-up process behind the dashboard.
Start with the metrics tied to a recurring decision. Most projects need outcome metrics, driver metrics, and diagnostic fields. For example, a revenue review may need revenue, margin, target achievement, product mix, region, customer segment, channel, and owner.
FineBI can support the trusted BI layer: data connection, metric modeling, dashboards, drill-down analysis, and permission control. Dora can add the AI Data Agent layer for natural-language questions, scheduled briefings, anomaly alerts, chart-based answers, recommendations, and owner follow-up based on governed FineBI assets.
AI should not replace consultants, analysts, or business owners. It can help retrieve trusted data, explain movement, draft summaries, detect exceptions, and push follow-up. Humans still define the business problem, check context, approve recommendations, and decide what action to take.
Start with one recurring decision that matters. Define the audience, data sources, KPI formulas, permission rules, dashboard structure, commentary format, and follow-up owner. After the first workflow is trusted, expand to adjacent scenarios such as supply chain analytics, manufacturing analytics, marketing analytics, HR analytics, customer analytics, or CRM analytics.
