
What is HR Analytics?
HR Analytics vs. HR Reporting vs. HR Dashboards
HR analytics, HR reporting, and an hr dashboard are closely related, but they are not the same job.
HR reporting usually has a fixed cadence and audience. It may summarize headcount, hiring progress, turnover, absence, training completion, or workforce cost for a month or quarter. Reporting is useful because it creates a shared record.
An HR dashboard is the visual workspace that lets users monitor key people metrics. A good dashboard helps users see current status, compare trends, and drill into department, role, location, tenure, or manager-level patterns. An hr analytics dashboard goes further by connecting metrics to drivers, context, and decisions.
HR analytics is the broader reasoning process behind the dashboard and the report. It asks whether turnover changed because of tenure mix, manager changes, compensation pressure, workload, hiring quality, career path limits, engagement decline, or a data definition issue.
Use dashboards to watch signals. Use reports to communicate a period. Use HR analytics to learn from the pattern and decide what to do next.
Why HR Analytics is Important
HR teams rarely suffer from a lack of people data. They suffer from scattered systems, sensitive definitions, delayed reporting, and meetings where leaders ask for "one more cut" by department, role, tenure, or cost center.
Strong HR analytics helps teams move from reactive workforce administration to structured people decisions:
- Improve retention decisions: HR teams can identify where turnover is concentrated, whether exits are voluntary or involuntary, and which early signals deserve review. This connects well with employee retention software when the goal is lowering preventable churn.
- Support workforce planning: Leaders can compare headcount, open roles, capacity, labor cost, and business demand before hiring or restructuring decisions.
- Strengthen recruiting quality: Recruiting teams can analyze time to fill, offer acceptance, source quality, candidate drop-off, and quality-of-hire signals.
- Make HRBP conversations more concrete: HR business partners can bring department-specific evidence into manager reviews instead of relying on anecdotes.
- Connect people and finance: HR and finance can review workforce cost, overtime, contractor usage, productivity signals, and budget variance from the same definitions.
- Improve employee experience: Engagement, learning, mobility, manager feedback, and workload signals can help teams find friction before it becomes attrition.
- Build trust in people data: Governed definitions, permission rules, and data quality notes reduce debates about whose spreadsheet is correct.
The practical value is not "more HR data." The value is fewer unresolved questions in workforce reviews: what changed, why it matters, which group needs attention, who owns the next step, and what will be reviewed next.
Don't just collect HR data. Visualize what matters.
Download the KPI Dashboard Guide to strengthen your HR analytics foundation:
- How to turn HR goals into measurable KPI dashboard views
- 10 essential steps to build effective KPI dashboards
- How to choose the right charts and avoid visual clutter
- 15 top-notch dashboard templates for 2026

Metrics of HR Analytics
HR analytics metrics should follow the employee lifecycle. Start with the decision you need to support, then choose the smallest metric set that can explain the issue.
Workforce Planning
- Key metrics: Headcount, vacancy rate, workforce cost, budget variance, capacity gap
- What it helps answer: Do we have the right roles and capacity for the plan?
Recruiting
- Key metrics: Time to fill, time to hire, source quality, offer acceptance rate, candidate drop-off
- What it helps answer: Where is the hiring funnel slowing down?
Onboarding
- Key metrics: New-hire retention, time to productivity, onboarding completion, probation pass rate
- What it helps answer: Are new employees becoming productive and staying?
Engagement
- Key metrics: Survey score, eNPS, response rate, sentiment themes, manager score
- What it helps answer: Where might morale, trust, or workload need attention?
Performance
- Key metrics: Goal completion, rating distribution, promotion rate, performance trend, manager calibration
- What it helps answer: Are performance signals consistent and useful?
Learning
- Key metrics: Training completion, skill coverage, certification rate, learning hours, post-training impact
- What it helps answer: Are people building the skills the business needs?
Retention
- Key metrics: Turnover rate, voluntary attrition, regretted attrition, retention rate, internal mobility
- What it helps answer: Which groups are leaving, and what patterns appear before exit?
Compensation
- Key metrics: Salary distribution, compa-ratio, pay range position, overtime, bonus eligibility
- What it helps answer: Are pay practices aligned with policy, role, and market logic?
Workforce Operations
- Key metrics: Absence rate, overtime, shift coverage, schedule adherence, HR service requests
- What it helps answer: Where are workload, attendance, or service issues concentrated?
Risk & Compliance
- Key metrics: Missing documents, overdue training, policy exceptions, access review, audit status
- What it helps answer: Which workforce controls need follow-up?
Most HR analytics systems work better with three metric layers:
- Outcome metrics: Retention, hiring success, workforce cost, engagement, productivity, employee experience, compliance status.
- Driver metrics: Manager change, tenure, role family, location, compensation band, workload, training, internal mobility, hiring source.
- Diagnostic fields: Department, team, manager, role, level, tenure band, location, employment type, cost center, hire cohort, exit reason.
Keep first-screen metrics focused. If a metric does not support a decision, diagnose a people risk, or explain a workforce outcome, move it to a drill-down view or appendix. A focused KPI dashboard is easier to trust than a crowded HR screen that treats every number as equally important.
Examples and Templates
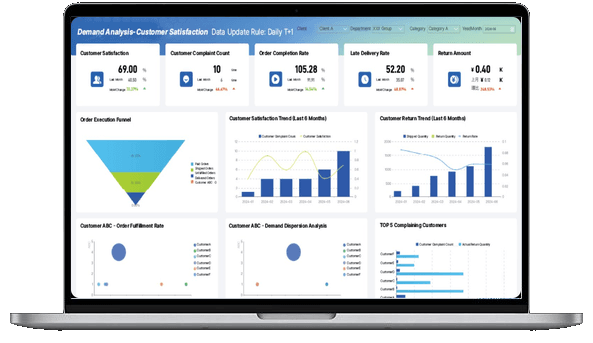
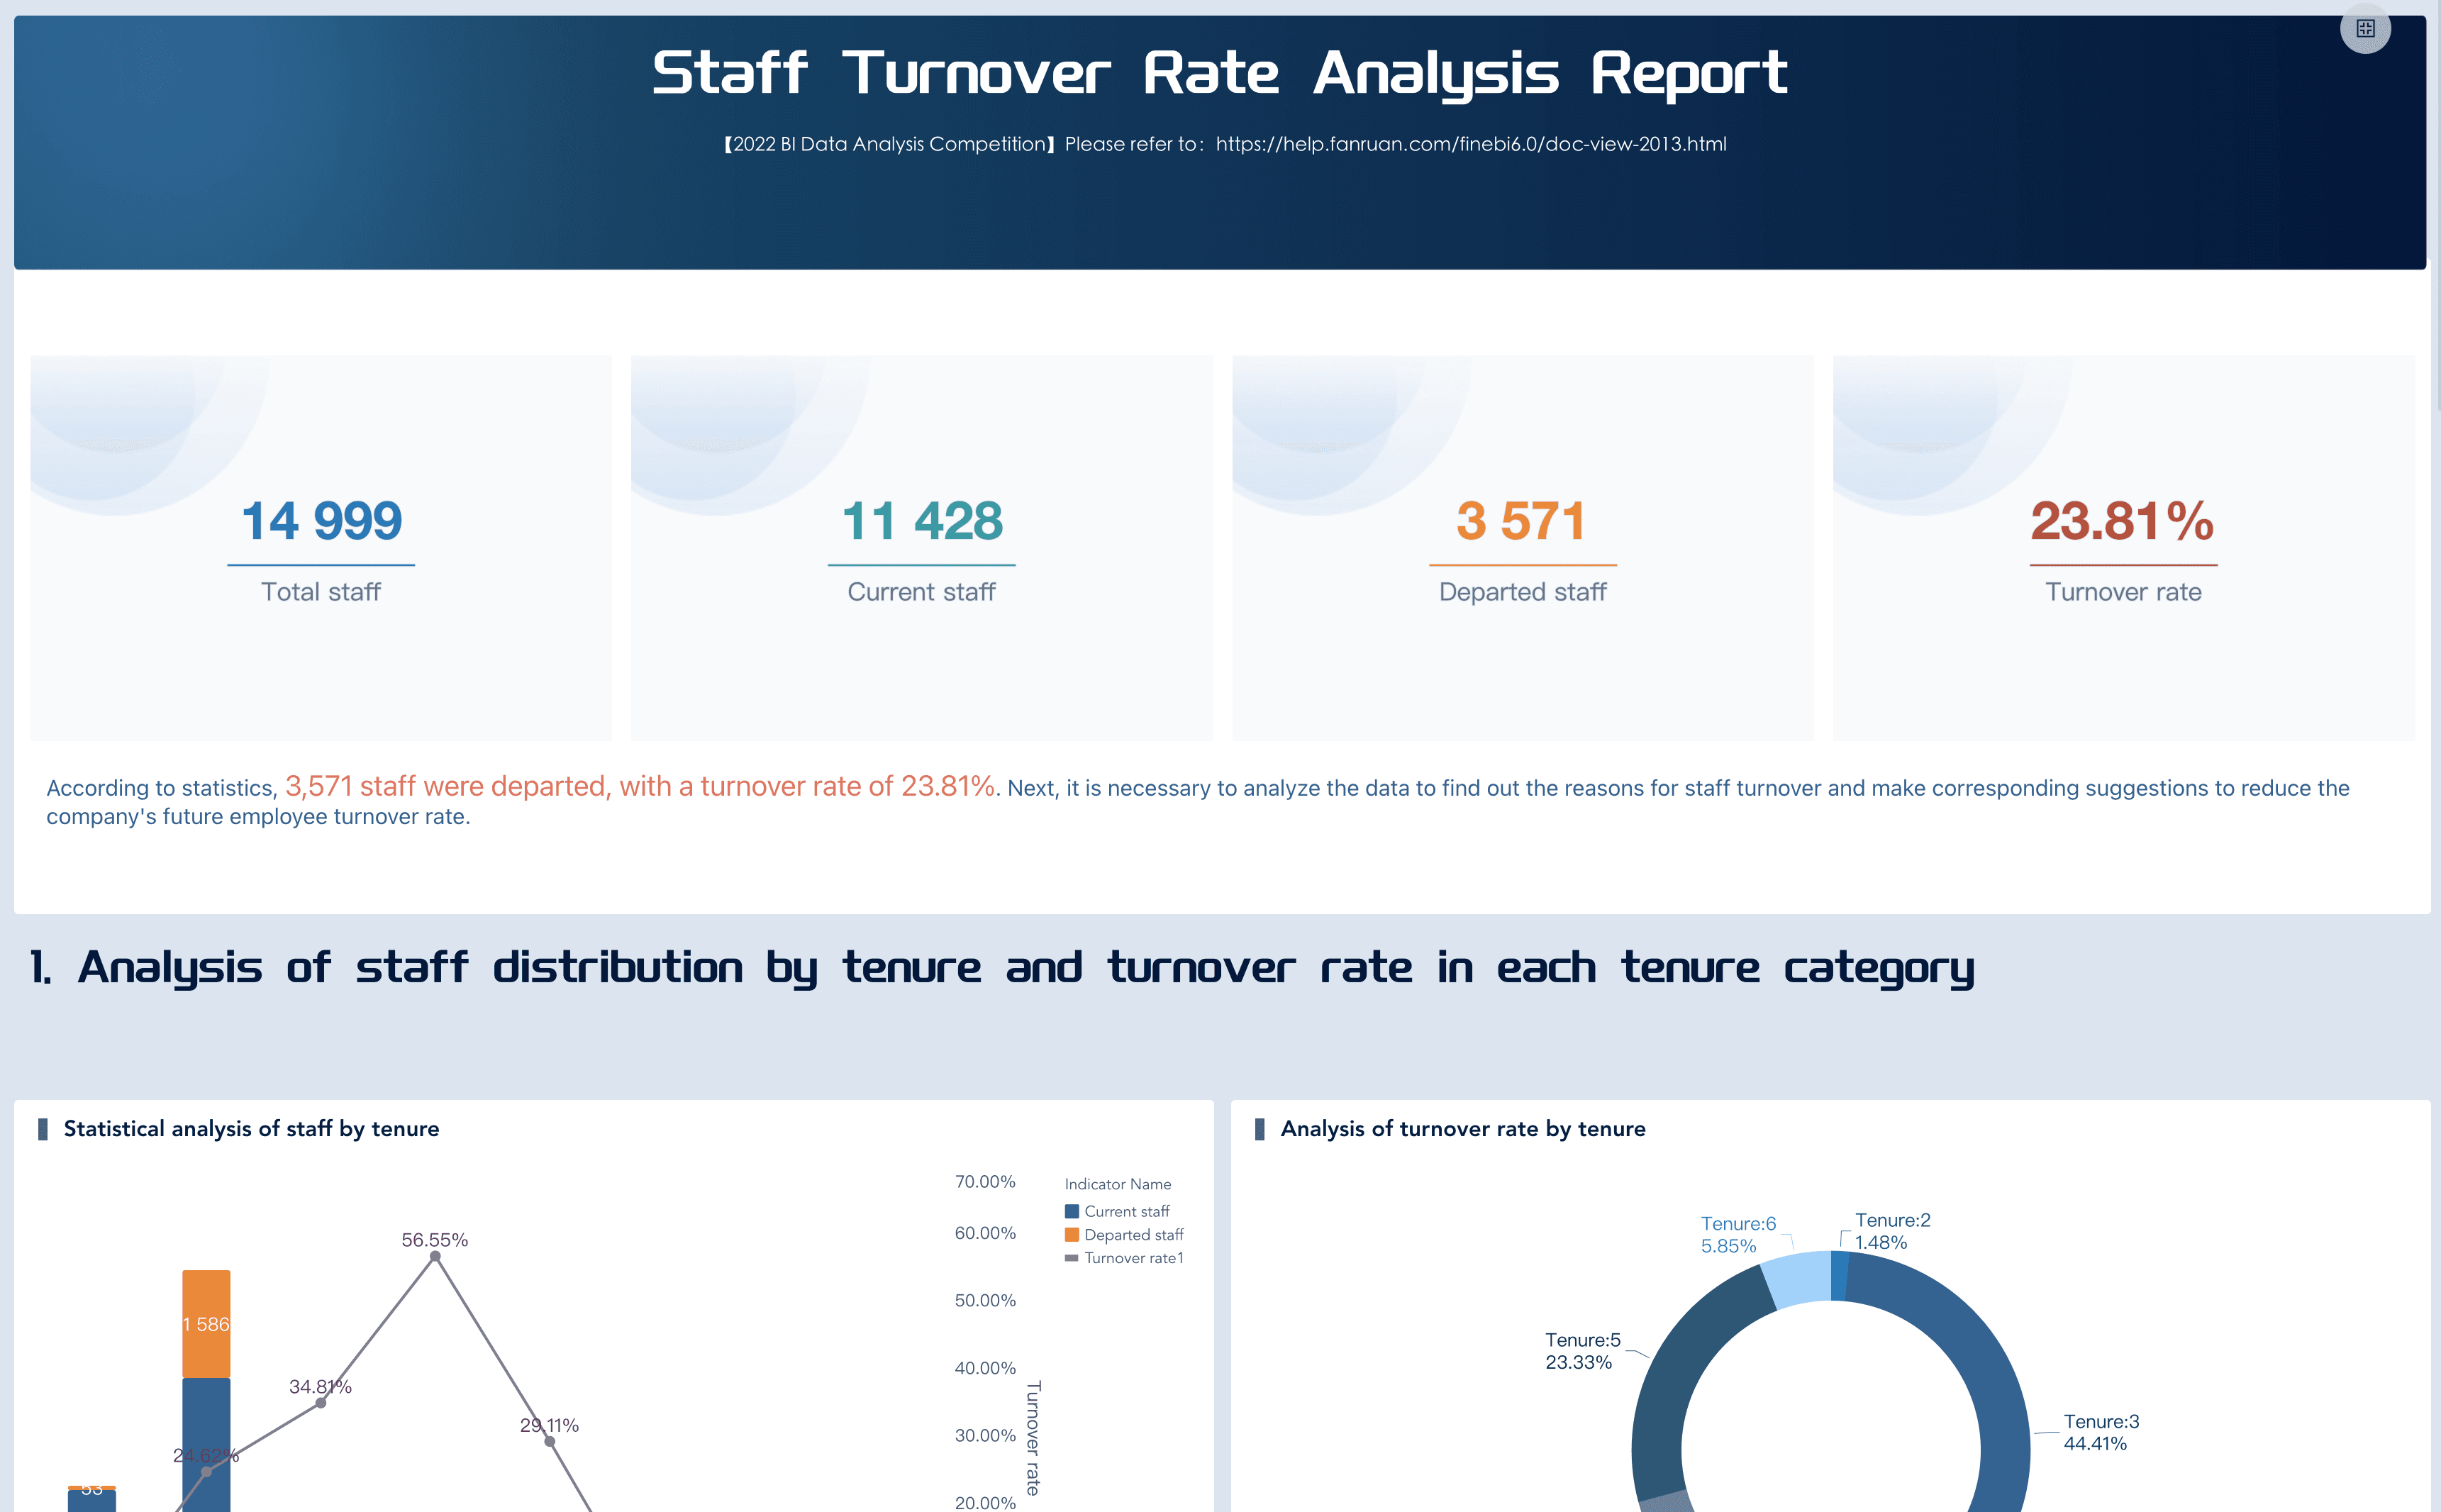
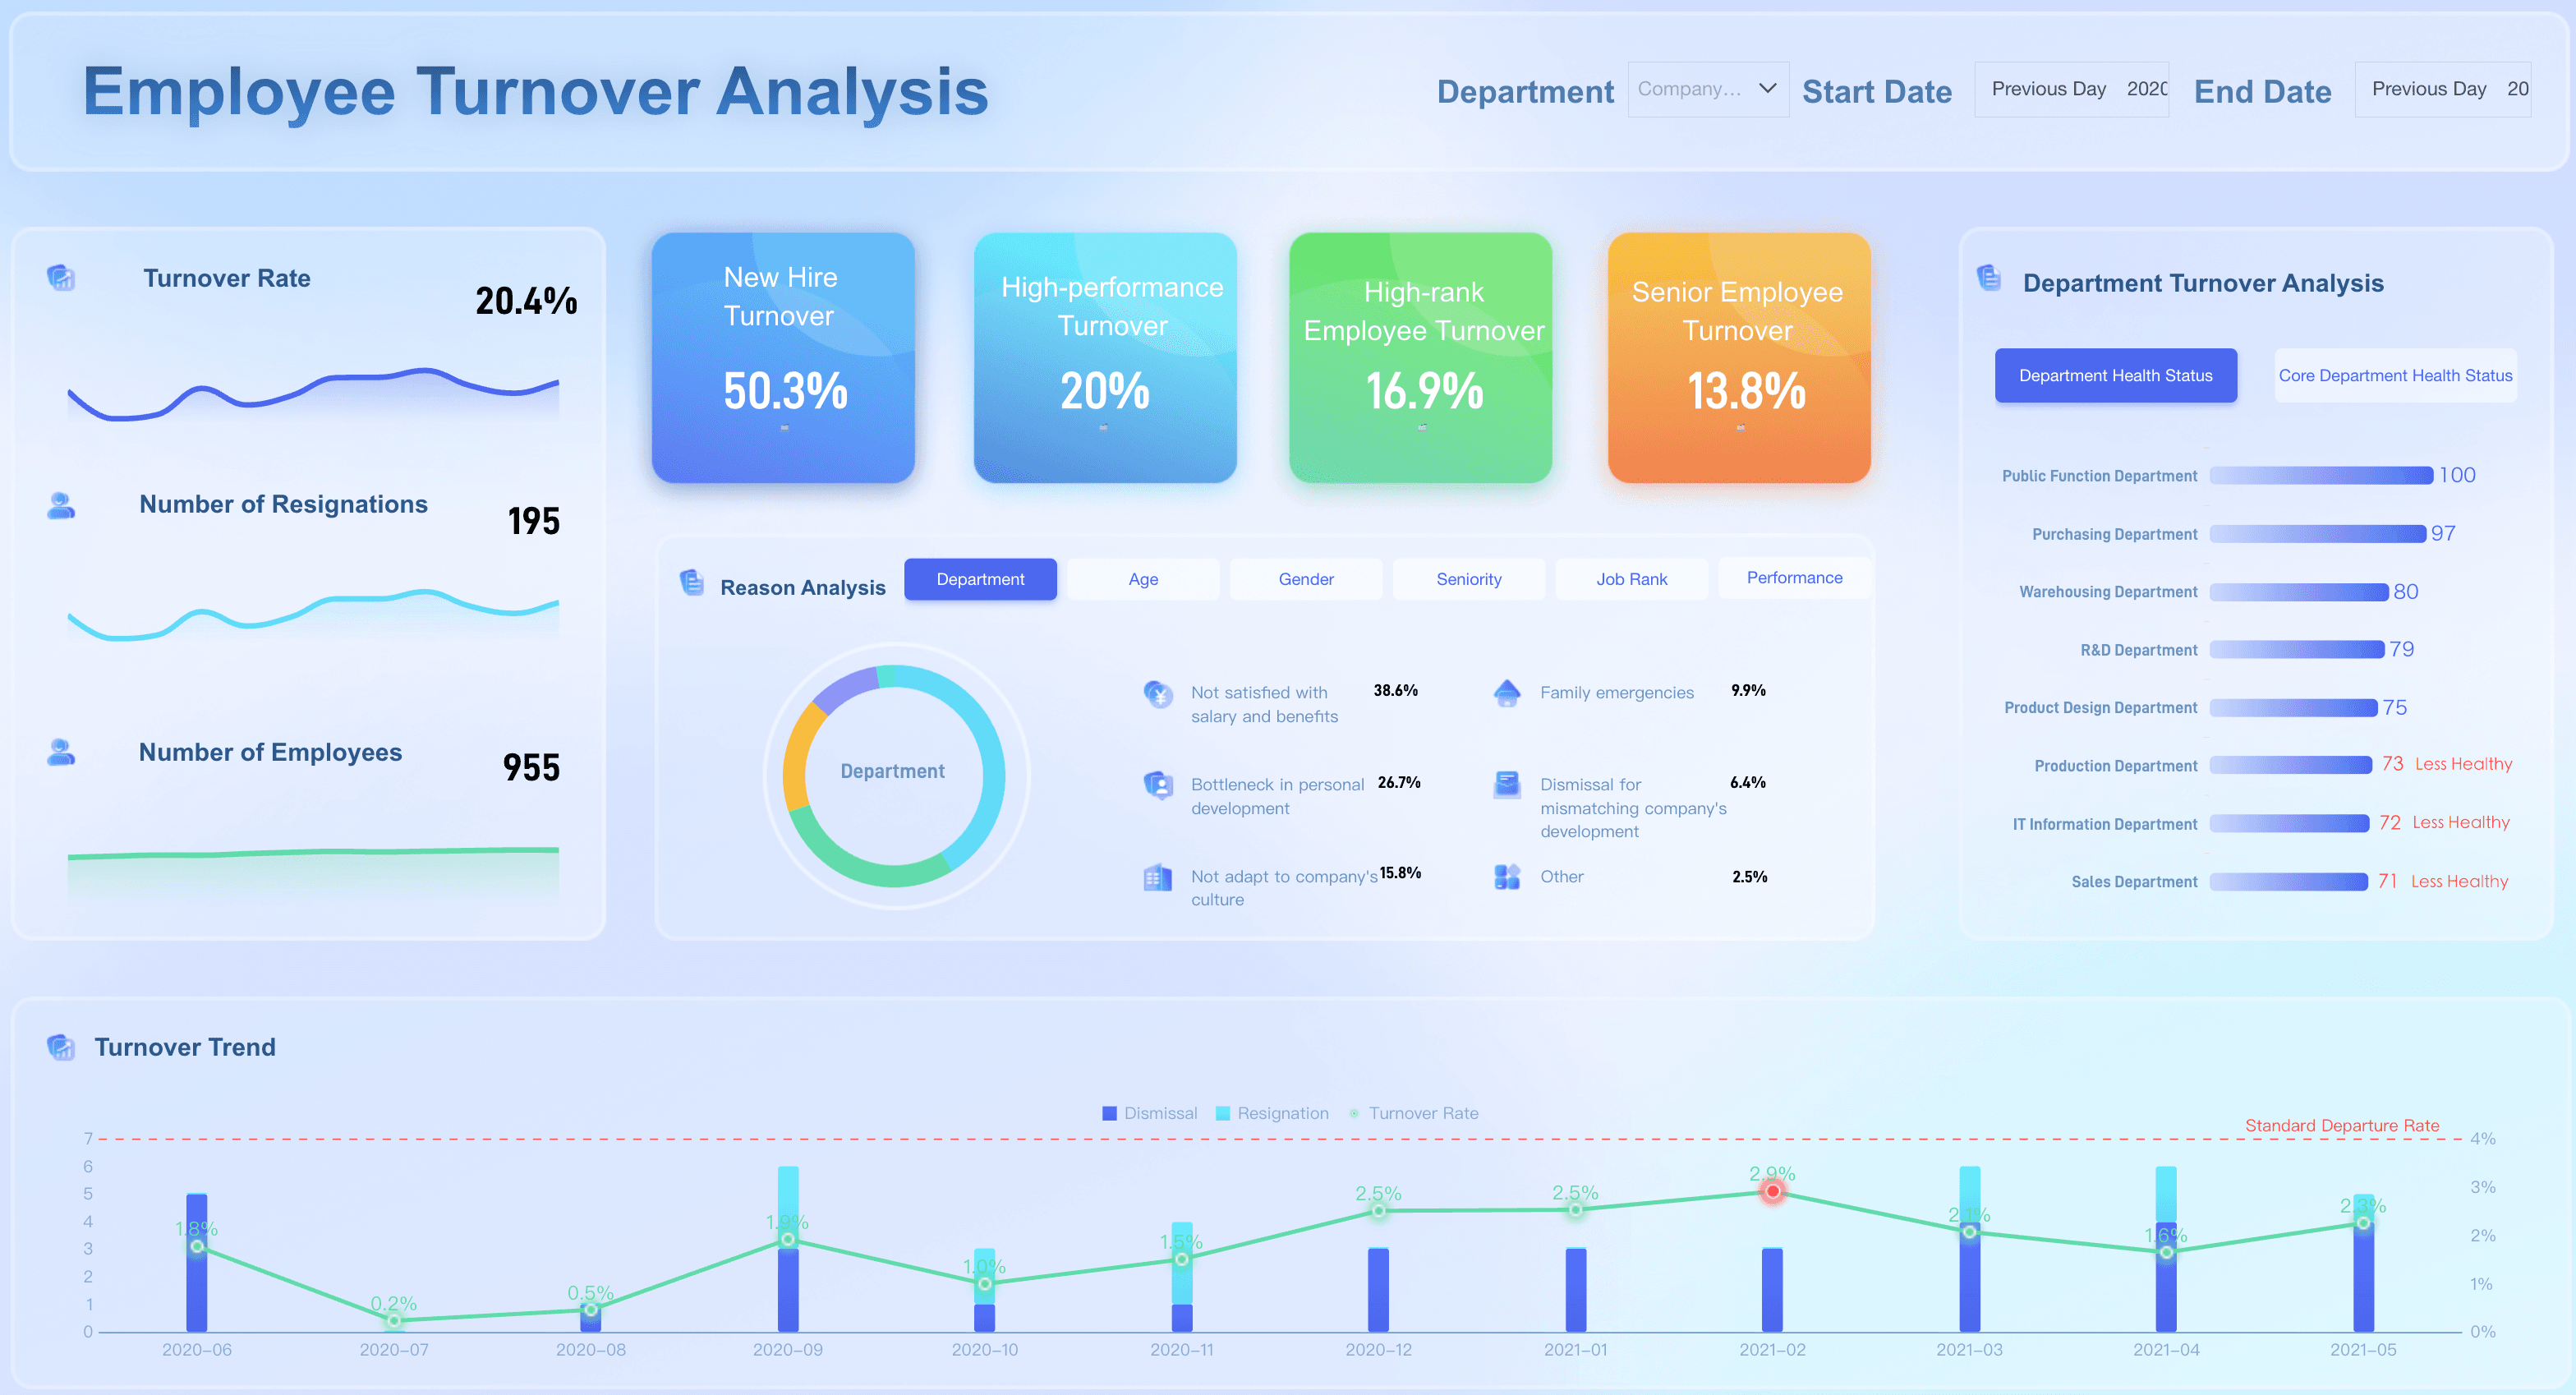
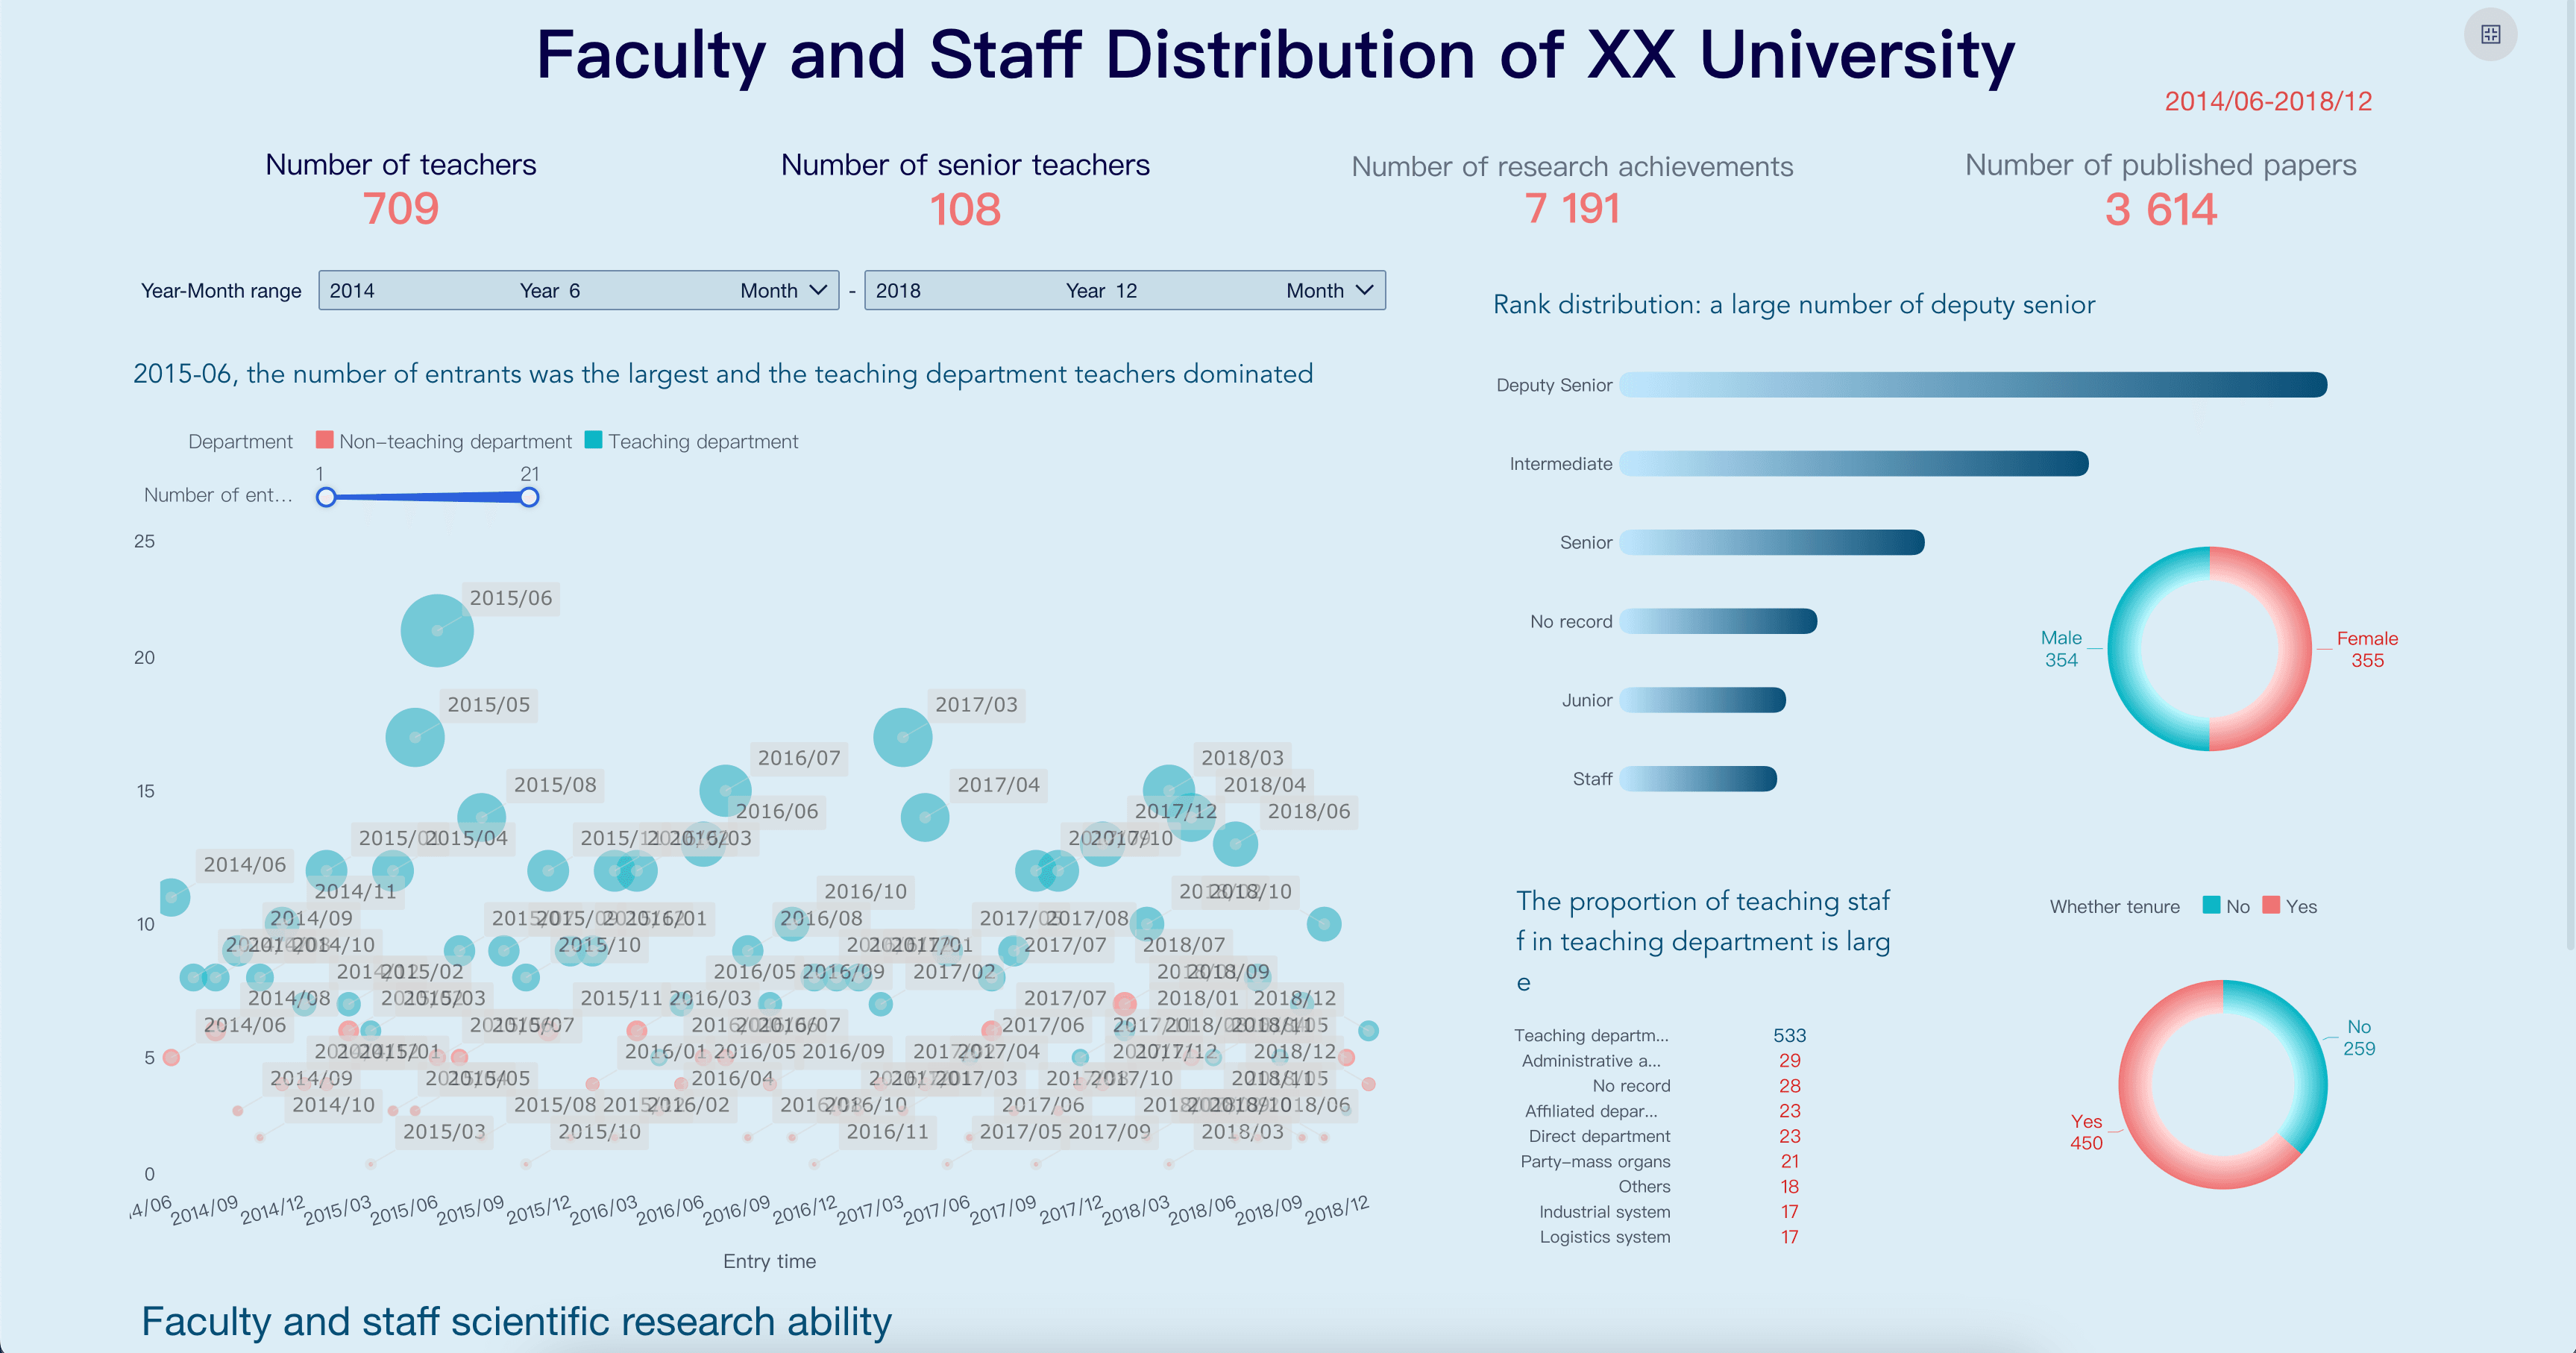
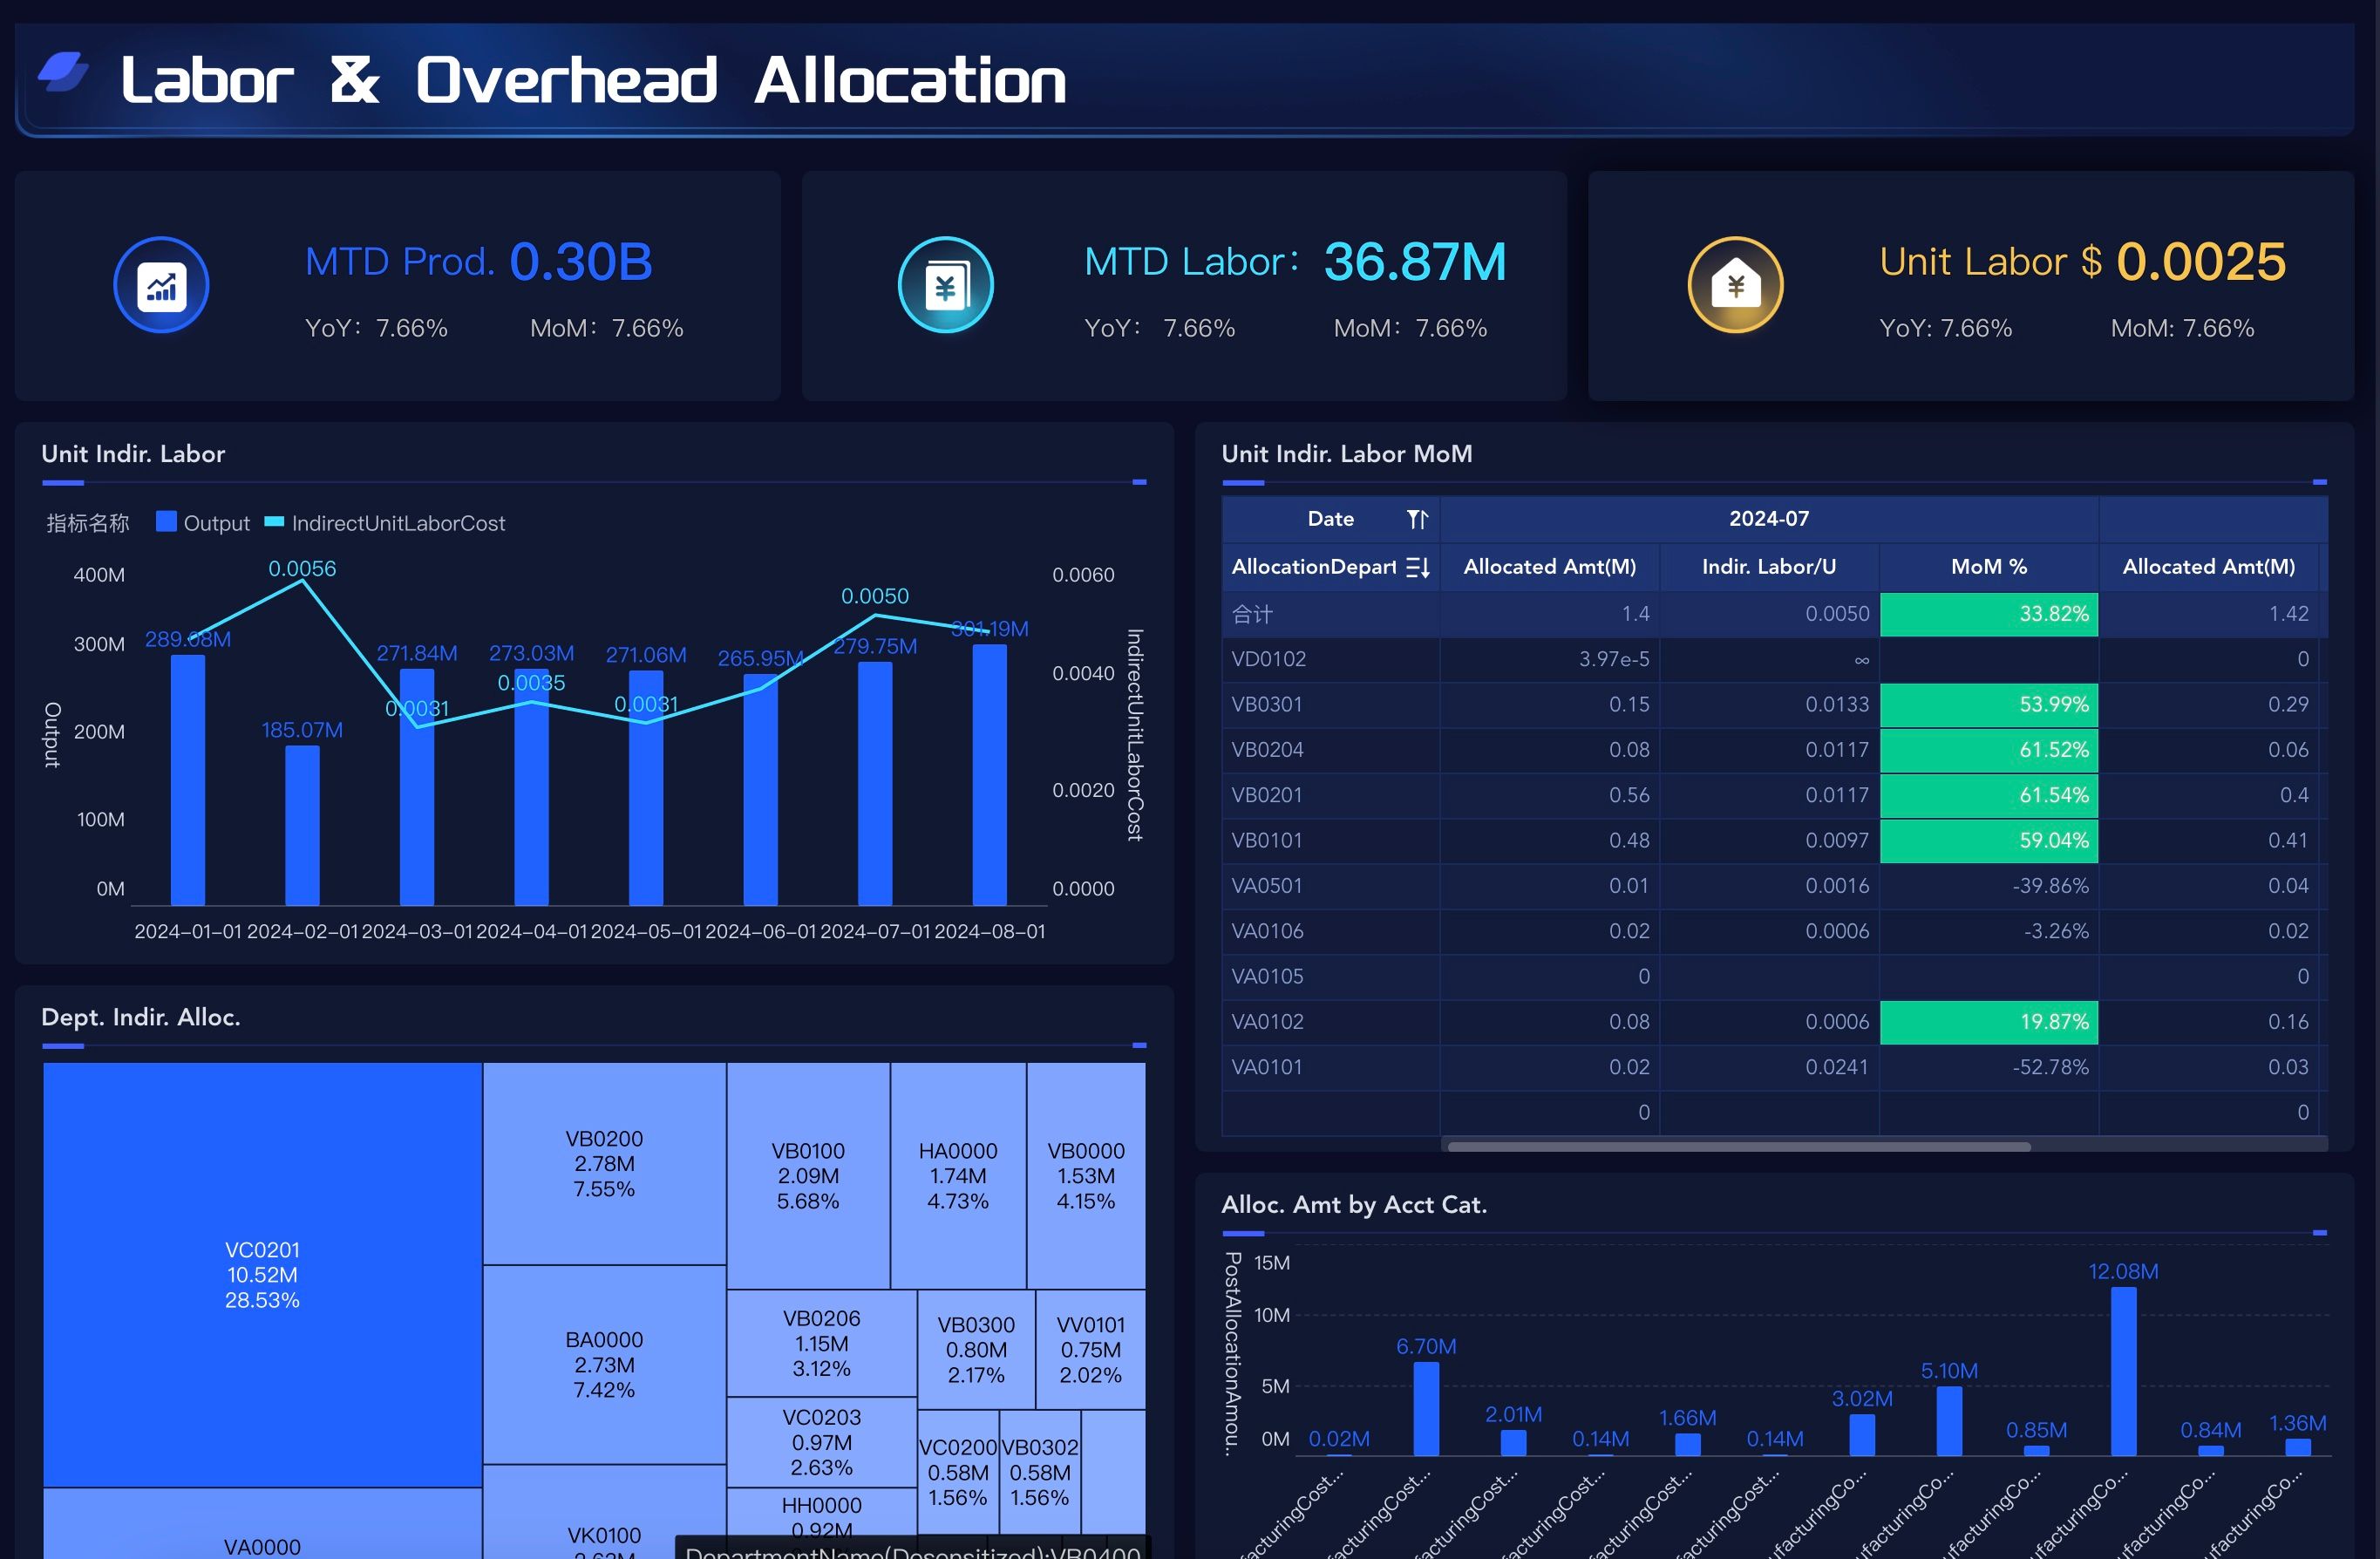
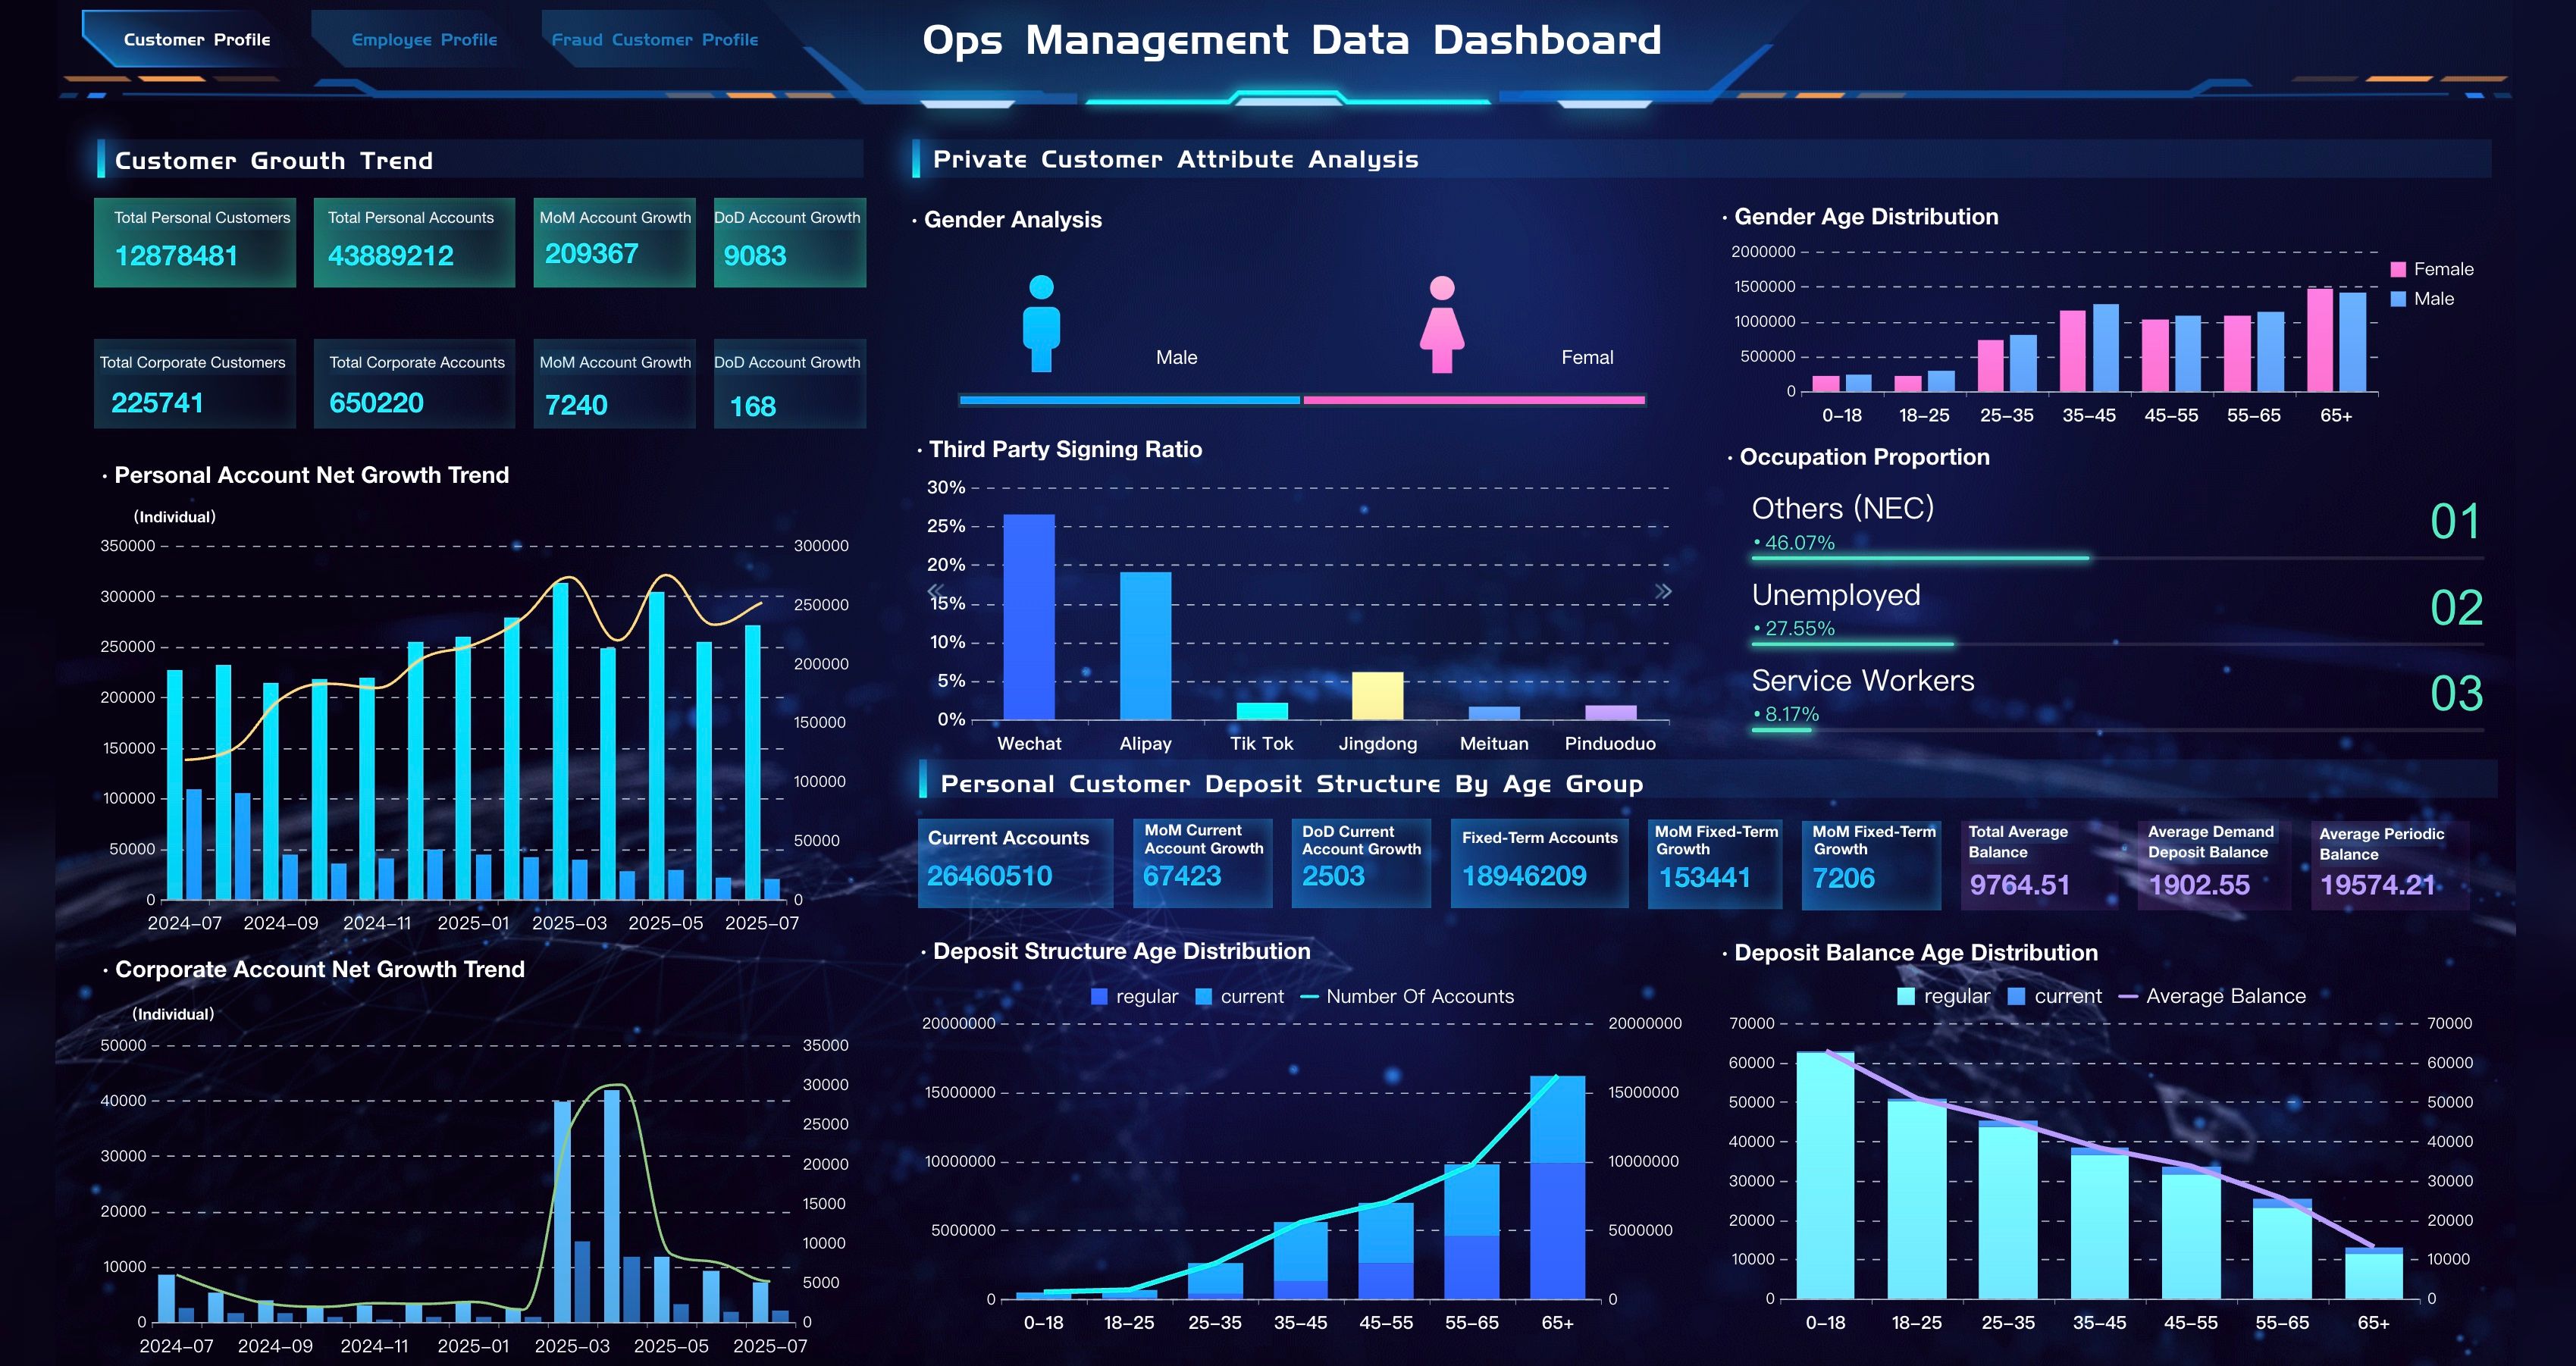
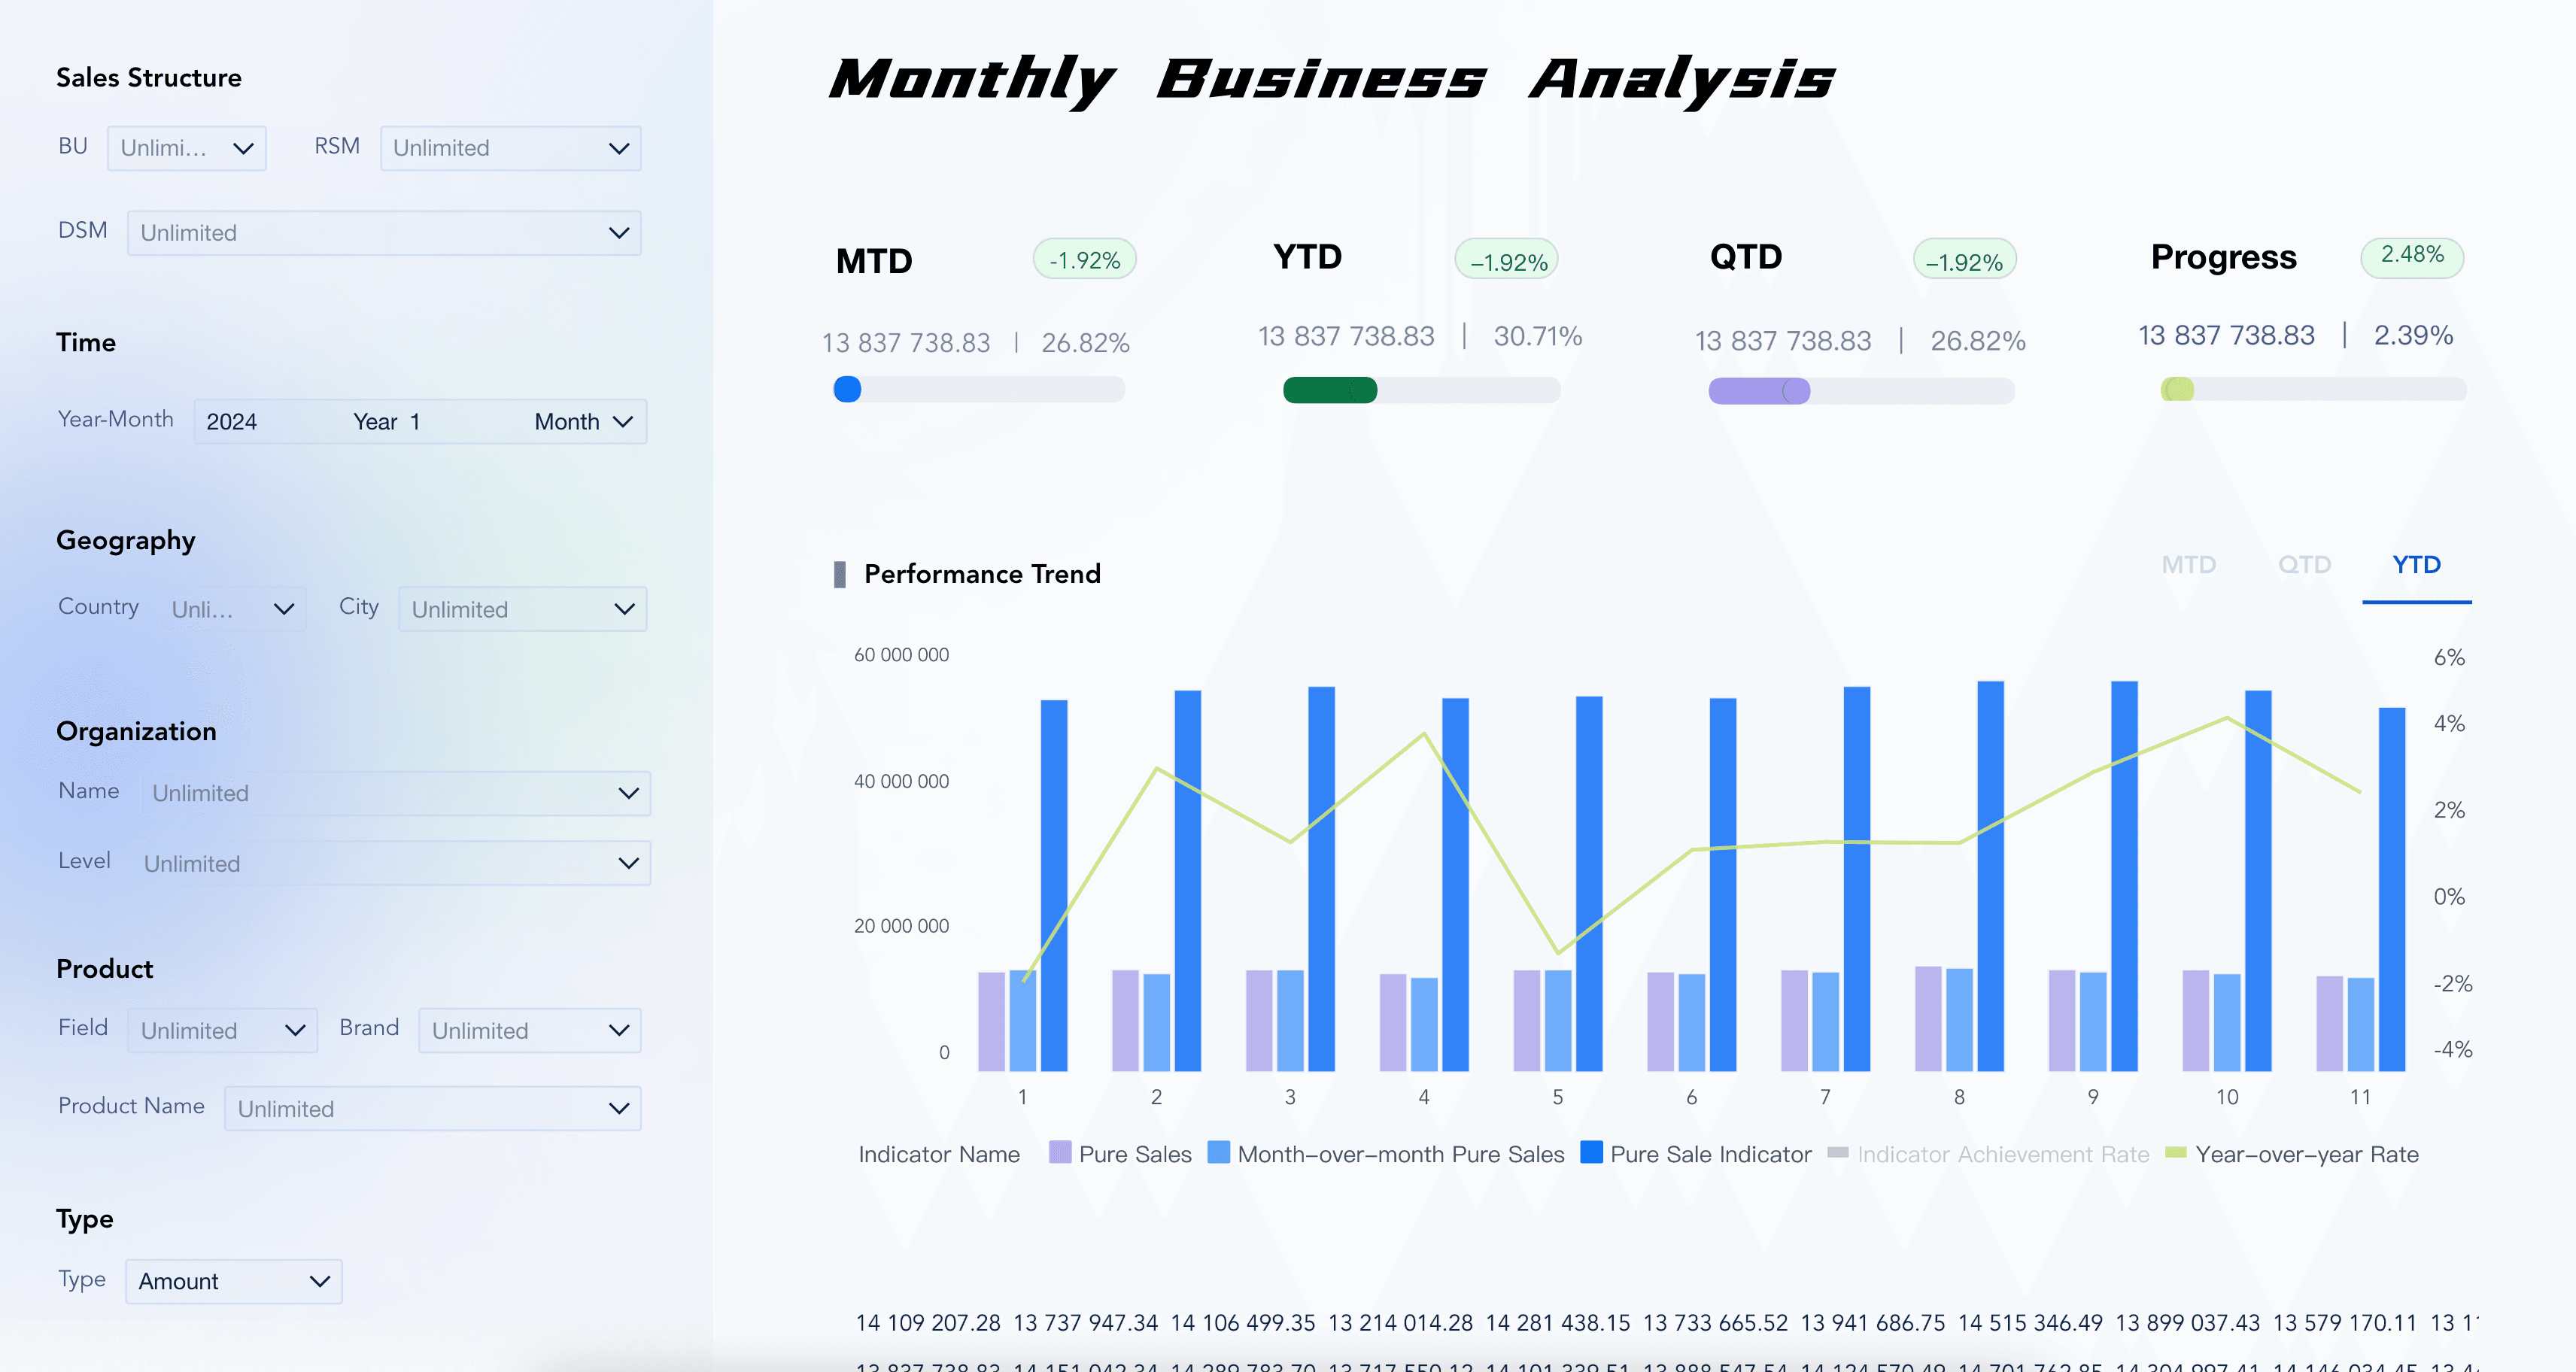
Examples make HR analytics easier to understand because they turn a broad idea into specific workforce questions. The demo cards below come from the Gallery demo file and match HR analytics topics such as employee turnover, retention analysis, staff overview, workforce cost, employee compliance, team performance, and leadership review.
Use these examples as learning prompts. Before copying a layout, ask: Who will use this view? What decision should it support? Which people data should be masked, aggregated, or permission-controlled?
Data Sources
HR analytics depends on connected data, but people data needs more care than many operational datasets. The visual layer may look complete while the underlying definitions, permissions, and source timing remain unclear.
Common HR analytics data sources include:
HRIS or HCM
- Example data: Employee profile, department, manager, role, location, employment status
- Common analytics use: Headcount, workforce structure, employee lifecycle analysis
ATS
- Example data: Requisitions, candidates, sources, stages, offers, acceptance
- Common analytics use: Recruiting funnel, time to fill, source quality
Payroll and Compensation
- Example data: Salary, overtime, payroll cost, bonus, pay band, cost center
- Common analytics use: Workforce cost, compensation analysis, finance alignment
Time and Attendance
- Example data: Absence, overtime, shift coverage, clock-in data, schedule
- Common analytics use: Workforce operations, staffing risk, attendance trends
Performance Management
- Example data: Goals, reviews, ratings, promotion, calibration notes
- Common analytics use: Performance trend, talent review, manager support
Learning Systems
- Example data: Training enrollment, completion, certification, learning hours
- Common analytics use: Skill coverage, compliance training, capability building
Engagement Surveys
- Example data: Scores, response rate, themes, sentiment, manager feedback
- Common analytics use: Employee experience, engagement risk, culture signals
HR Service Desk
- Example data: Case type, response time, SLA, unresolved requests
- Common analytics use: HR operations, service quality, employee support
Finance or ERP
- Example data: Budget, revenue, cost center, labor allocation, project cost
- Common analytics use: Workforce cost, productivity context, planning
Spreadsheets
- Example data: Local targets, manual notes, transition-stage data
- Common analytics use: Temporary context, exception tracking, data migration
Before building charts, define the business terms. "Headcount," "active employee," "voluntary turnover," "regretted attrition," "open requisition," "time to fill," "manager," "department," and "workforce cost" can mean different things across systems.
This is where business intelligence, data dashboard, and HR data governance become practical. The dashboard is only as useful as the data model, metric dictionary, refresh rhythm, permission rules, and review process behind it.
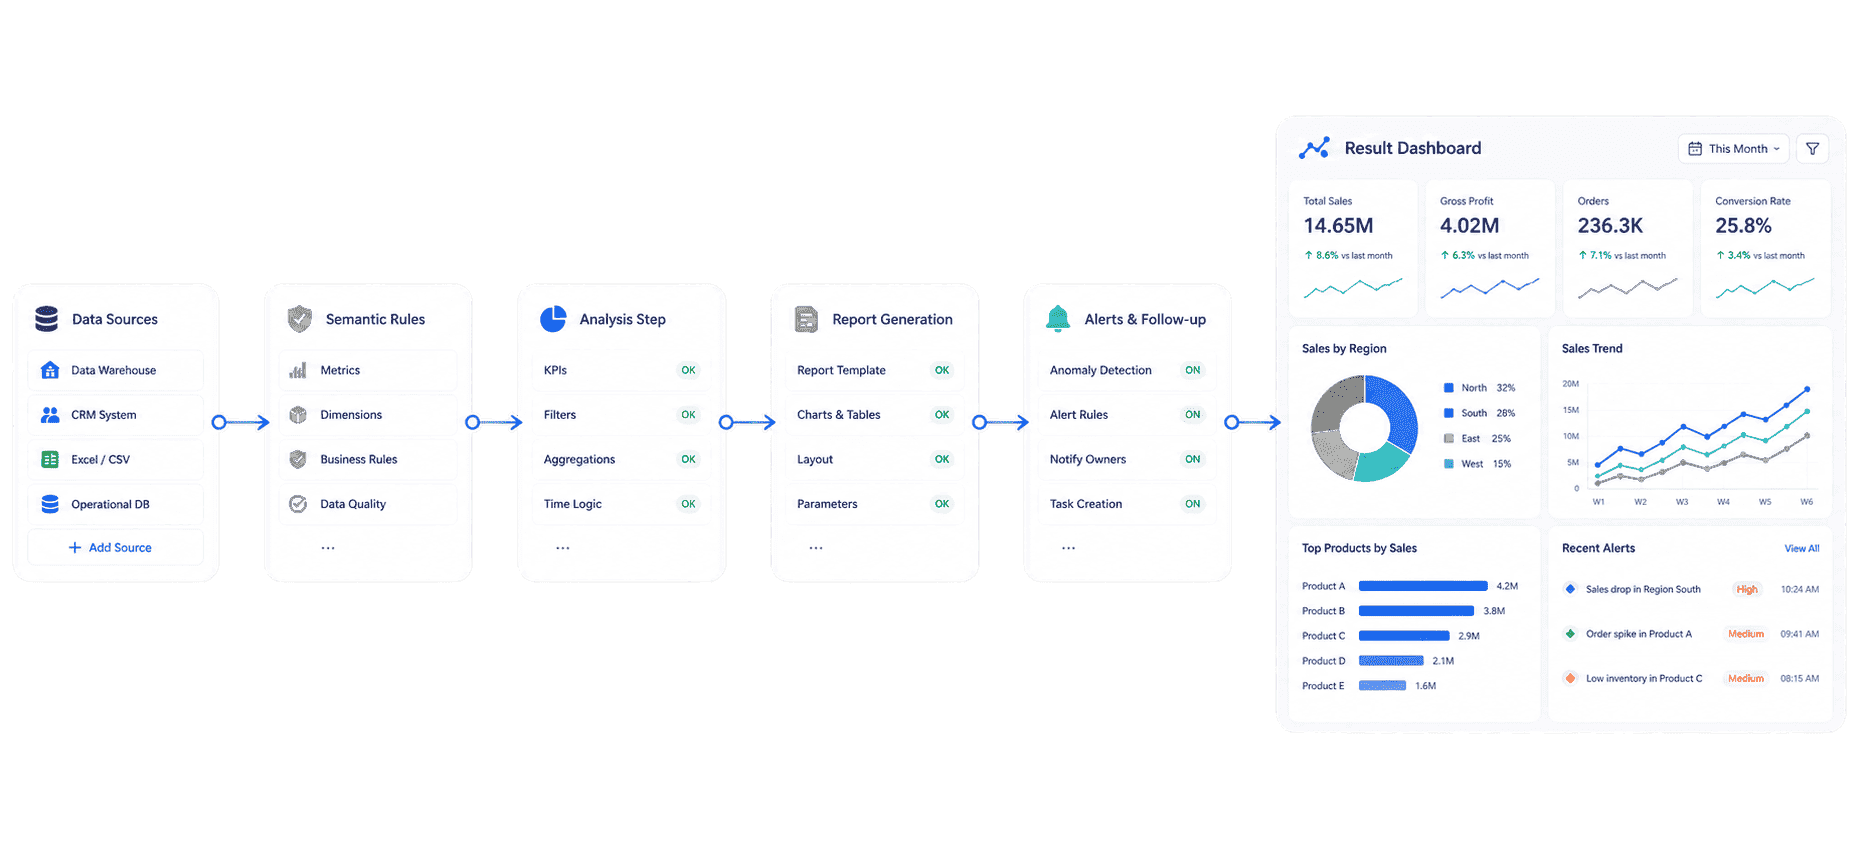
HR Analytics Workflow
HR analytics becomes useful when the workflow is repeatable. The first version does not need to answer every people question. It should answer one recurring workforce decision well.
Use this workflow as a practical build path:
- Choose one decision. Start with a clear question, such as "Why is turnover rising in one department?" or "Which hiring stage causes the most delay?"
- Define the audience. Decide whether the view is for executives, HR leaders, HRBPs, recruiters, finance, managers, or analysts.
- Map the data sources. List systems, fields, refresh frequency, owners, sensitivity level, and known quality issues.
- Standardize KPI definitions. Write formulas for headcount, turnover rate, retention rate, time to fill, offer acceptance, absence, overtime, and workforce cost.
- Set privacy rules. Decide what can be shown by role, what must be aggregated, and which employee-level fields require restricted access.
- Create the visual structure. Use a small set of charts that match the question: trends for movement, bars for comparison, funnels for hiring, cohorts for retention, and tables for detail.
- Add commentary. Explain what changed, why it matters, what may have caused it, and what should happen next.
- Assign follow-up. Every meaningful recommendation should have an owner, next step, and review date.
- Review and refine. Remove metrics that do not change decisions. Add fields only when users need them to act responsibly.
This workflow also helps teams decide when to use an employee dashboard, when to build a people analytics dashboard, and when a broader workforce analytics dashboard is needed.
Challenges
HR analytics often fails for organizational reasons before it fails for technical reasons. The dashboard may look polished, but if people do not trust the definitions or data handling, the meeting turns into a debate about numbers instead of a decision about support.
Common challenges include:
- Fragmented systems: HRIS, ATS, payroll, performance, engagement, and finance systems may not share the same employee, department, or manager structure.
- Inconsistent definitions: Teams may calculate headcount, turnover, internal mobility, time to fill, or workforce cost differently.
- Sensitive data risk: Employee-level records, compensation, performance, health-related absence, and protected attributes need strict permission and aggregation rules.
- Small sample problems: A high turnover rate in a small team may look alarming but require context before action.
- Bias and overinterpretation: Analytics can reveal patterns, but it should not become a shortcut for unfair employee judgment.
- Too many metrics: A crowded dashboard hides the few people issues that need action.
- Weak ownership: Insights fade when no one owns the follow-up conversation.
- Overconfident AI output: AI-generated explanations can mislead users if they are not grounded in governed metrics, source traceability, permissions, and human review.
The fix is not just better visuals. A trusted HR analytics system needs data ownership, metric governance, role-based permissions, privacy rules, source traceability, manager context, and review habits.
HR Analytics With FineBI + Dora
After the HR analytics method is clear, FineBI + Dora can support a learning path from governed people dashboards to AI-assisted follow-up.
FineBI can support the visual and analytical layer of HR analytics: connecting HR data sources, modeling metrics, creating interactive dashboards, managing permissions, and helping HR users explore workforce performance without waiting for every new report request. This matters because HR analytics depends on consistent definitions. If every dashboard calculates turnover, headcount, or workforce cost differently, leaders will not trust the narrative.
Dora adds the AI action layer above those governed BI assets. It can help users ask natural-language questions, search existing dashboards, generate charts or structured briefings from configured data assets, summarize changes, push scheduled updates, and follow up with responsible owners. dora should not replace HR judgment, manager judgment, legal review, or employee relations processes. It works best when it operates on trusted metrics, business terms, permissions, Skills, source traceability, and human review.
For IT teams, this shifts work from manually building every HR report to maintaining data connections, semantic rules, permissions, and reusable workflows. For HR users, it reduces the wait between a people question and a useful first analysis. For executives, it makes workforce review clearer: what changed, why it matters, who owns the next step, and what will be checked next.
The practical reason this scenario can land in a real enterprise is simple: scenario + product + service. Choose one recurring HR analytics workflow, use FineBI to govern the dashboard and metric layer, use dora to make the workflow easier to query and follow up, and support rollout with data connection, KPI definition, permission setup, Skills configuration, and user training.
If your team is exploring AI-assisted analytics beyond HR, related learning paths include AI agent workflow and data agent use cases for recurring business analysis.
 Dora's Workflow
HR Analytics Hub
This HR analytics guide should work as one spoke in a broader workforce, dashboard, and BI learning path. Use these related resources when you want to go deeper into a specific topic:
- Start with the existing hr analytics primer when you need a shorter business overview.
- Use hr dashboard resources when the first need is continuous people metric monitoring.
- Review hr analytics dashboard ideas when you need examples for connecting metrics and workforce context.
- Explore workforce analytics when the focus is broader capacity, cost, staffing, and planning.
- Study workforce metrics dashboard examples when you are defining recurring workforce KPIs.
- Use recruitment analytics dashboard resources when hiring funnel performance is the main question.
- Pair this page with employee performance dashboard and workforce management dashboard resources for role-specific views.
- Review dashboard examples, analytics dashboard, and dashboard design when you need a stronger visual design foundation.
The main idea is simple: use HR analytics to turn scattered people data into shared learning. A dashboard can show the signal. A report can explain the period. An AI data agent can help users ask the next question, generate the next briefing, and keep follow-up moving inside a governed workflow.
FAQs
HR analytics is the process of collecting, connecting, analyzing, and explaining workforce data so teams can make better decisions about hiring, retention, performance, engagement, learning, workforce cost, and organizational risk. It helps HR move from raw people metrics to decisions and follow-up.
The terms often overlap. HR analytics is usually tied to HR processes such as recruiting, turnover, compensation, performance, and HR operations. People analytics may be used more broadly to include employee experience, organizational behavior, culture, productivity, and workforce planning. In practice, both need trusted data, clear definitions, permissions, and human context.
The best metrics depend on the decision. Common high-value metrics include headcount, vacancy rate, time to fill, offer acceptance rate, turnover rate, voluntary attrition, retention rate, engagement score, absence rate, overtime, training completion, promotion rate, internal mobility, and workforce cost.
Common sources include HRIS or HCM systems, ATS, payroll, time and attendance, performance management, learning systems, engagement surveys, HR service desk data, finance systems, and spreadsheets. The exact sources depend on whether the team is analyzing hiring, retention, cost, performance, engagement, learning, or risk.
HR analytics can help identify patterns associated with turnover risk, such as tenure, role, workload, engagement change, manager movement, compensation position, career path, or absence trend. Predictions should be treated as signals for human review, not automatic judgments about individual employees.
Use role-based permissions, aggregation thresholds, masking, approved metric definitions, source traceability, and clear review rules. Sensitive fields such as compensation, performance notes, protected attributes, absence details, and employee relations data should be handled with strict governance.
FineBI can help teams connect HR data, model trusted metrics, build dashboards, manage permissions, and support visual analysis. dora can act as the AI Data Agent layer that answers follow-up questions, generates scheduled summaries, flags abnormal changes, pushes owner-specific follow-ups, and summarizes unresolved issues based on governed BI assets. Human review should remain part of the workflow.
