
What is a Marketing Report?
Marketing Report vs. Marketing Dashboard
A marketing report and a marketing dashboard often use the same data, but they serve different decision moments.
A marketing dashboard is built for continuous monitoring. It helps teams check current performance, detect abnormal changes, and explore metrics through filters and drill-downs. A dashboard may show live or scheduled updates for traffic, spend, conversions, pipeline, revenue, customer acquisition cost, channel ROI, email engagement, or social media performance.
A marketing report is built for review and explanation. It usually has a reporting period, an audience, a narrative, and recommendations. A monthly marketing report may explain why paid search cost increased, why organic traffic changed, which campaigns generated qualified pipeline, and what budget changes should happen next month.
The two formats work best together. Use a dashboard to watch the numbers. Use a marketing report to translate those numbers into decisions.
Why Marketing Reports Matter Now
Marketing teams do not lack data. They often lack a shared story about what the data means.
Without a clear reporting structure, each team may bring a different export to the same meeting. Paid media may focus on cost per click. Content may focus on organic traffic. Sales may care about opportunity quality. Finance may ask whether spend created enough revenue. A marketing report gives these teams one place to align the numbers, assumptions, and next actions.
A strong marketing report helps teams:
- Connect activity to outcomes: Show how campaigns, channels, content, and audience segments affect pipeline, revenue, retention, or customer value.
- Explain variance: Compare actual performance with targets, previous periods, seasonality, campaign launches, budget changes, and market events.
- Improve budget decisions: Identify which channels deserve more investment, which need repair, and which should be paused or re-tested.
- Support sales alignment: Pair marketing-sourced leads with CRM reporting, opportunity progression, win rate, and deal quality.
- Reduce reporting friction: Replace scattered spreadsheets and slide updates with one governed reporting rhythm.
- Build institutional learning: Preserve commentary, decisions, campaign context, and lessons learned so future teams do not repeat the same analysis from scratch.
This is why a marketing report should not be treated as a monthly screenshot collection. It should be a repeatable learning system: define the question, collect trusted data, explain the result, recommend the action, and track the follow-up.
Don’t just collect campaign data. Visualize what matters in your marketing report.
Download the KPI Dashboard Guide to strengthen your marketing report foundation:
- How to turn marketing goals into measurable KPI views
- 10 essential steps to build effective KPI dashboards
- How to choose the right charts and avoid visual clutter
- 15 top-notch dashboard templates for 2026

Metrics of Marketing Report
The best marketing report metrics depend on the decision you need to support. A leadership report should not look like a channel operator's report. A campaign review should not look like a quarterly board update. Start with the audience, then choose the smallest set of metrics that explains performance.
Common marketing report metrics include:
1. Reach and Awareness
Example metrics
- Impressions
- Reach
- Share of voice
- Branded search
- Social followers
What it helps answer Are more people discovering the brand?
2. Traffic and Engagement
Example metrics
- Sessions
- Users
- Landing page views
- Bounce rate
- Time on page
- Content engagement
What it helps answer Which audiences and content assets attract attention?
3. Lead Generation
Example metrics
- Form fills
- Demo requests
- Trial signups
- Newsletter subscribers
- Event registrations
What it helps answer Is marketing creating enough demand?
4. Funnel Conversion
Example metrics
- Visit-to-lead rate
- Lead-to-MQL rate
- MQL-to-SQL rate
- Opportunity conversion
What it helps answer Where does the funnel slow down?
5. Revenue and Pipeline
Example metrics
- Marketing-sourced pipeline
- Influenced pipeline
- Closed-won revenue
- Average deal size
What it helps answer How does marketing contribute to sales outcomes?
6. Cost and Efficiency
Example metrics
- Spend
- Cost per lead
- Cost per MQL
- Cost per acquisition
- ROAS
- ROI
What it helps answer Which channels use budget efficiently?
7. Retention and Customer Value
Example metrics
- Repeat purchase
- Churn
- Expansion
- Customer lifetime value
- Activation rate
What it helps answer Does marketing support customer growth after acquisition?
8. Quality and Trust
Example metrics
- Data completeness
- Attribution confidence
- Duplicate leads
- Source coverage
What it helps answer Can stakeholders trust the report?
Avoid reporting every available metric. If a number does not help explain performance, diagnose a problem, or support a decision, move it to an appendix or dashboard drill-down. The front of the report should focus on the metrics that matter most to the audience.
A practical marketing report usually combines three layers:
- Outcome metrics: Revenue, pipeline, qualified demand, customer value, retention, or strategic growth.
- Driver metrics: Traffic, conversion rate, spend, content engagement, channel mix, lead quality, or campaign activity.
- Context metrics: Targets, period comparisons, benchmark notes, data quality warnings, and known business events.
This layered structure also helps connect the report to business intelligence. The goal is not just to visualize marketing data. The goal is to make performance definitions repeatable enough that different teams can discuss the same numbers with confidence.
Types of Marketing Reports
Different marketing questions need different report formats. A single all-purpose report often becomes too long for executives and too shallow for channel owners. It is better to create a small reporting system with clear audiences.
Monthly performance view
A monthly marketing report summarizes the last closed period. It should include progress against goals, key wins, key misses, channel contribution, budget movement, and recommended actions for the next month. If your team needs a starting structure, a monthly marketing report template can help standardize the recurring sections.
Use it to answer:
- Did marketing hit the monthly goal?
- Which channels drove qualified demand?
- Which campaigns changed materially from last month?
- What should be increased, reduced, tested, or fixed next?
Digital marketing view
A digital marketing report focuses on web, paid, email, social, SEO, and conversion data. It is useful when teams need to connect online activity with pipeline or ecommerce outcomes. It should not stop at traffic. It should show whether the traffic created meaningful engagement, qualified leads, revenue, or customer actions.
Use it to answer:
- Which digital channels created the most qualified traffic?
- Where did conversion rates improve or decline?
- Which landing pages or campaigns need optimization?
- How did paid and organic performance interact?
Channel-specific view
Some channels need their own reports because the metrics, owners, and action paths are different. An email marketing report may focus on deliverability, open rate, click rate, conversion, unsubscribe rate, and revenue contribution. A social media marketing report may focus on reach, engagement, audience growth, content themes, referral traffic, and assisted conversions.
Use it to answer:
- Which channel tactics worked?
- Which segment or content type responded best?
- Which campaigns should be repeated, changed, or stopped?
- What did the channel teach the broader marketing team?
Stakeholder and business view
A B2B marketing report usually needs to connect marketing activity with sales pipeline, account quality, buying stage, opportunity value, and win rate. A KPI marketing report should translate campaign metrics into goal progress. A performance marketing report template is useful when paid media, acquisition cost, and conversion efficiency are central to the review.
Use it to answer:
- Did marketing help create the right pipeline?
- Are leads moving through the funnel at the expected rate?
- Is spend producing business value, not just activity?
- Which accounts, segments, or campaigns need follow-up?
Examples and Templates
Examples make marketing reporting easier to plan because they turn abstract metrics into concrete views. The demo cards below are useful for marketing report planning because they cover campaign attribution, customer analysis, conversion behavior, sales alignment, retail performance, and KPI presentation.
Use these examples as prompts, not as rigid templates. Before copying any layout, ask: Who will read the report? What decision should they make? Which metric definition must stay consistent across teams?
Marketing Analytics Platform

Consumer Data Center Solution
Conversion Analysis
Customer Analytics Dashboard
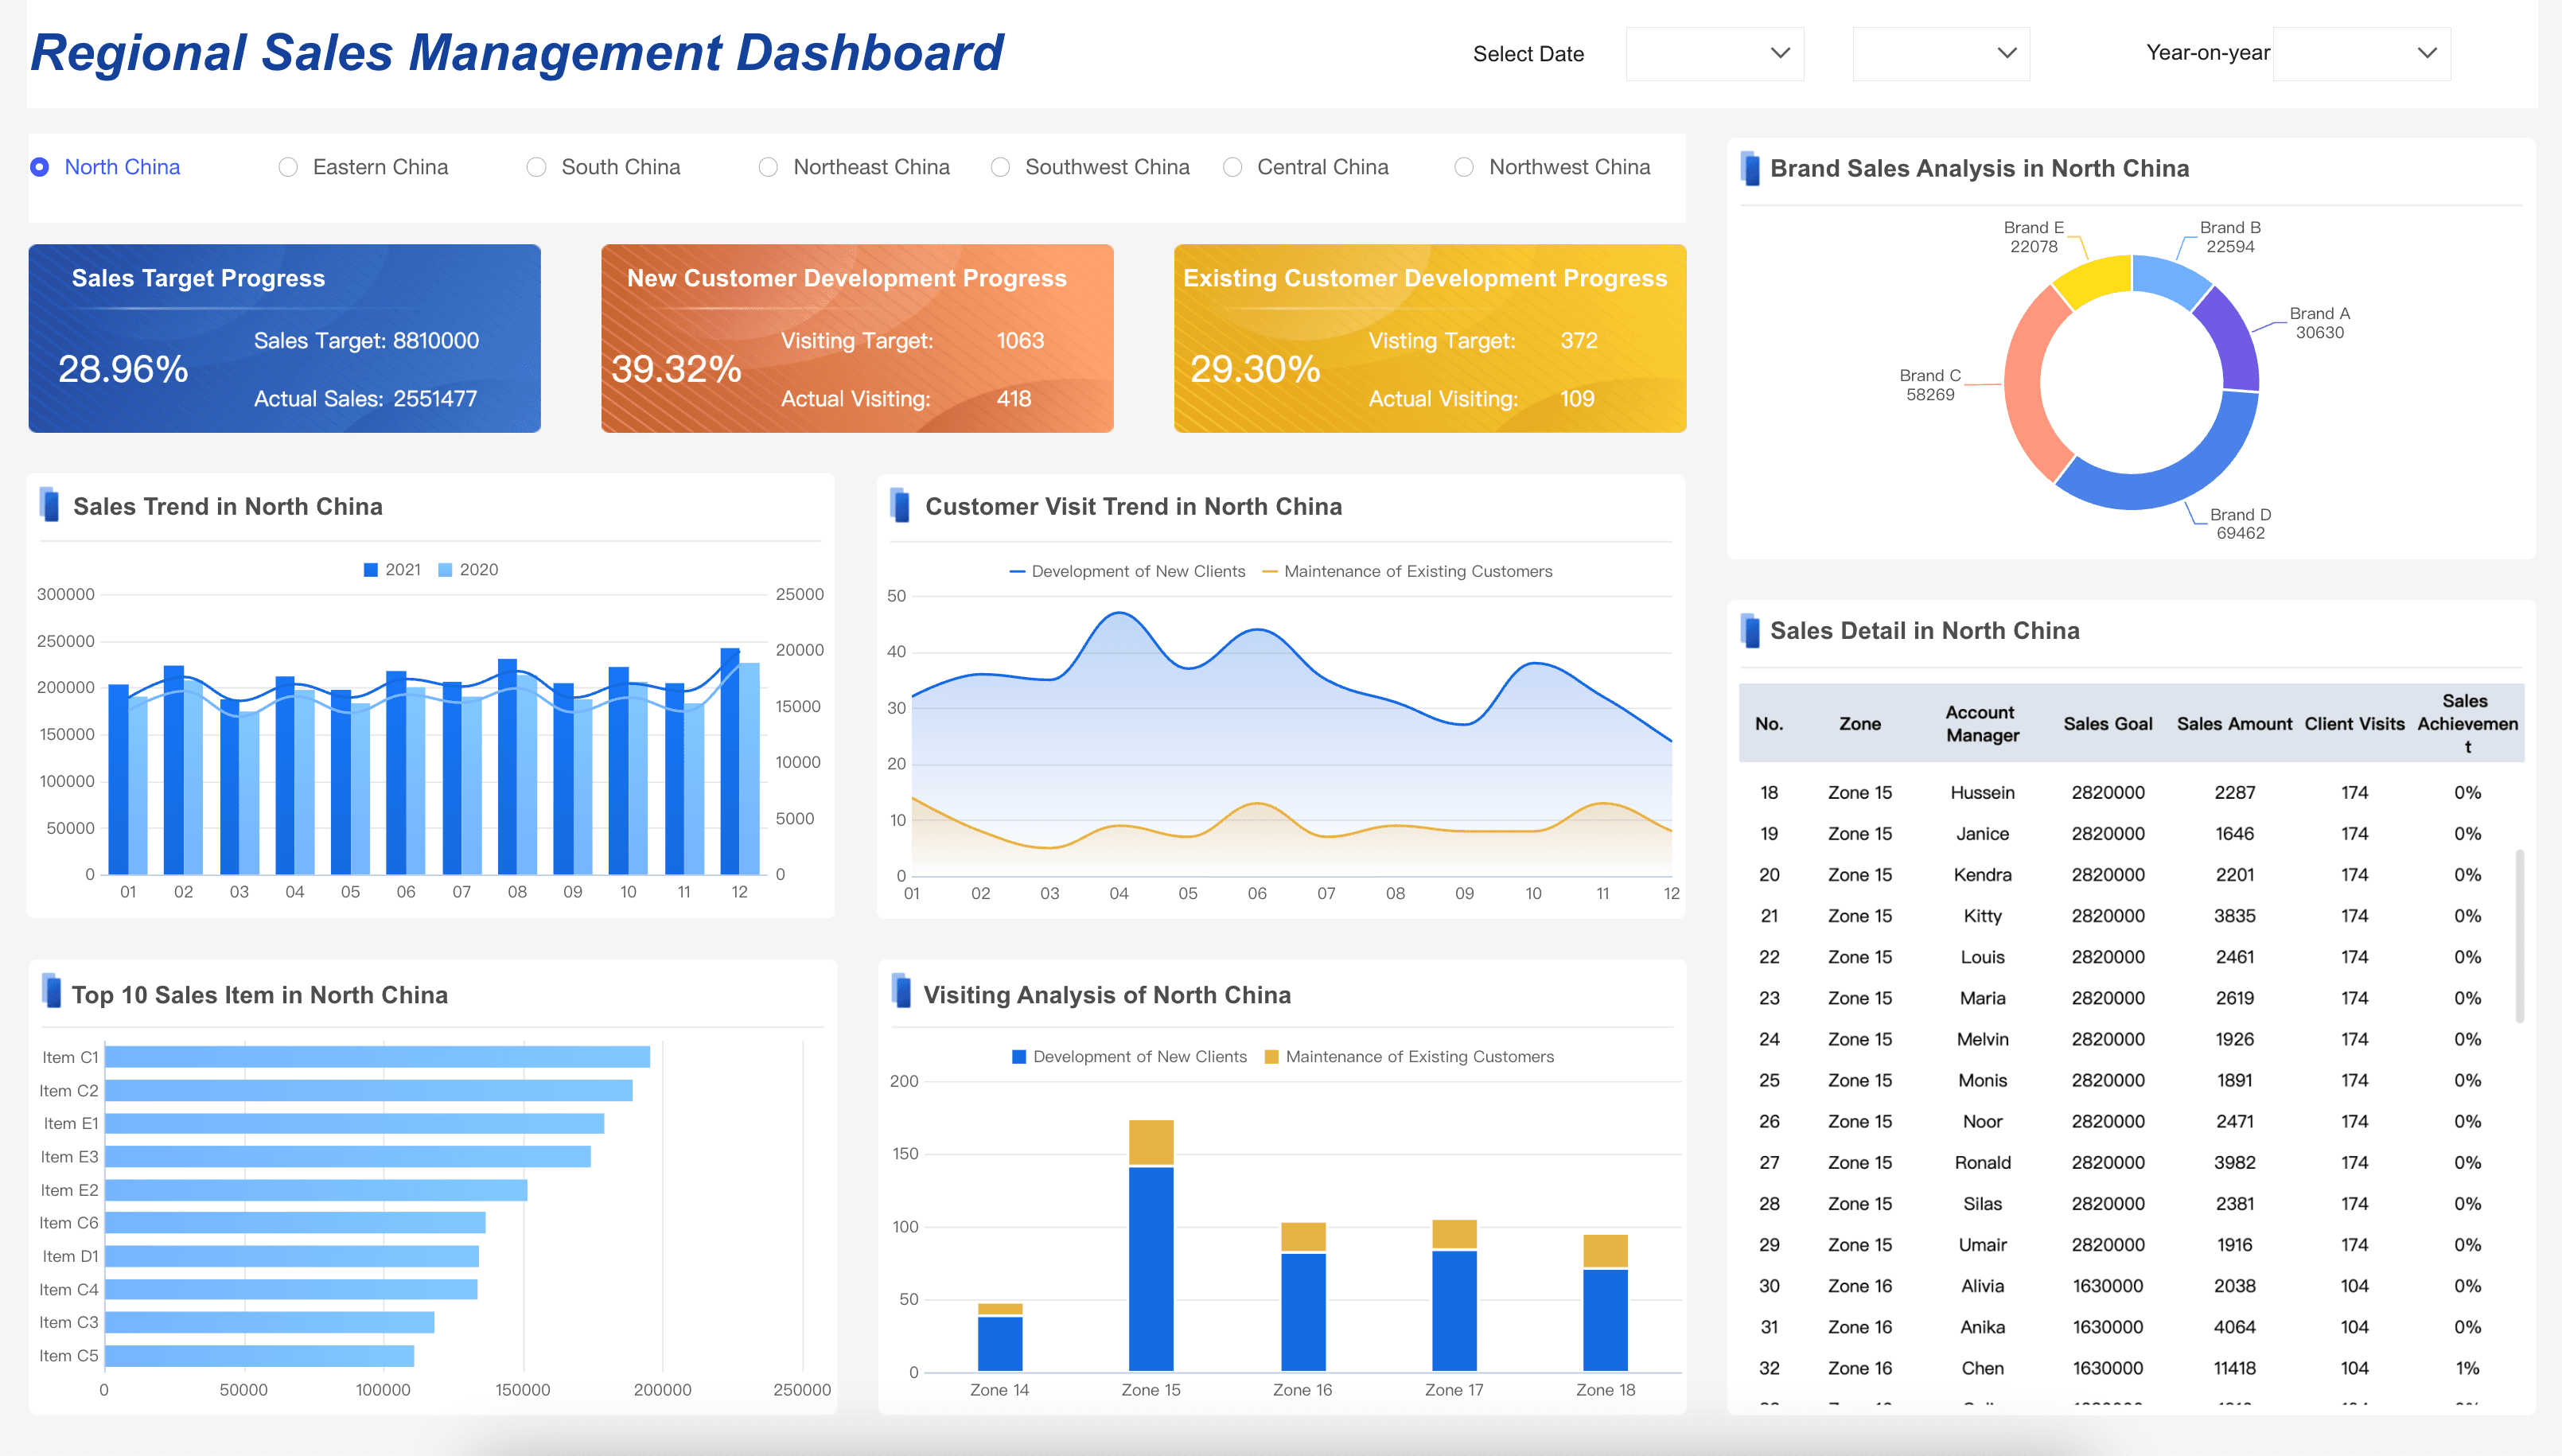
Sales Management Dashboard
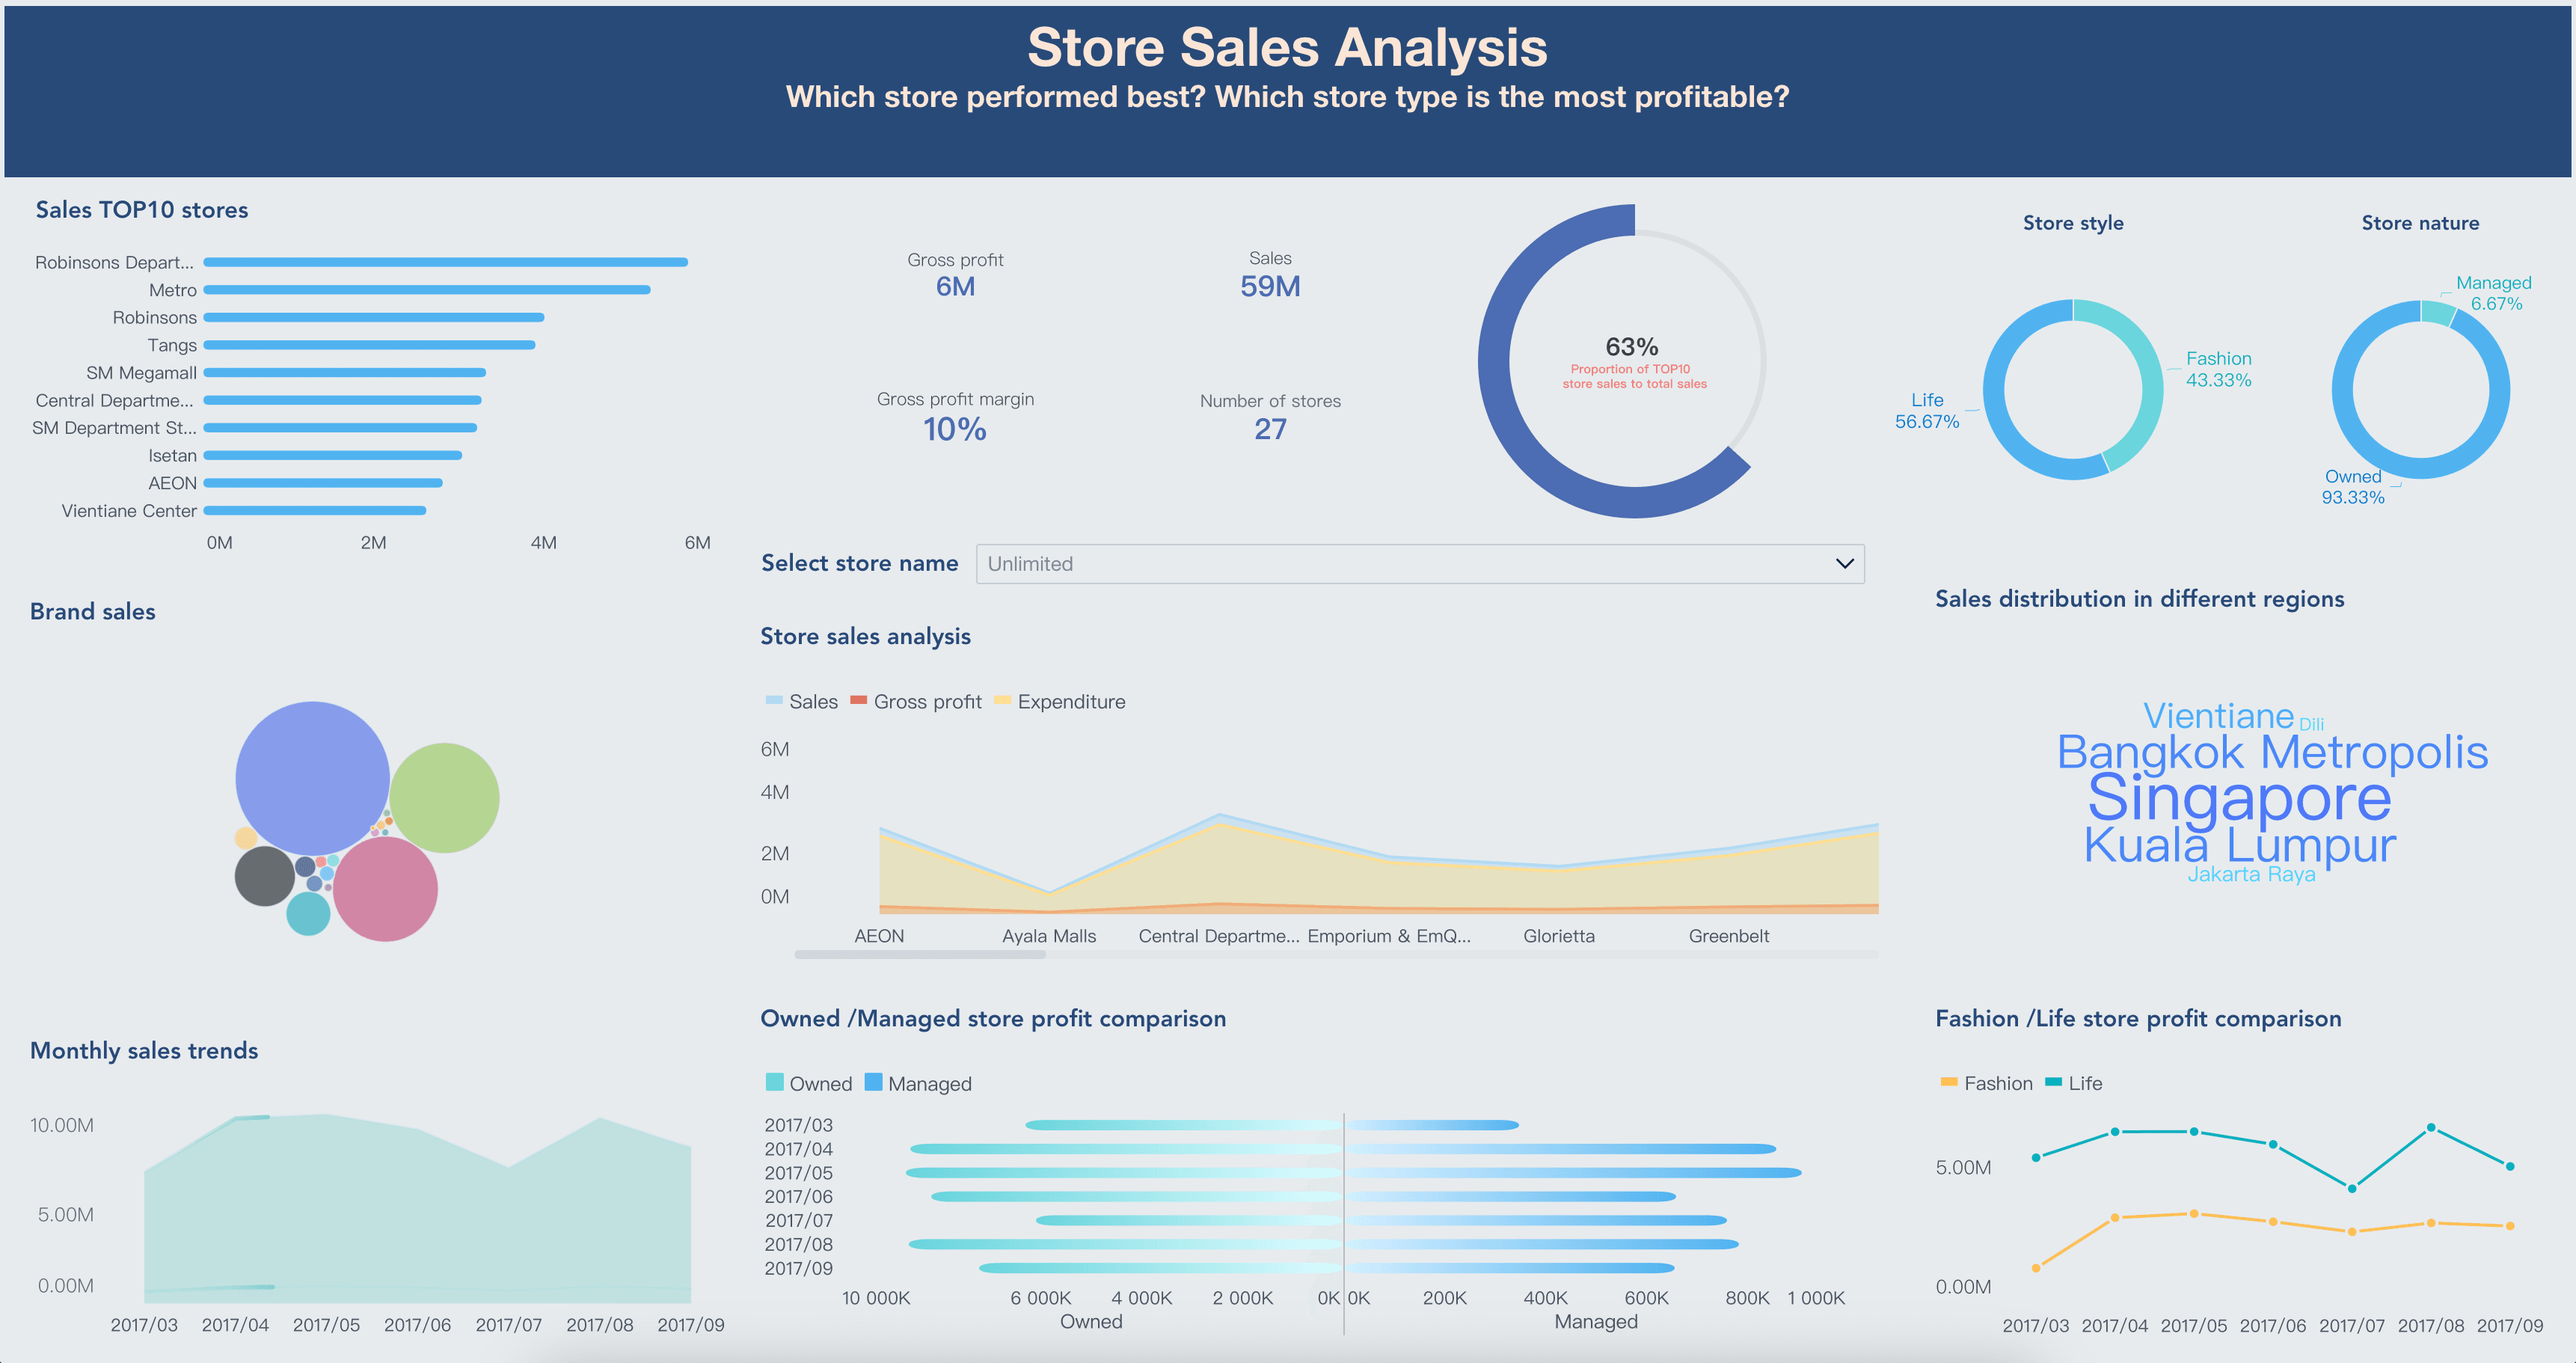
Retail Analytics Dashboard
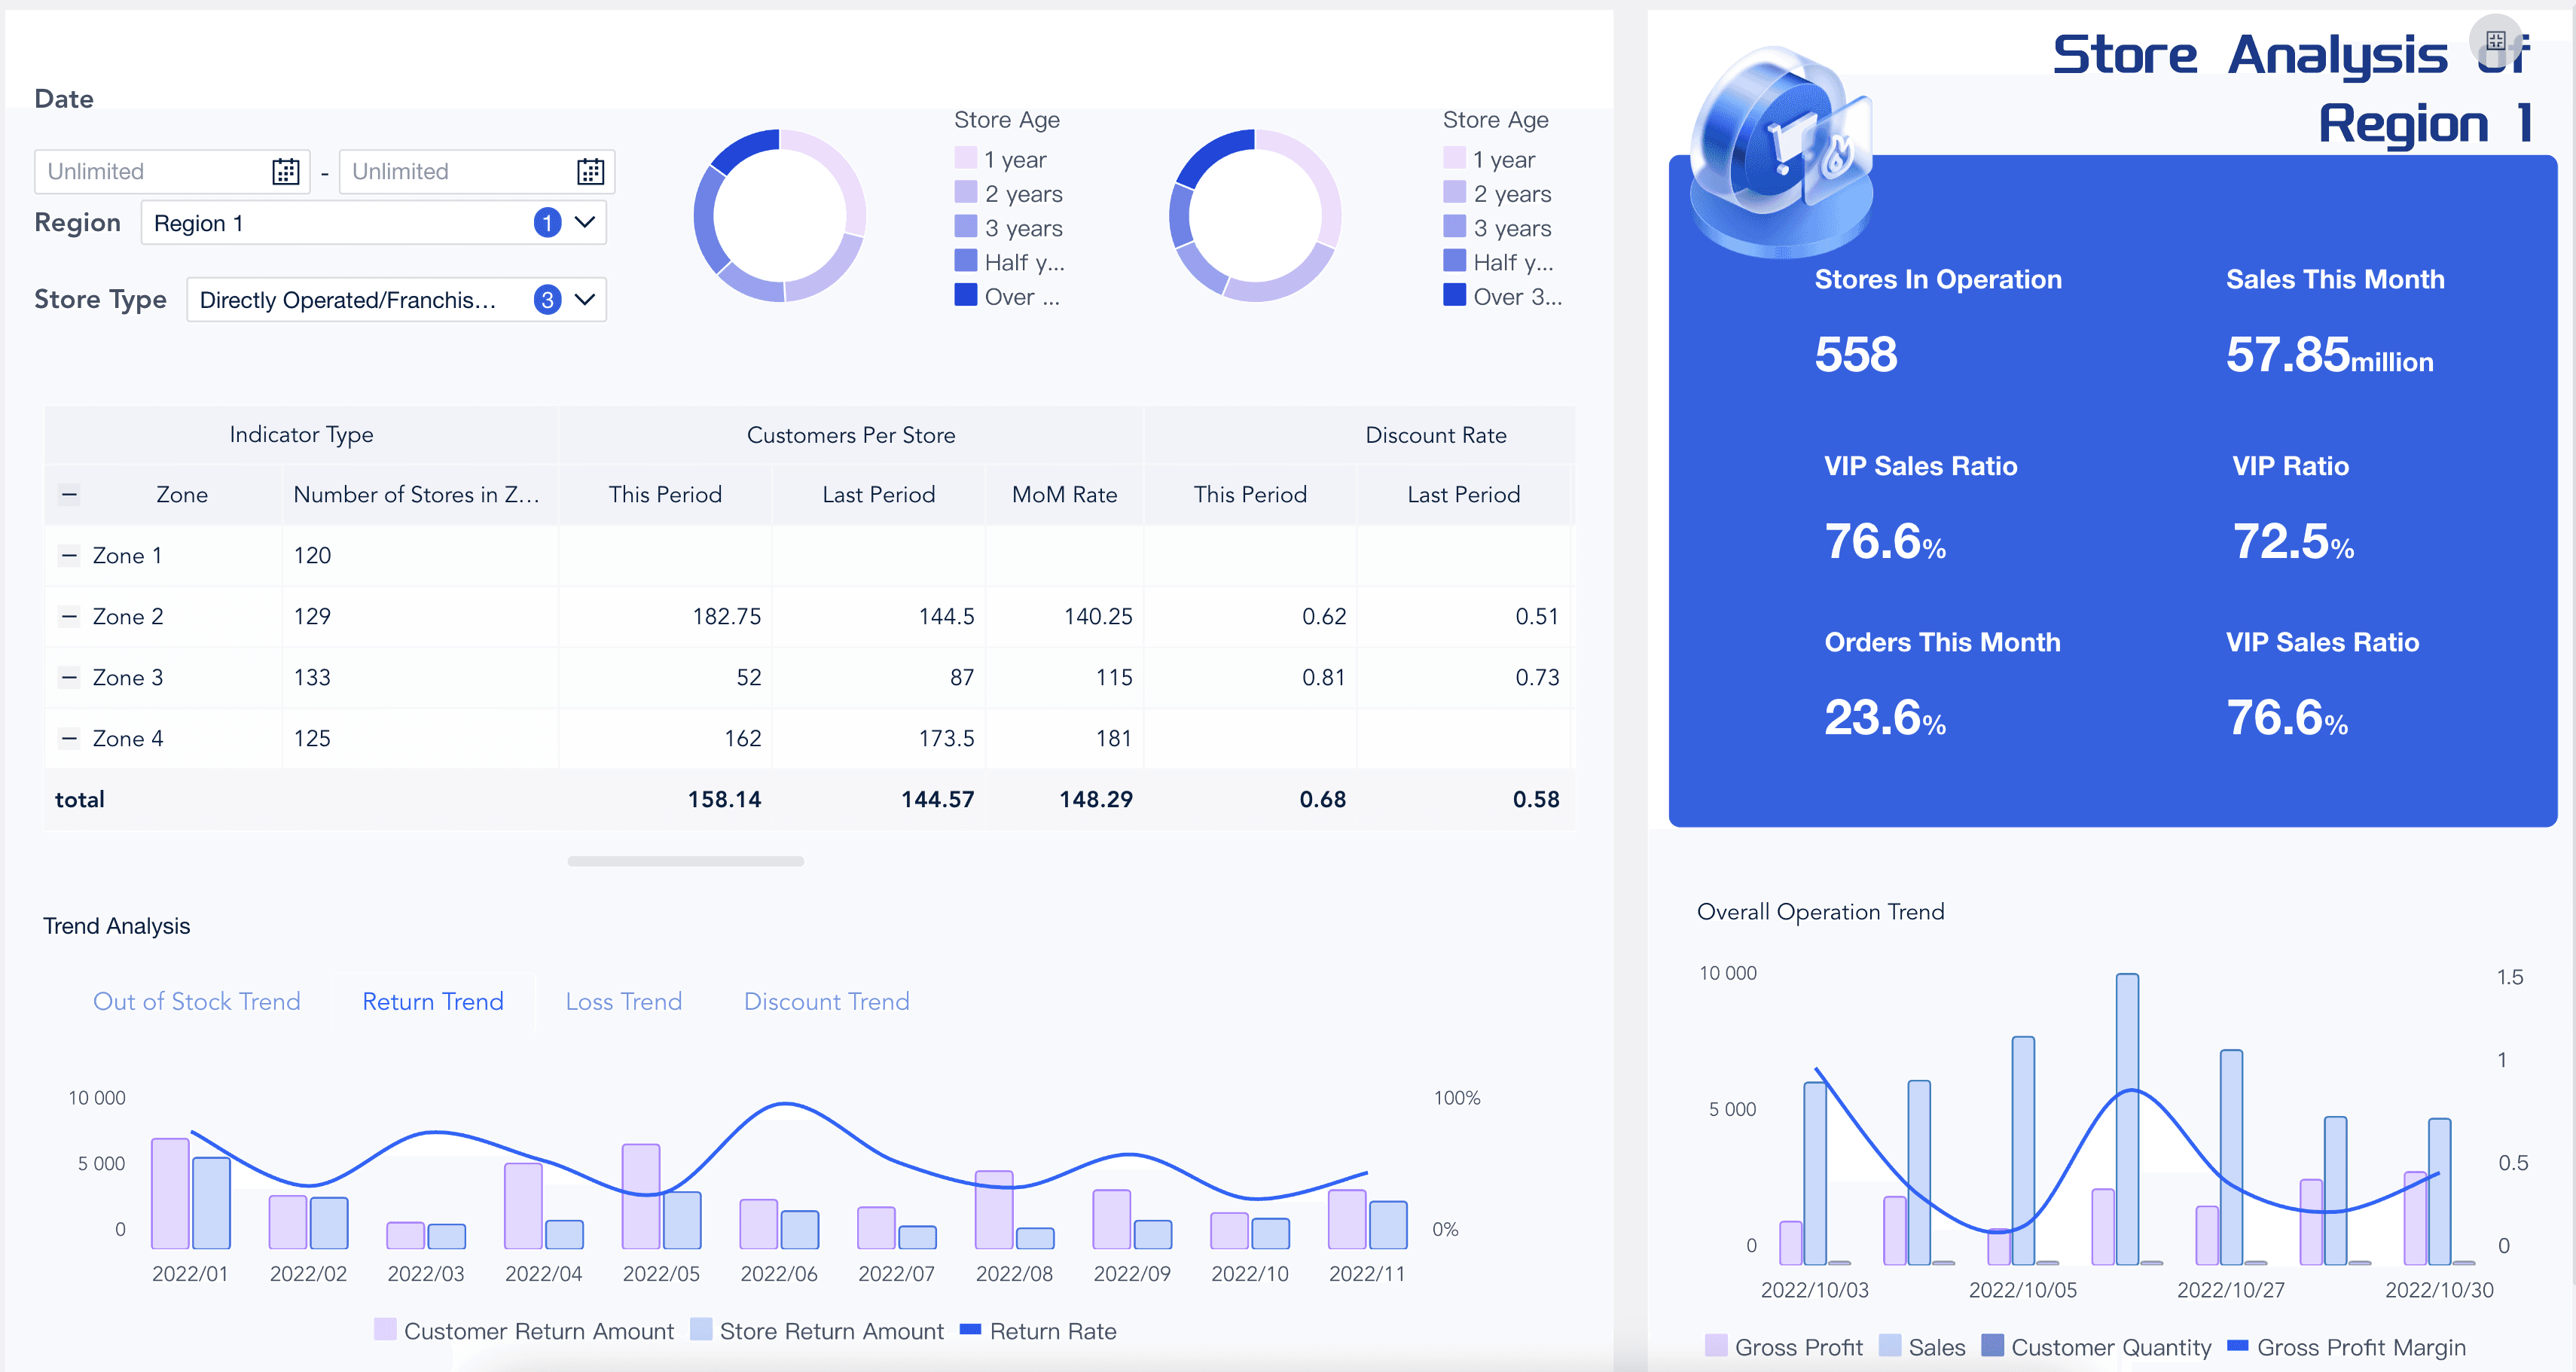
Store Performance Dashboard
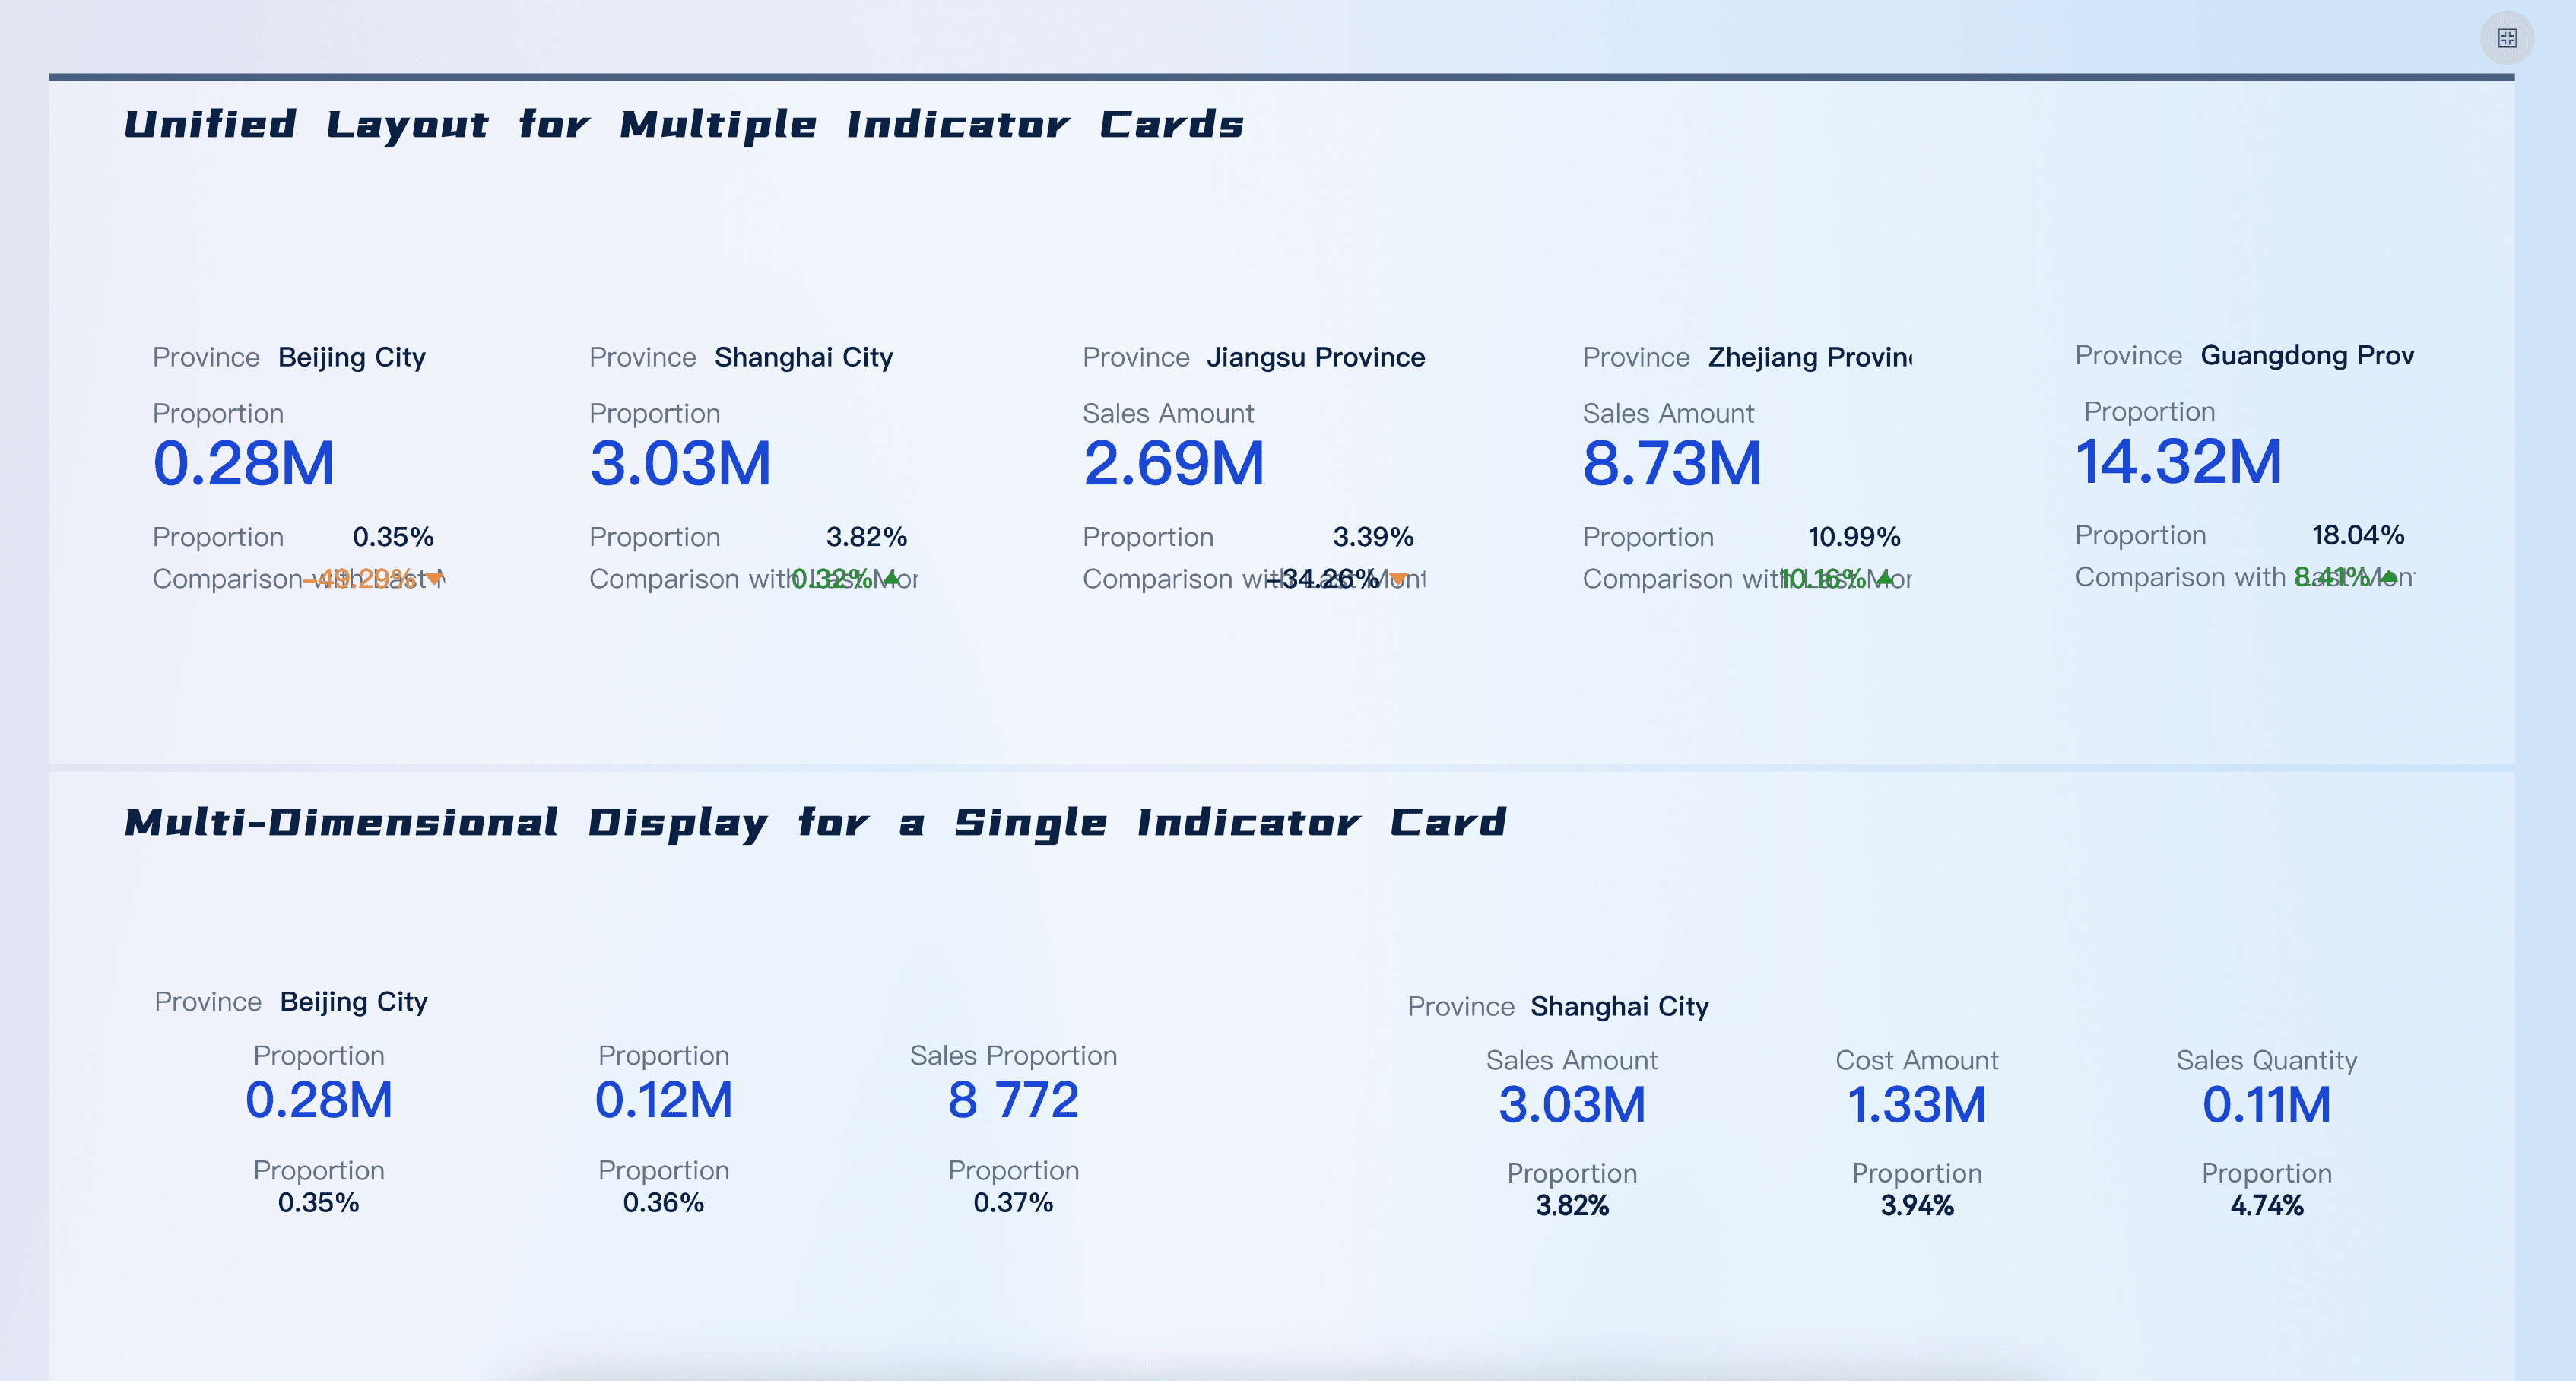
KPI Card
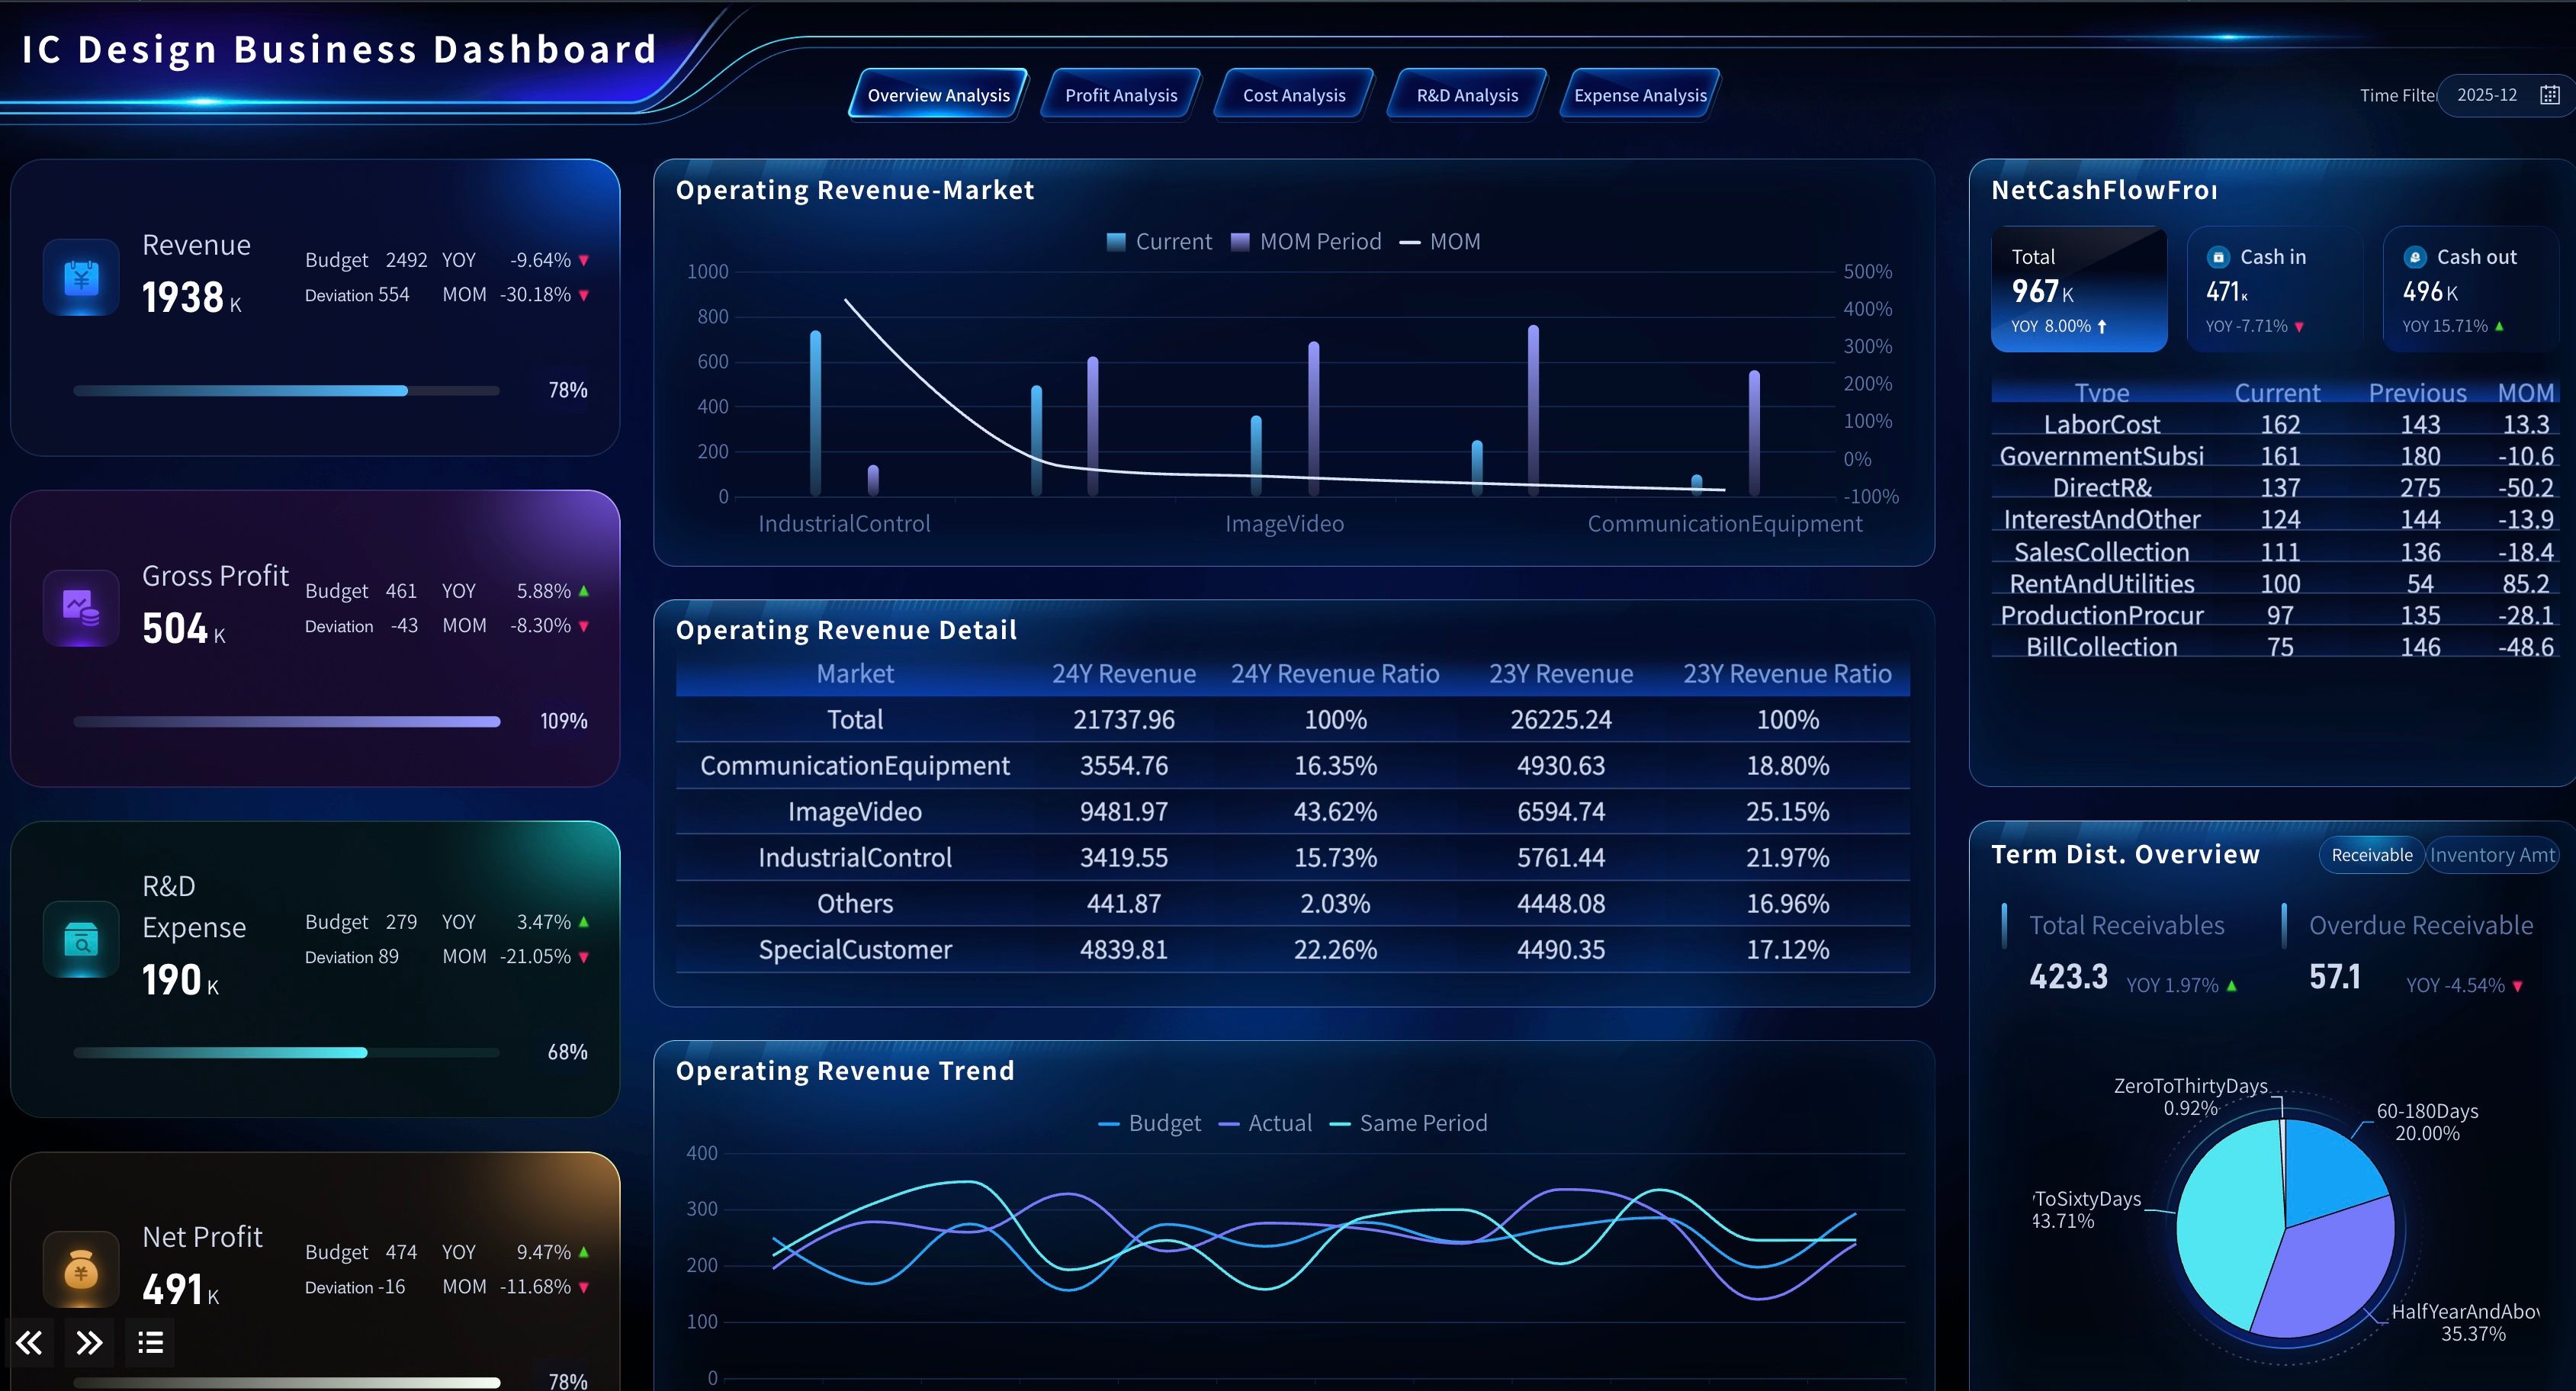
IC Design Executive Dashboard
Here is how to use the examples in a reporting plan:
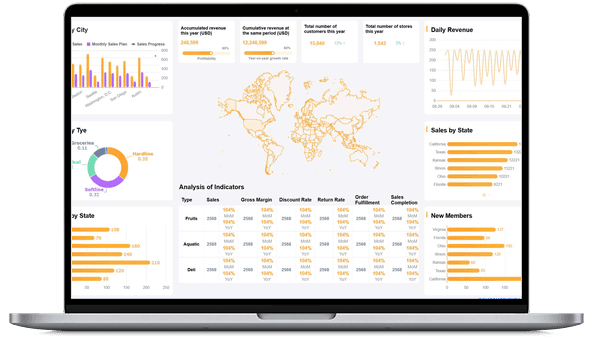
- Campaign performance: Start with the Marketing Analytics Platform demo when the report needs to compare campaign spend, channel contribution, attribution, and conversion.
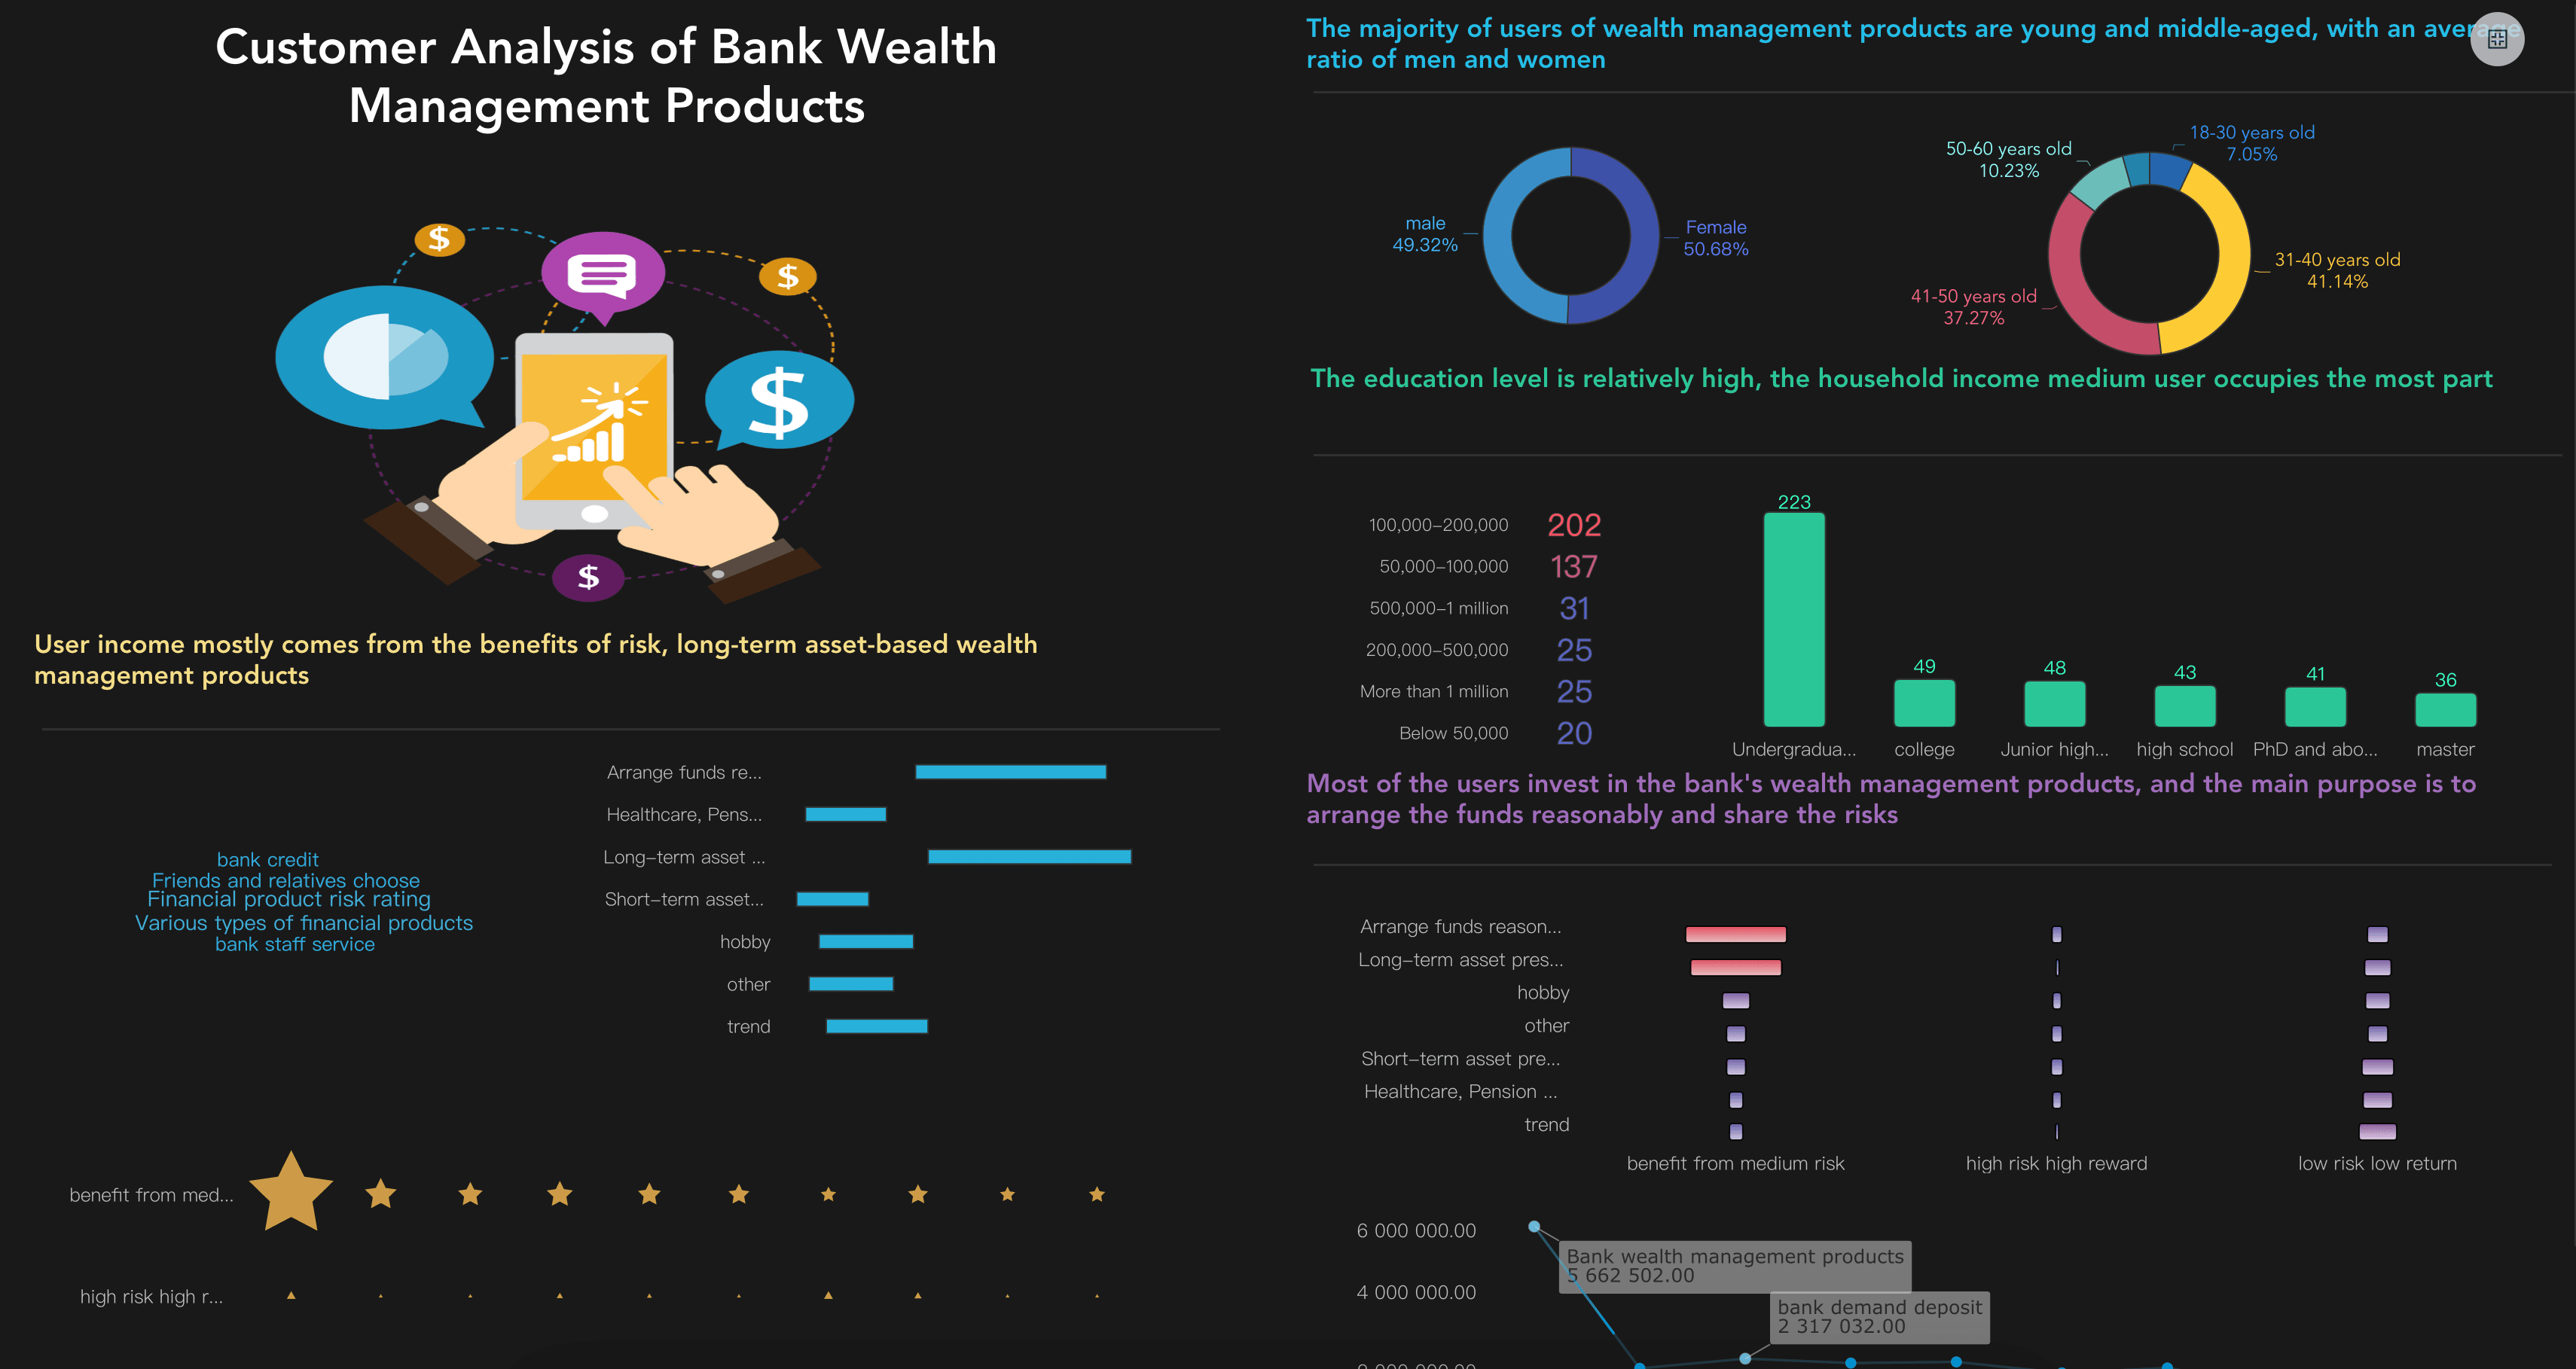
- Customer behavior: Use the Consumer Data Center Solution or Customer Analytics Dashboard when the report needs to explain audience segments, customer value, retention, or purchase behavior.
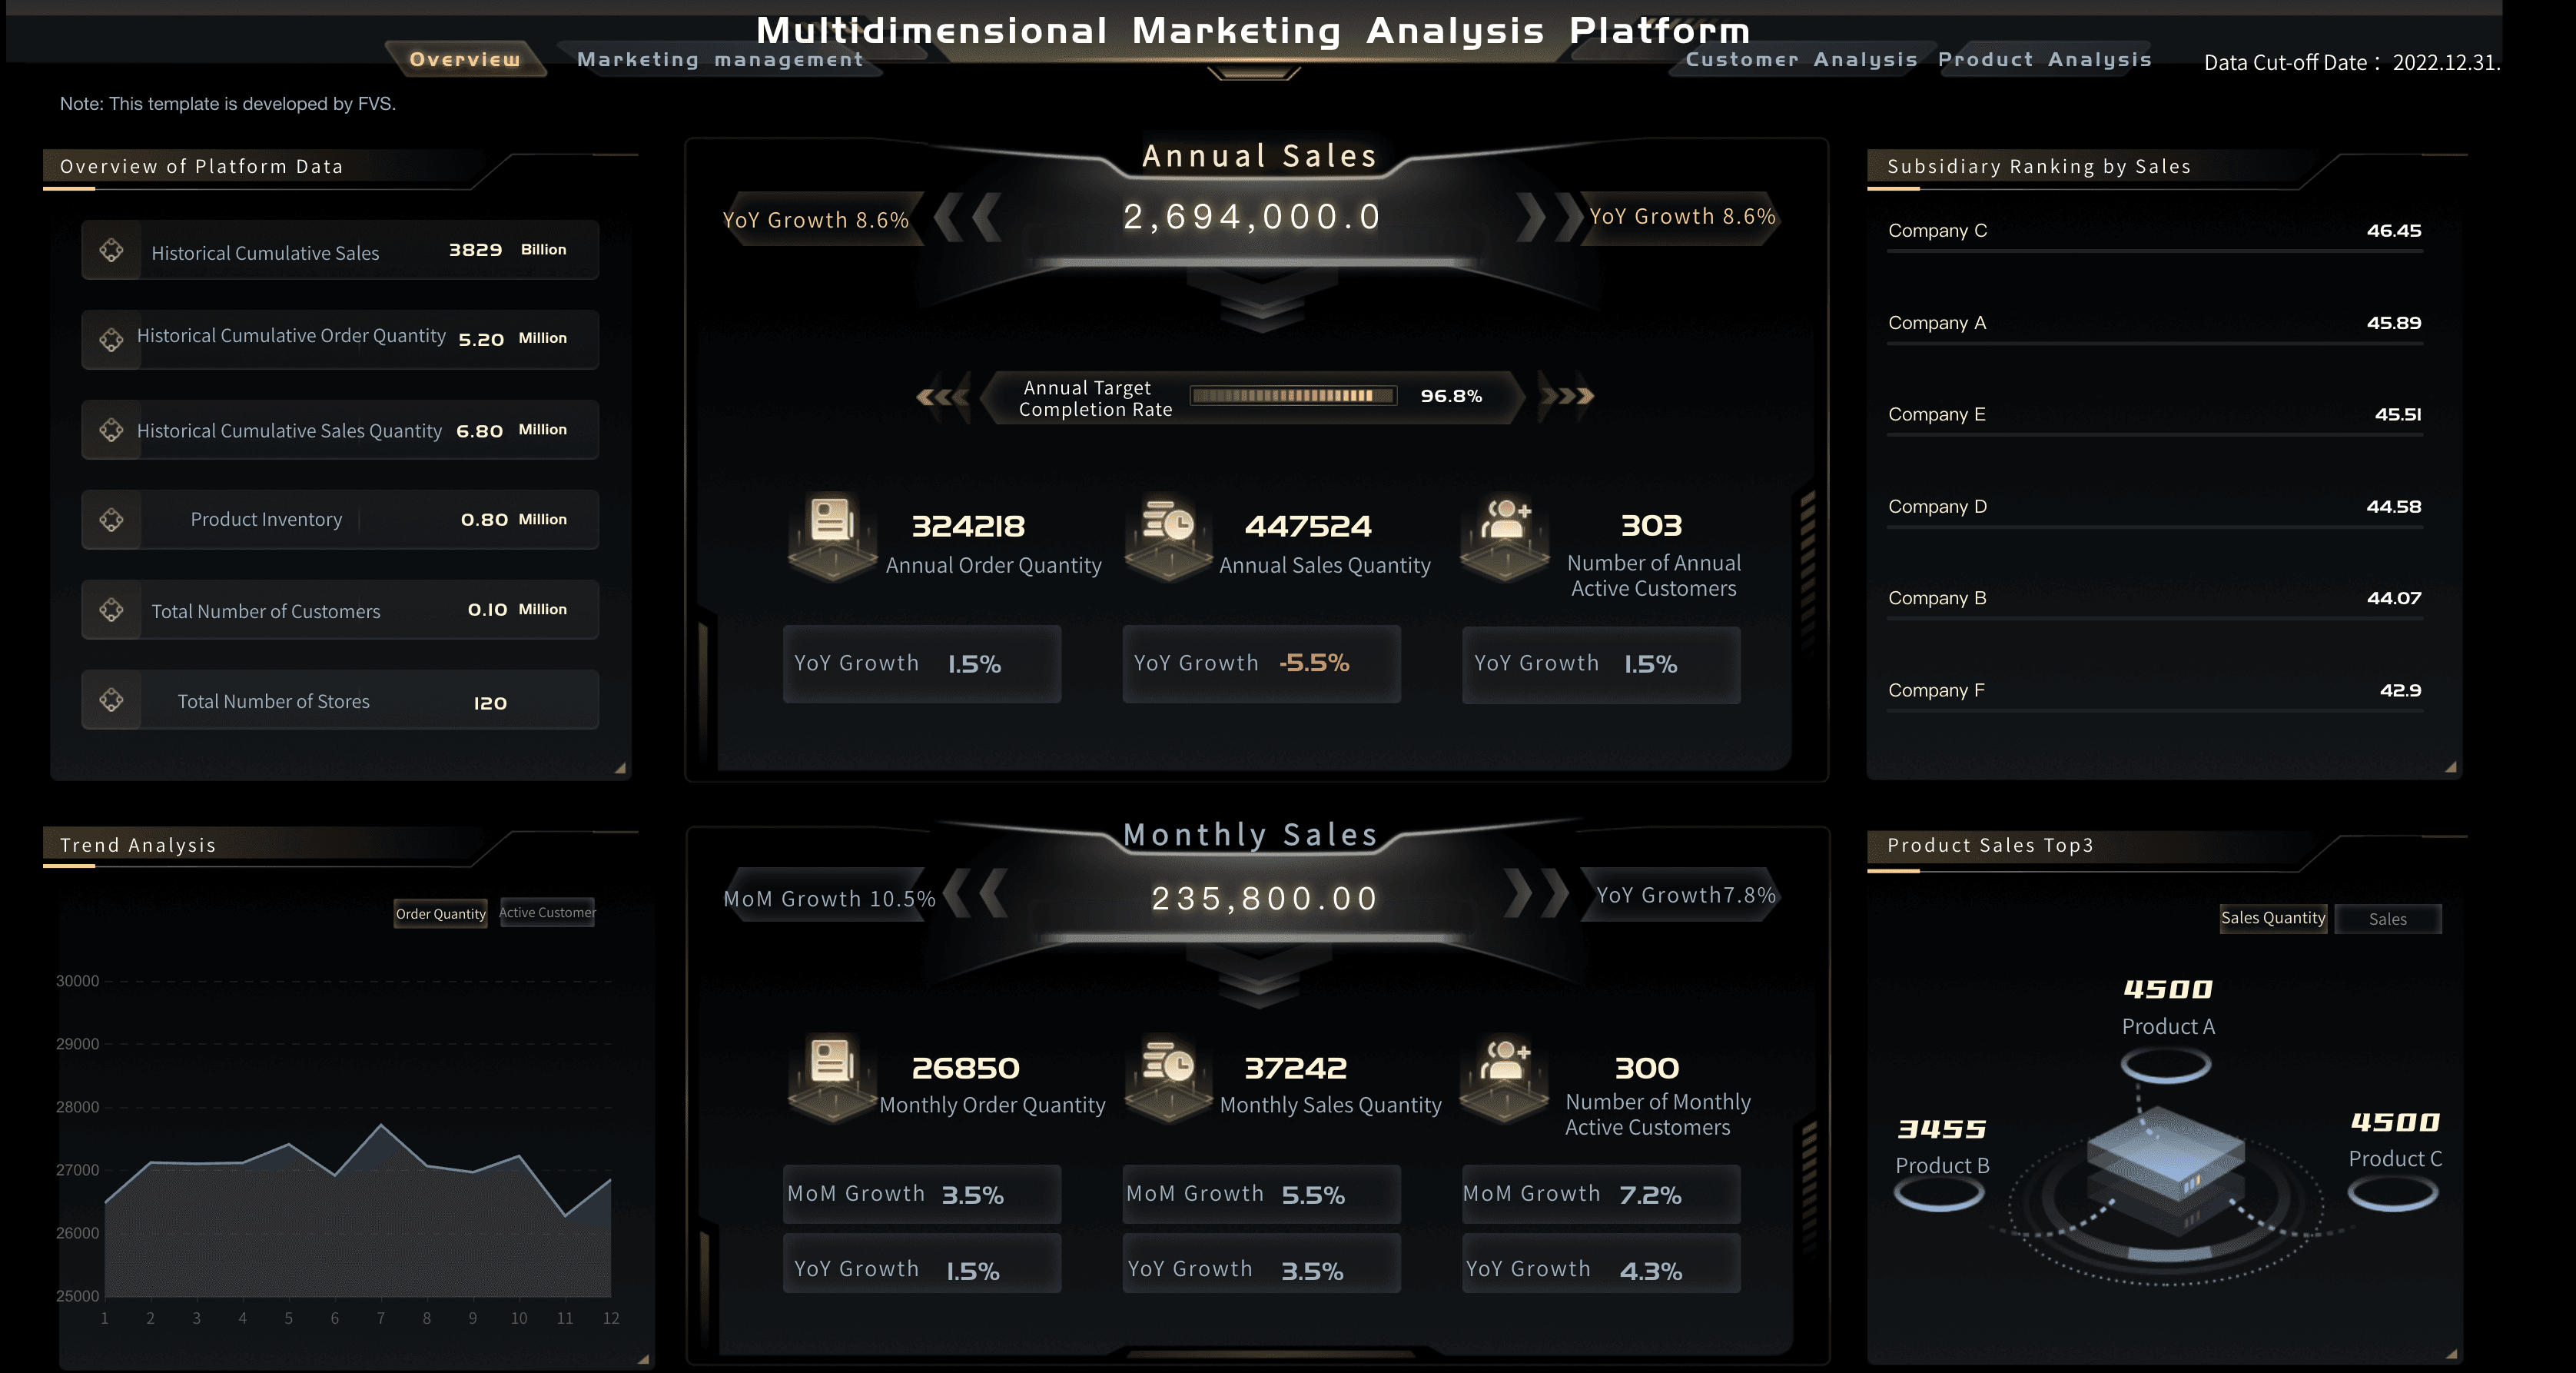
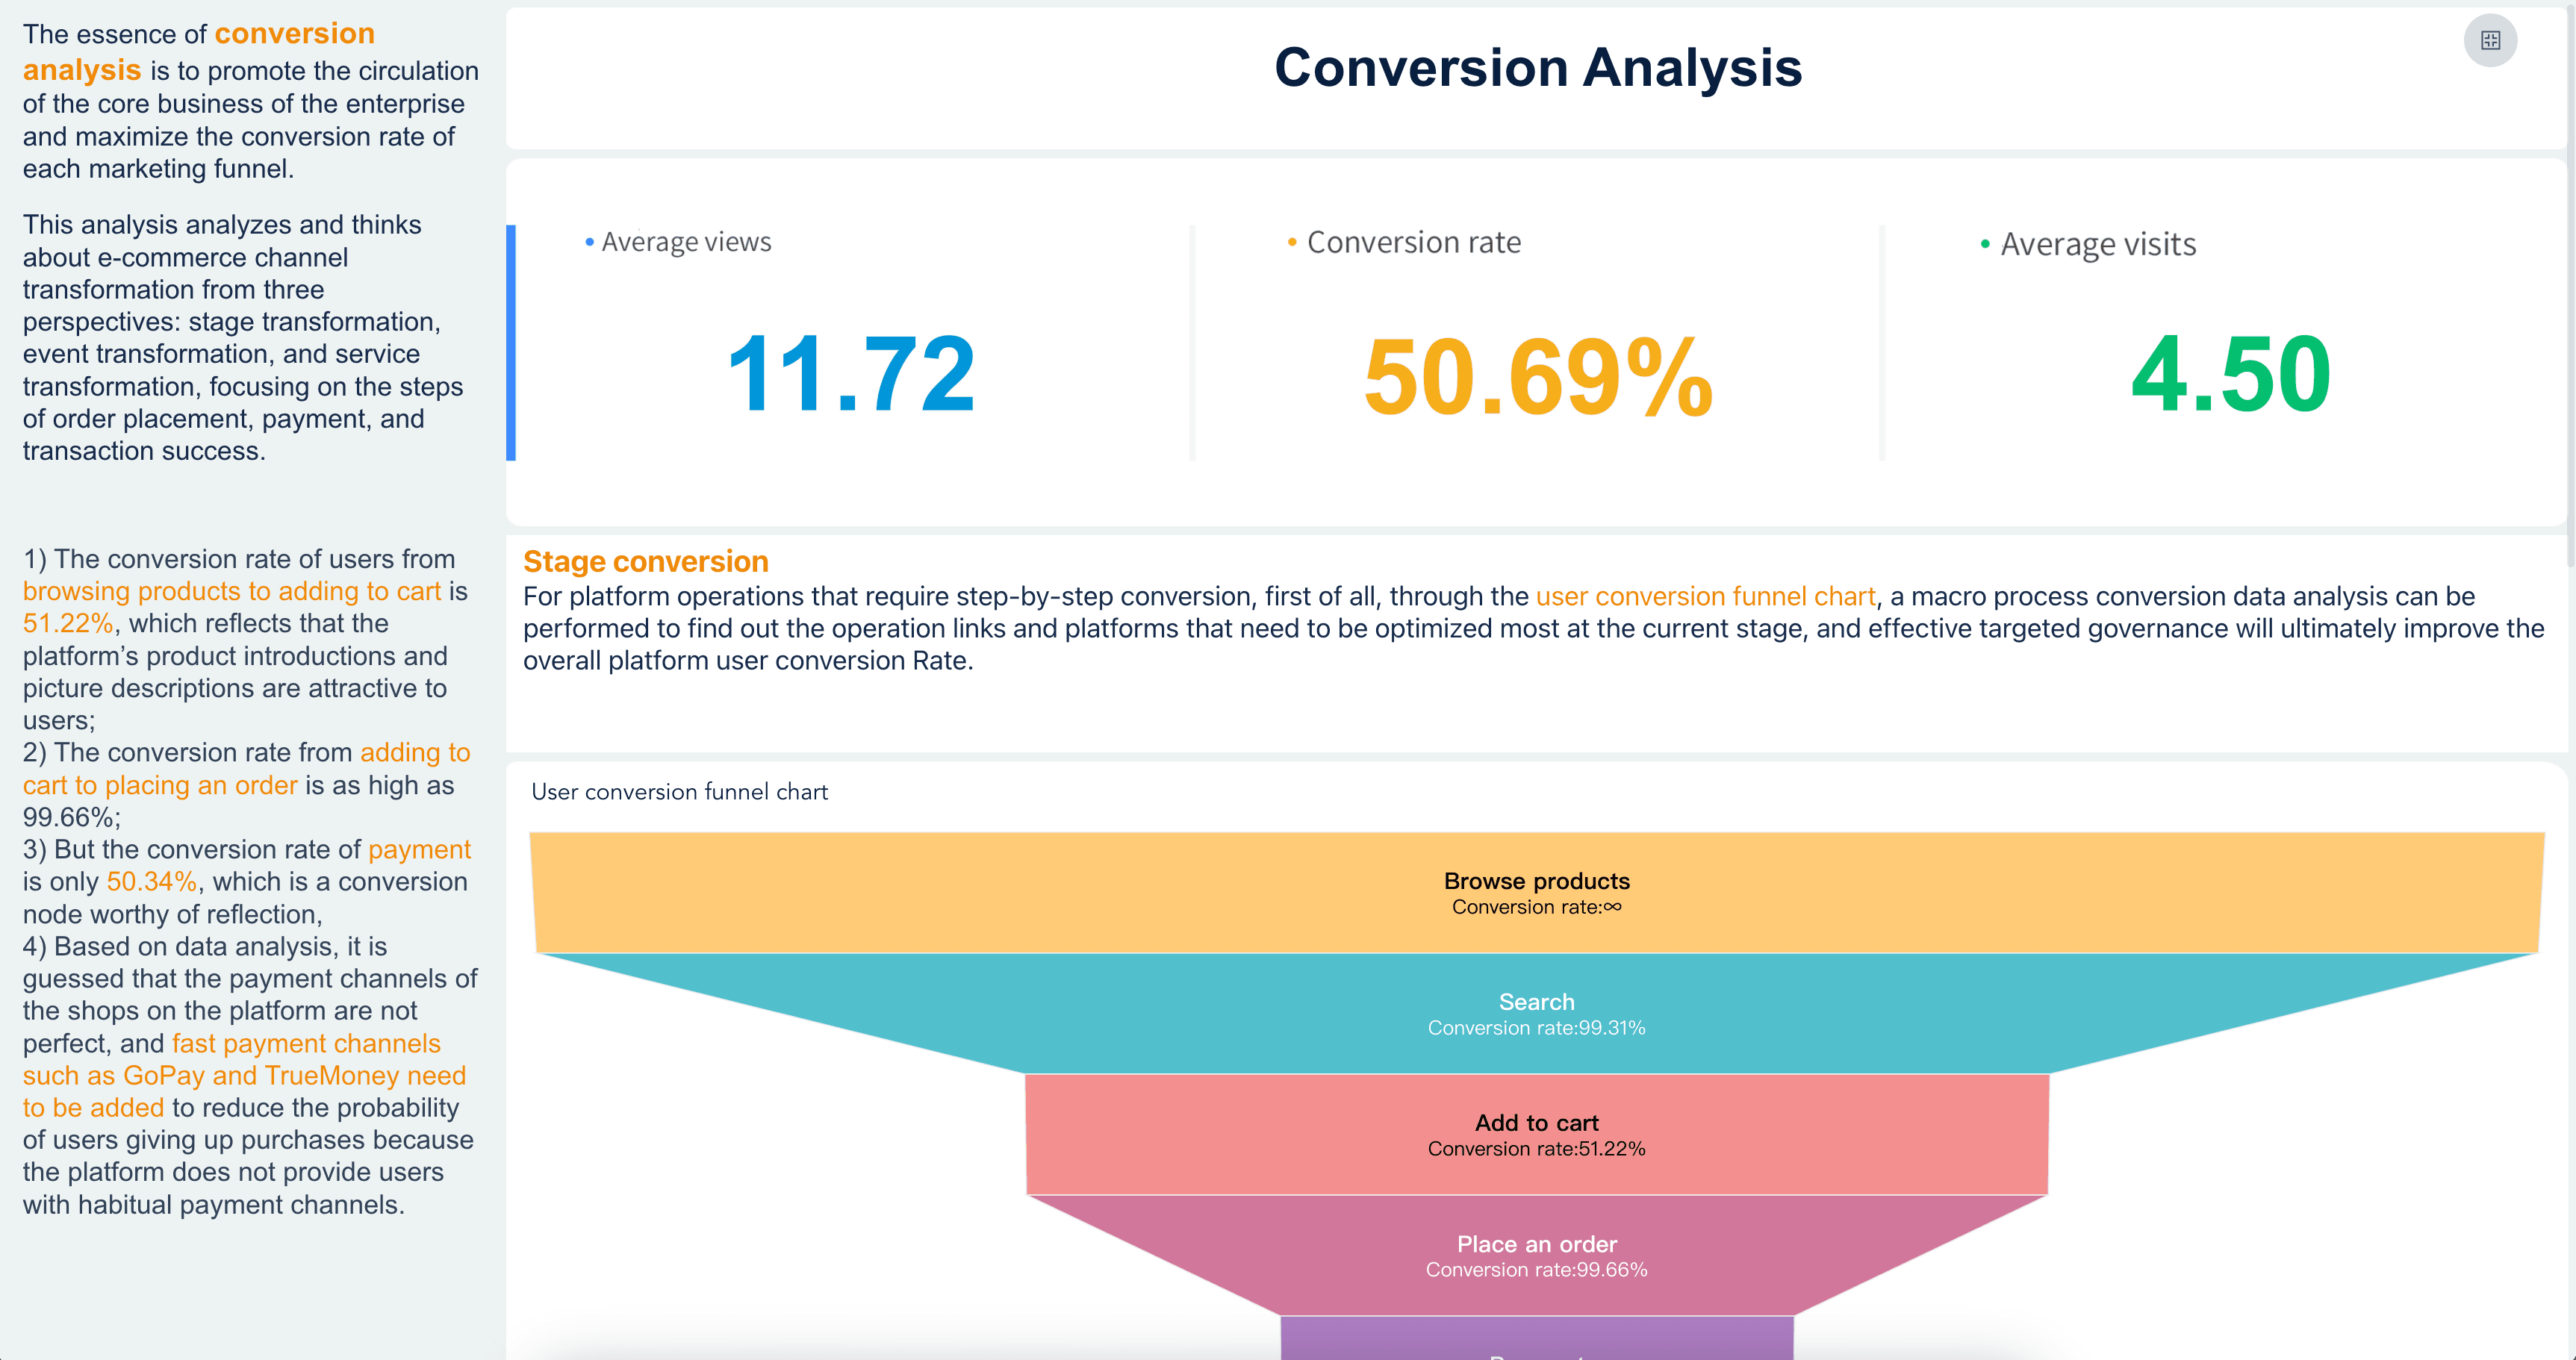
- Conversion funnel: Use the Conversion Analysis demo when the report needs to diagnose landing page, signup, checkout, or lead conversion movement.
- Revenue alignment: Use the Sales Management Dashboard when the report needs to connect marketing-sourced demand with regional sales performance or pipeline.
- Retail and ecommerce: Use the Retail Analytics Dashboard and Store Performance Dashboard when the report needs to show category, store, region, or product response to marketing activity.
- Executive summary: Use KPI Card patterns when the report needs a clean first-screen summary before the detailed analysis.
For more long-form inspiration, review a marketing report example, a weekly marketing report sample, and examples of marketing report before choosing the final structure.
Marketing Report Workflow
A marketing report becomes easier to maintain when the workflow is repeatable. The goal is not to create a perfect report in one cycle. The goal is to create a reporting rhythm that becomes more trusted each month.
- Define the reporting question. Start with a decision, such as "Which channels should receive more budget next month?" or "Why did qualified pipeline decline in the enterprise segment?"
- Choose the audience. Executives need the business story. Marketing managers need drivers and actions. Channel owners need operational detail.
- Map the data sources. Common sources include ad platforms, web analytics, CRM, marketing automation, ecommerce systems, customer data platforms, spreadsheets, and BI datasets.
- Standardize KPI definitions. Write formulas for leads, MQLs, SQLs, CAC, ROAS, pipeline, attribution, and conversion stages. Do not assume every system uses the same logic.
- Create the visual structure. Use a small set of charts that match the question: trend lines for movement, bar charts for comparison, funnel charts for conversion, tables for detail, and scorecards for headline KPIs.
- Add commentary. Explain what changed, why it matters, what may have caused it, and what should happen next.
- Review data quality. Note missing data, tracking changes, duplicated contacts, delayed CRM updates, and attribution limitations.
- Assign follow-up. Every meaningful recommendation should have an owner, next step, and review date.
- Retire unused sections. If a chart does not change decisions for several cycles, simplify it or move it to a drill-down dashboard.
This workflow also helps teams decide when to use reporting software, when to use ad hoc reporting, and when a governed BI reporting process is needed. Small teams may start with spreadsheets and slides. Larger teams usually need shared metric definitions, access control, scheduled refresh, and reusable report assets.
Build a Marketing Report With FineBI + Dora
After the marketing report structure is clear, FineBI + Dora can help teams move from manual reporting to a more repeatable learning workflow.
FineBI can support the BI layer of the marketing report: connecting data sources, modeling metrics, building dashboards, creating reusable visual analysis views, managing permissions, and helping business users explore trusted datasets. This matters because marketing reports depend on consistent definitions. If every report calculates leads, spend, attribution, or revenue differently, the narrative will not be trusted.
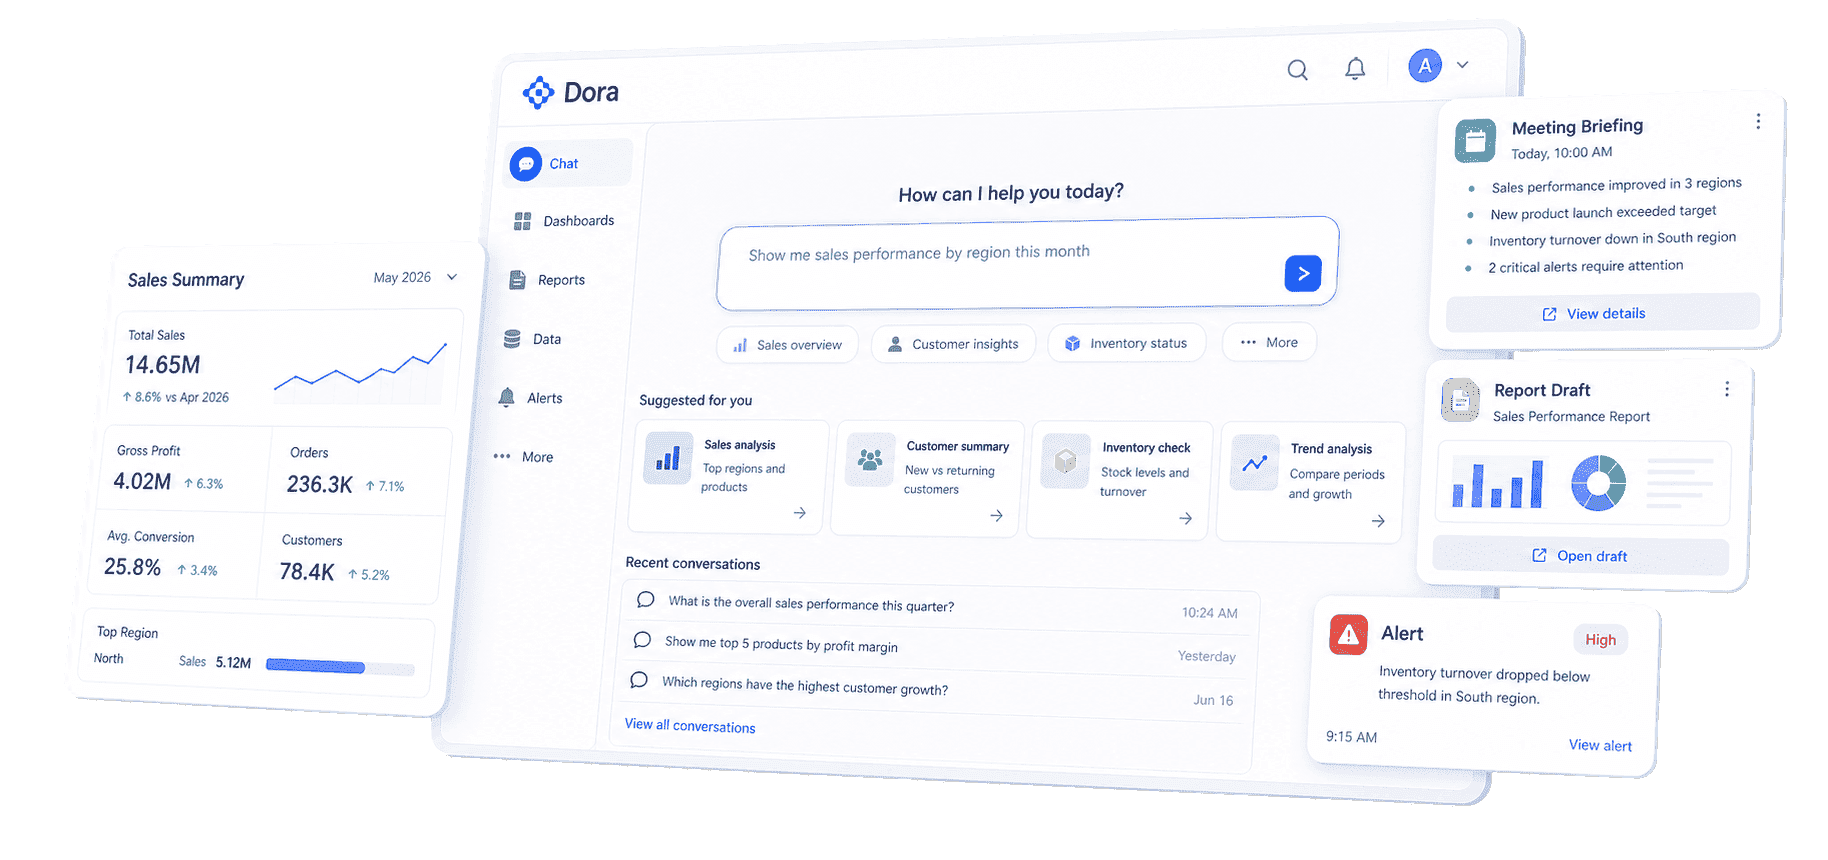
Dora adds the AI action layer above those governed BI assets. As a data agent, Dora can help users ask natural-language questions, search existing dashboards and reports, generate charts or structured briefings from configured data assets, summarize changes, push scheduled updates, and follow up with responsible owners. Dora should not replace the marketing team or make decisions alone. It works best when it operates on trusted metrics, business terms, permissions, Skills, and human review.
For a marketing report scenario, two useful Dora digital employees could be:
- Marketing Performance Analyst: Answers follow-up questions about traffic, spend, conversion, lead quality, and campaign variance using governed BI assets.
- Weekly Briefing Secretary: Generates scheduled marketing summaries, flags abnormal changes, and pushes report notes to the right owner for review.
Example chat-style prompts:
- "Generate a monthly marketing report for paid search, paid social, SEO, and email. Show spend, leads, MQLs, pipeline, CAC, and the top three changes from last month."
- "Explain why enterprise MQL volume dropped this week. Compare traffic source, landing page conversion, campaign spend, and CRM rejection reasons."
- "Create a dashboard-style view of campaign ROI by channel, region, and product line, then list which campaigns need budget review."
- "Summarize this week's marketing risks and assign follow-up questions for paid media, SEO, and sales operations."
A closed-loop AI workflow could look like this:
- Retrieve trusted data: Dora reads configured FineBI assets, KPI definitions, campaign fields, channel mappings, and permission rules.
- Detect meaningful movement: It compares current results with targets, last period, and known campaign changes.
- Explain likely drivers: It highlights where variance appears, such as spend changes, conversion drops, lead quality issues, or CRM stage movement.
- Generate the report draft: It creates a structured briefing with charts, metric summaries, commentary, and data quality notes.
- Push to owners: It sends the relevant sections to campaign owners, sales operations, or leadership channels for review.
- Follow up and summarize: It tracks open questions, captures human feedback, and prepares a clearer summary for the next review.
This is the practical value of enterprise AI agents in marketing reporting. The value is not a generic chatbot that improvises from disconnected tables. The value is a governed workflow where natural-language questions map to trusted BI assets, semantic rules, reusable Skills, and permission-aware outputs.
For IT teams, this shifts work from manually building every recurring report to maintaining data connections, metric definitions, semantic layers, access rules, and reusable workflows. For business users, it reduces the wait between a question and a useful first analysis. For executives, it makes the marketing report easier to connect to action: what changed, why it matters, who owns the next step, and what will be reviewed next.
If your team is exploring AI-assisted analytics beyond marketing reporting, related learning paths include AI assistant for business and AI agent workflow.
Marketing Report Hub
This marketing report guide should work as one spoke in a broader report content hub. A marketing report explains demand generation, campaign performance, channel efficiency, and customer acquisition. Other report pages explain adjacent business functions and reporting needs.
Use these related resources to build a complete report learning path:
FAQs
A marketing report should include an executive summary, goals and targets, core KPIs, channel performance, funnel movement, campaign analysis, audience or segment insights, data quality notes, recommendations, and follow-up owners. The exact structure should match the audience and decision. Executives need business impact. Channel owners need diagnostic detail.
Most teams use a monthly marketing report for business review, weekly reports for campaign monitoring, and quarterly reports for strategy and budget planning. The right cadence depends on the decision cycle. Fast-moving paid media may need weekly reporting, while executive budget review may only need monthly or quarterly reporting.
A marketing dashboard is an interactive monitoring view that helps teams track current metrics and explore data. A marketing report is a structured explanation of performance over a period or campaign. Dashboards help teams watch what is happening. Reports help teams understand why it happened and decide what to do next.
The most important metrics are the ones tied to the decision. Common high-value metrics include qualified leads, conversion rate, pipeline, revenue, customer acquisition cost, return on ad spend, channel ROI, lead quality, retention, and customer lifetime value. Avoid filling the report with activity metrics unless they explain an outcome.
FineBI can help teams connect data, model trusted KPIs, build dashboards, and manage permissions. Dora can act as the AI Data Agent layer that answers follow-up questions, generates scheduled summaries, drafts report commentary, flags anomalies, and pushes follow-up tasks based on governed BI assets. Human review should remain part of the reporting workflow.
