
What is Marketing Analytics?
Marketing Analytics vs. Marketing Reporting
Marketing analytics and marketing reporting are closely related, but they are not the same job.
Marketing reporting usually has a fixed audience, cadence, and structure. A weekly campaign report may summarize spend, traffic, leads, conversion rate, pipeline, and next actions. A monthly executive report may explain goal progress, budget movement, channel mix, risks, and recommendations.
Marketing analytics is broader. It includes the exploration and reasoning behind the report. It asks why a paid search campaign became more expensive, whether a content cluster brought qualified visitors, which customer segment has higher lifetime value, and whether a decline came from traffic volume, conversion rate, lead quality, sales follow-up, or attribution rules.
The two should work together. Use reporting to create a shared performance story. Use analytics to test that story, find the drivers, and make the next report more useful. For example, marketing reporting tools can help standardize the monthly review, while analytics helps the team investigate whether a change came from audience quality, channel mix, conversion friction, or sales handoff.
Why Marketing Analytics Matters
Marketing teams do not lack data. They often lack shared definitions, connected systems, and a clear path from metric change to business action.
Without marketing analytics, each team may bring a different export to the same meeting. Paid media may focus on cost per click. SEO may focus on organic traffic. Content may focus on engagement. Sales may care about opportunity quality. Finance may ask whether spend created enough pipeline or revenue. Marketing analytics gives these teams a common way to connect activity, outcomes, and decisions.
Strong marketing analytics helps teams:
- Connect campaigns to outcomes: Link spend, impressions, clicks, content, events, email, and social activity to qualified demand, pipeline, revenue, retention, or customer value.
- Improve budget decisions: Compare channels by cost, conversion, quality, and revenue contribution instead of judging performance from surface-level activity metrics.
- Diagnose funnel problems: See whether performance changed because of traffic volume, landing page conversion, lead quality, sales acceptance, opportunity movement, or win rate.
- Understand customer behavior: Use customer behavior analysis to learn which audiences, segments, or journeys produce meaningful engagement.
- Support customer growth: Connect acquisition data with retention, expansion, repeat purchase, and customer loyalty analytics.
- Reduce manual reporting work: Replace repeated spreadsheet consolidation with governed data connections, reusable views, and scheduled reports.
- Build institutional learning: Preserve campaign context, tests, assumptions, decisions, and follow-up notes so teams do not repeat the same analysis from scratch.
The practical value is not "more marketing data." The value is fewer unresolved questions in growth meetings: what changed, why it matters, who owns the next step, and what will be reviewed next.
Don't just collect marketing data. Visualize what matters.
Download the KPI Dashboard Guide to strengthen your marketing analytics foundation:
- How to turn marketing goals into measurable KPI dashboard views
- 10 essential steps to build effective KPI dashboards
- How to choose the right charts and avoid visual clutter
- 15 top-notch dashboard templates for 2026

Types of Marketing Analytics
Marketing analytics is often described in four levels. Most teams need all four, but they do not need to build every level at once. Start with the recurring marketing decision that matters most, then add deeper analysis as the data foundation becomes trusted.
Descriptive marketing analytics
Descriptive analytics explains what happened. It is the foundation for campaign dashboards, channel reports, funnel summaries, and executive reviews.
Common examples include:
- Traffic, sessions, users, page views, landing page performance, and source mix
- Impressions, reach, clicks, cost, CTR, CPC, CPM, and spend by campaign
- Leads, MQLs, SQLs, demo requests, trial signups, and event registrations
- Conversion rate by channel, offer, landing page, device, region, or audience
- Pipeline, marketing-sourced revenue, influenced revenue, win rate, and average deal size
- Email open rate, click rate, unsubscribe rate, deliverability, and revenue contribution
- Social engagement, follower growth, referral traffic, and content performance
- Ecommerce orders, average order value, repeat purchase, cart abandonment, and revenue
Descriptive analytics is useful when the question is, "What changed?" It becomes more useful when users can drill from a top-level metric to the campaign, channel, keyword, account, region, product, page, or audience behind the number.
Diagnostic marketing analytics
Diagnostic analytics explains why something happened. It connects top-level marketing KPIs to the drivers behind them.
Use diagnostic analytics when you need to know:
- Why did qualified leads drop even though traffic increased?
- Why did paid social spend rise without more pipeline?
- Why did organic traffic grow but conversion rate fall?
- Why did one landing page create more demo requests than another?
- Why did an email segment unsubscribe at a higher rate?
- Why did marketing-sourced pipeline change in one region or product line?
Good diagnostic analysis needs context. A conversion chart alone may not explain whether the issue came from audience quality, message mismatch, tracking changes, form friction, sales routing, budget pacing, seasonality, or a CRM definition change.
Predictive marketing analytics
Predictive analytics estimates what may happen next. In marketing, it can support lead scoring, churn risk, campaign forecasting, demand planning, customer lifetime value, budget pacing, and conversion prediction.
Examples include:
- Estimating which leads are most likely to become opportunities
- Forecasting pipeline based on channel spend, conversion rates, and sales cycle history
- Predicting which customers may churn or expand
- Identifying which audience segments may respond to a campaign
- Flagging campaigns likely to miss target before the reporting period closes
Prediction should stay connected to business review. A score is only useful if users know what data it used, what assumptions apply, who should review it, and what action options are available.
Prescriptive marketing analytics
Prescriptive analytics suggests possible next actions. It may recommend increasing budget for a high-performing segment, pausing a weak campaign, changing landing page messaging, routing leads differently, creating retention campaigns, or reviewing sales follow-up quality.
Prescriptive analytics needs governance because it can influence spend, customer communication, and revenue planning. Recommendations should include evidence, assumptions, owner review, and business context. In most enterprise settings, humans should still approve final campaign and budget decisions.
Metrics of Marketing Analytics
Marketing analytics metrics should match the decision you need to support. A paid media manager, SEO lead, lifecycle marketer, sales leader, CFO, and CEO do not need the same first screen.
Start with the business question, then choose the smallest metric set that can explain performance.
Awareness
Example metrics
- Impressions
- Reach
- Share of voice
- Branded search
- Social audience growth
What it helps answer Are more people discovering the brand?
Traffic
Example metrics
- Sessions
- Users
- Source
- Medium
- Landing page views
- Engaged sessions
What it helps answer Which channels and content assets attract visitors?
Engagement
Example metrics
- Time on page
- Scroll depth
- Video completion
- Email clicks
- Social interactions
What it helps answer Which messages and assets hold attention?
Lead Generation
Example metrics
- Form fills
- Demo requests
- Trials
- Event registrations
- Newsletter signups
What it helps answer Is marketing creating enough demand?
Funnel Conversion
Example metrics
- Visit-to-lead
- Lead-to-MQL
- MQL-to-SQL
- Opportunity progression
- Closed-won movement
What it helps answer Where does the funnel slow down?
Campaign Efficiency
Example metrics
- Spend
- CPC
- CPM
- CPL
- CAC
- CPA
- ROAS
- ROI
What it helps answer Which campaigns use budget efficiently?
Pipeline and Revenue
Example metrics
- Marketing-sourced pipeline
- Influenced pipeline
- Closed-won revenue
- Average deal size
What it helps answer How does marketing affect sales outcomes?
Customer Value
Example metrics
- Repeat purchase
- Retention
- Churn
- Expansion
- Customer lifetime value
What it helps answer Does marketing support growth after acquisition?
Data Quality
Example metrics
- Attribution coverage
- Duplicate leads
- Missing source
- Tracking coverage
- Stale data
What it helps answer Can stakeholders trust the analysis?
Most marketing analytics systems work better with three metric layers:
- Outcome metrics: Revenue, pipeline, qualified demand, customer value, retention, or strategic growth.
- Driver metrics: Traffic, conversion rate, spend, engagement, channel mix, lead quality, campaign activity, or sales handoff.
- Diagnostic fields: Campaign, source, medium, content, keyword, landing page, audience, account, region, product, offer, owner, and funnel stage.
Avoid reporting every available number. If a metric does not explain performance, diagnose a problem, or support a decision, move it to a drill-down view or appendix. A focused analytics dashboard is easier to trust than a crowded screen that treats every metric as equally important.
Data Sources
Marketing analytics depends on connected data. Many projects fail because the visual layer looks complete while the data layer remains fragmented, duplicated, or unclear.
Common marketing analytics data sources include:
Web analytics
Example data: Sessions, users, source, medium, events, conversions, landing pages Common analytics use: Traffic, engagement, conversion, content performance
Ad platforms
Example data: Spend, impressions, clicks, audience, creative, campaign settings Common analytics use: Paid channel efficiency, budget pacing, ROAS, campaign diagnosis
CRM
Example data: Leads, accounts, opportunities, stages, revenue, owners, sales activities Common analytics use: Funnel analysis, lead quality, sales alignment, pipeline impact
Marketing automation
Example data: Email, nurture, scoring, forms, segments, campaign membership Common analytics use: Lifecycle performance, nurture conversion, engagement
Social platforms
Example data: Reach, engagement, referral traffic, audience growth, content themes Common analytics use: Brand awareness, content resonance, social contribution
Ecommerce systems
Example data: Orders, revenue, product, cart, discount, repeat purchase, returns Common analytics use: Ecommerce analytics, basket analysis, customer value
Customer data platforms
Example data: Identity, segment, behavior, lifecycle status, consent Common analytics use: Audience analysis, personalization, journey analysis
Finance systems
Example data: Budget, vendor cost, revenue, margin, forecast Common analytics use: Spend governance, ROI, profitability, executive review
Spreadsheets
Example data: Campaign calendars, test notes, manual targets, local adjustments Common analytics use: Planning context, temporary inputs, transition-stage reporting
Before building charts, define the business terms. "Lead," "MQL," "source," "campaign influence," "conversion," "customer," "revenue," and "ROI" can mean different things across systems. If definitions are not governed, the analytics output will be debated instead of used.
This is where a data analytics strategy and a data analytics framework become practical. The dashboard is only as useful as the data model, metric dictionary, refresh rhythm, permission rules, and owner workflow behind it.
Examples and Templates
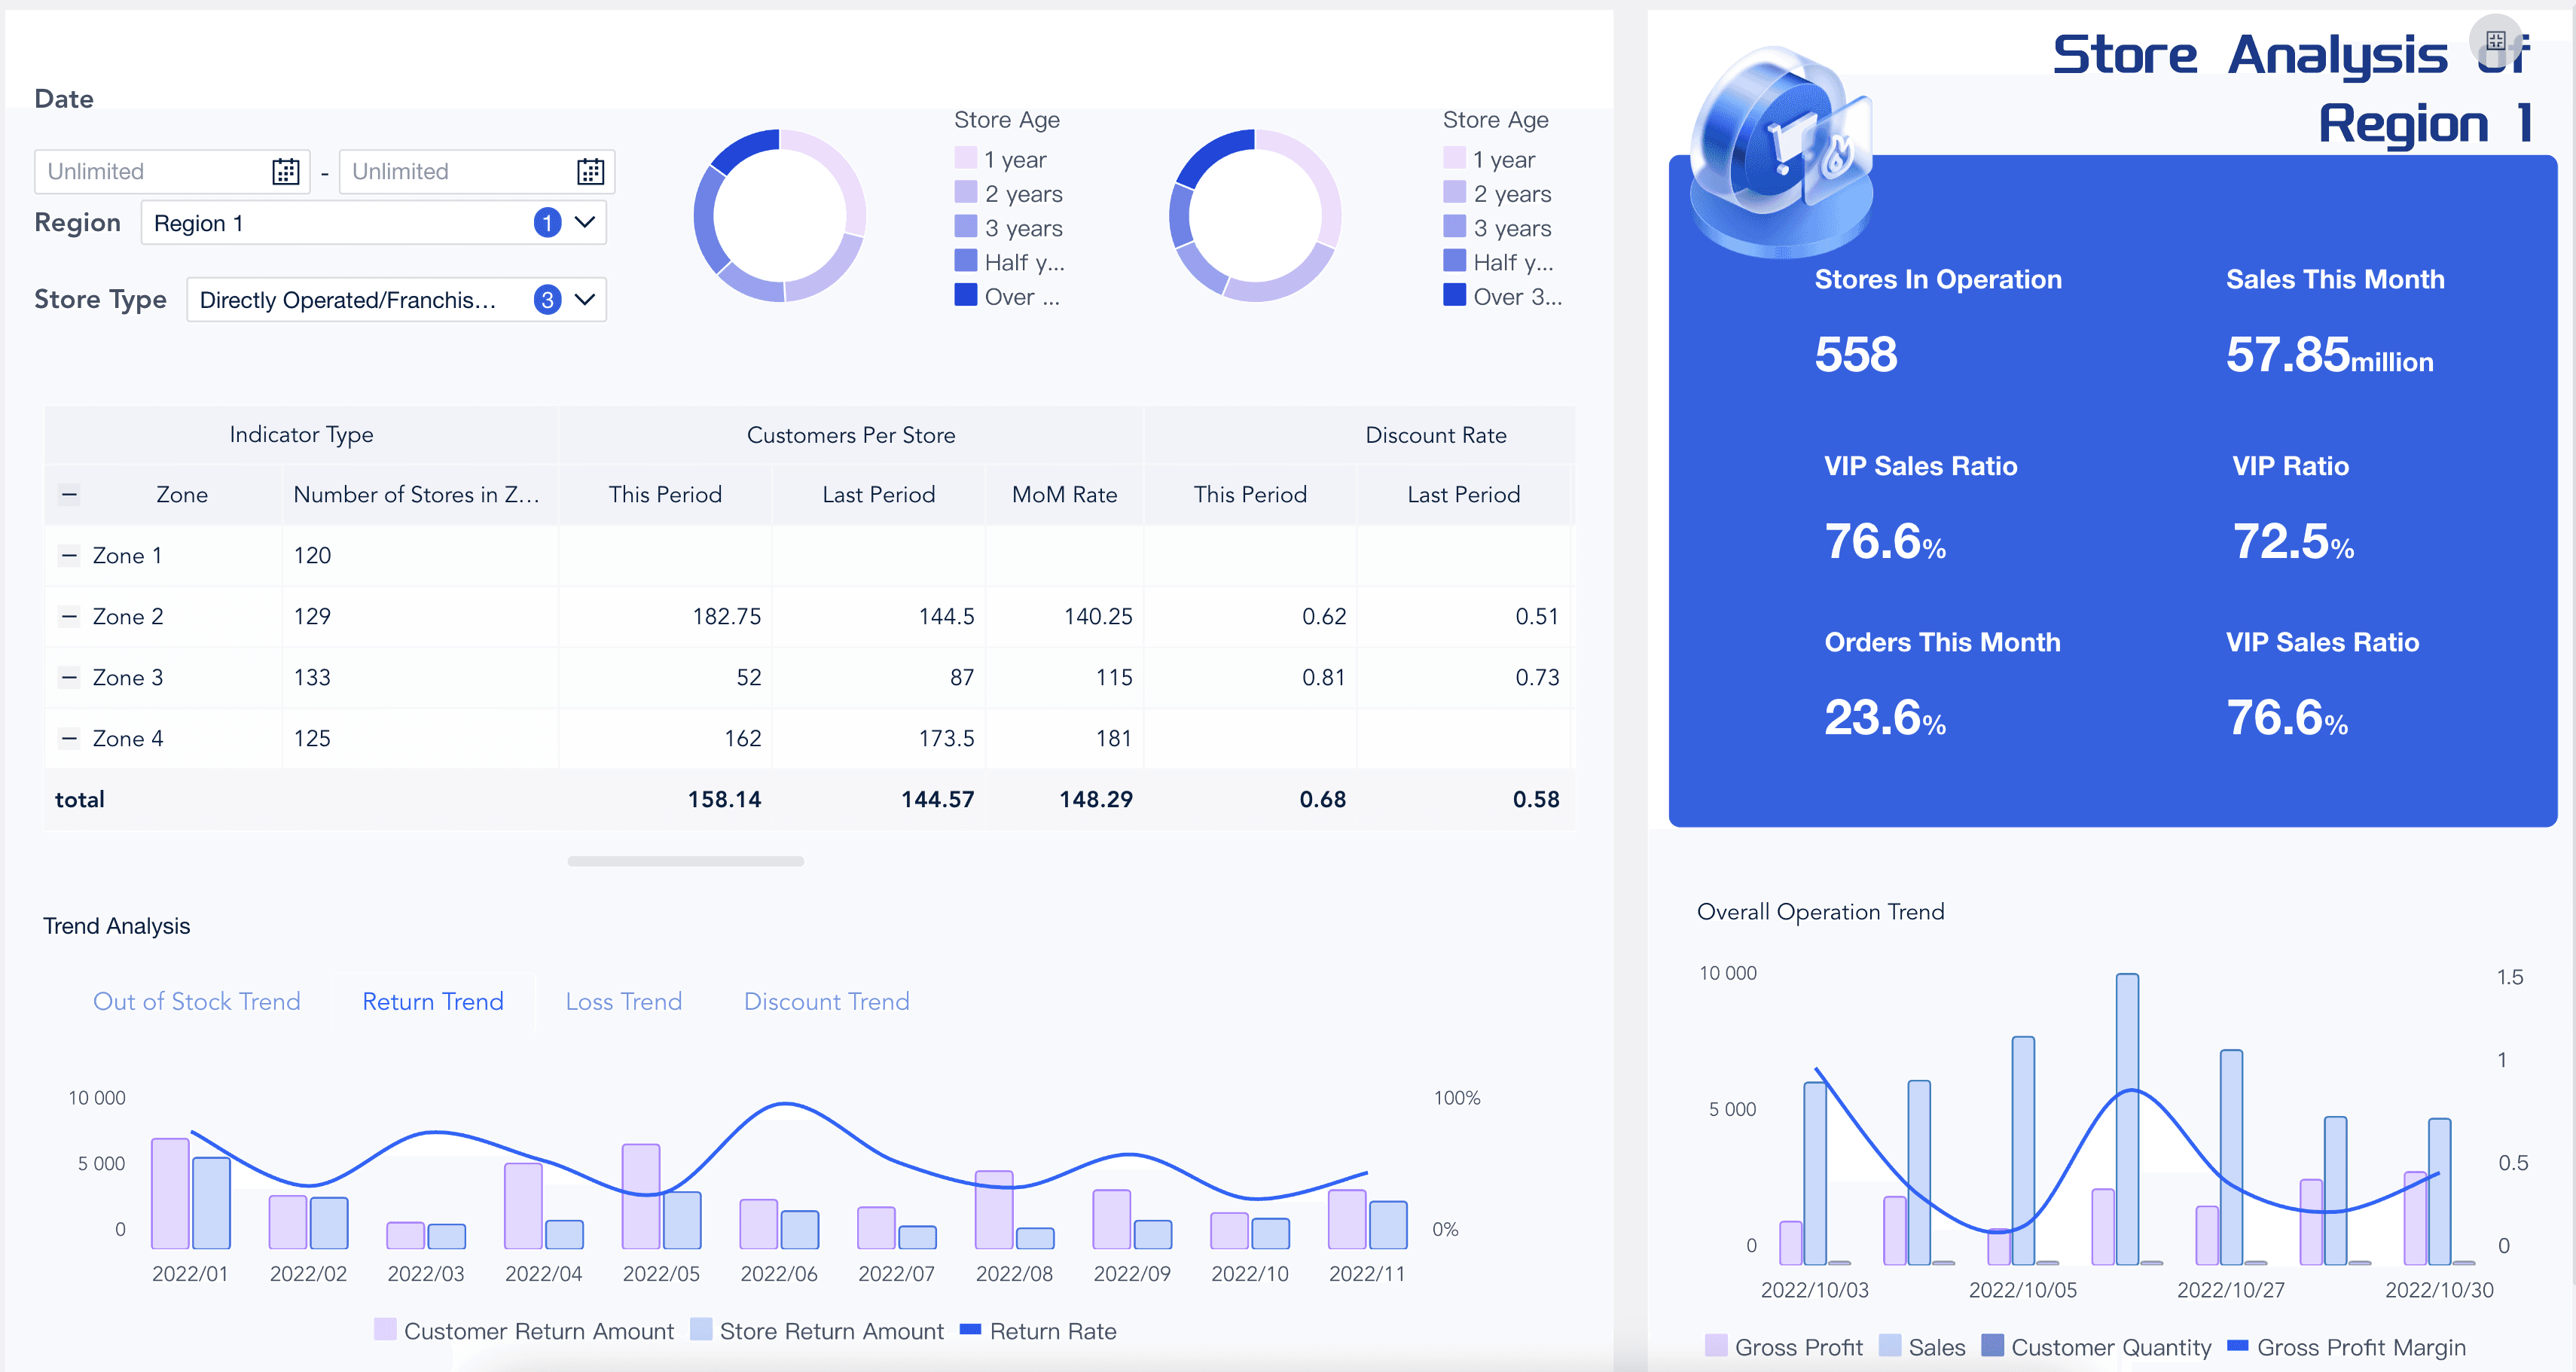
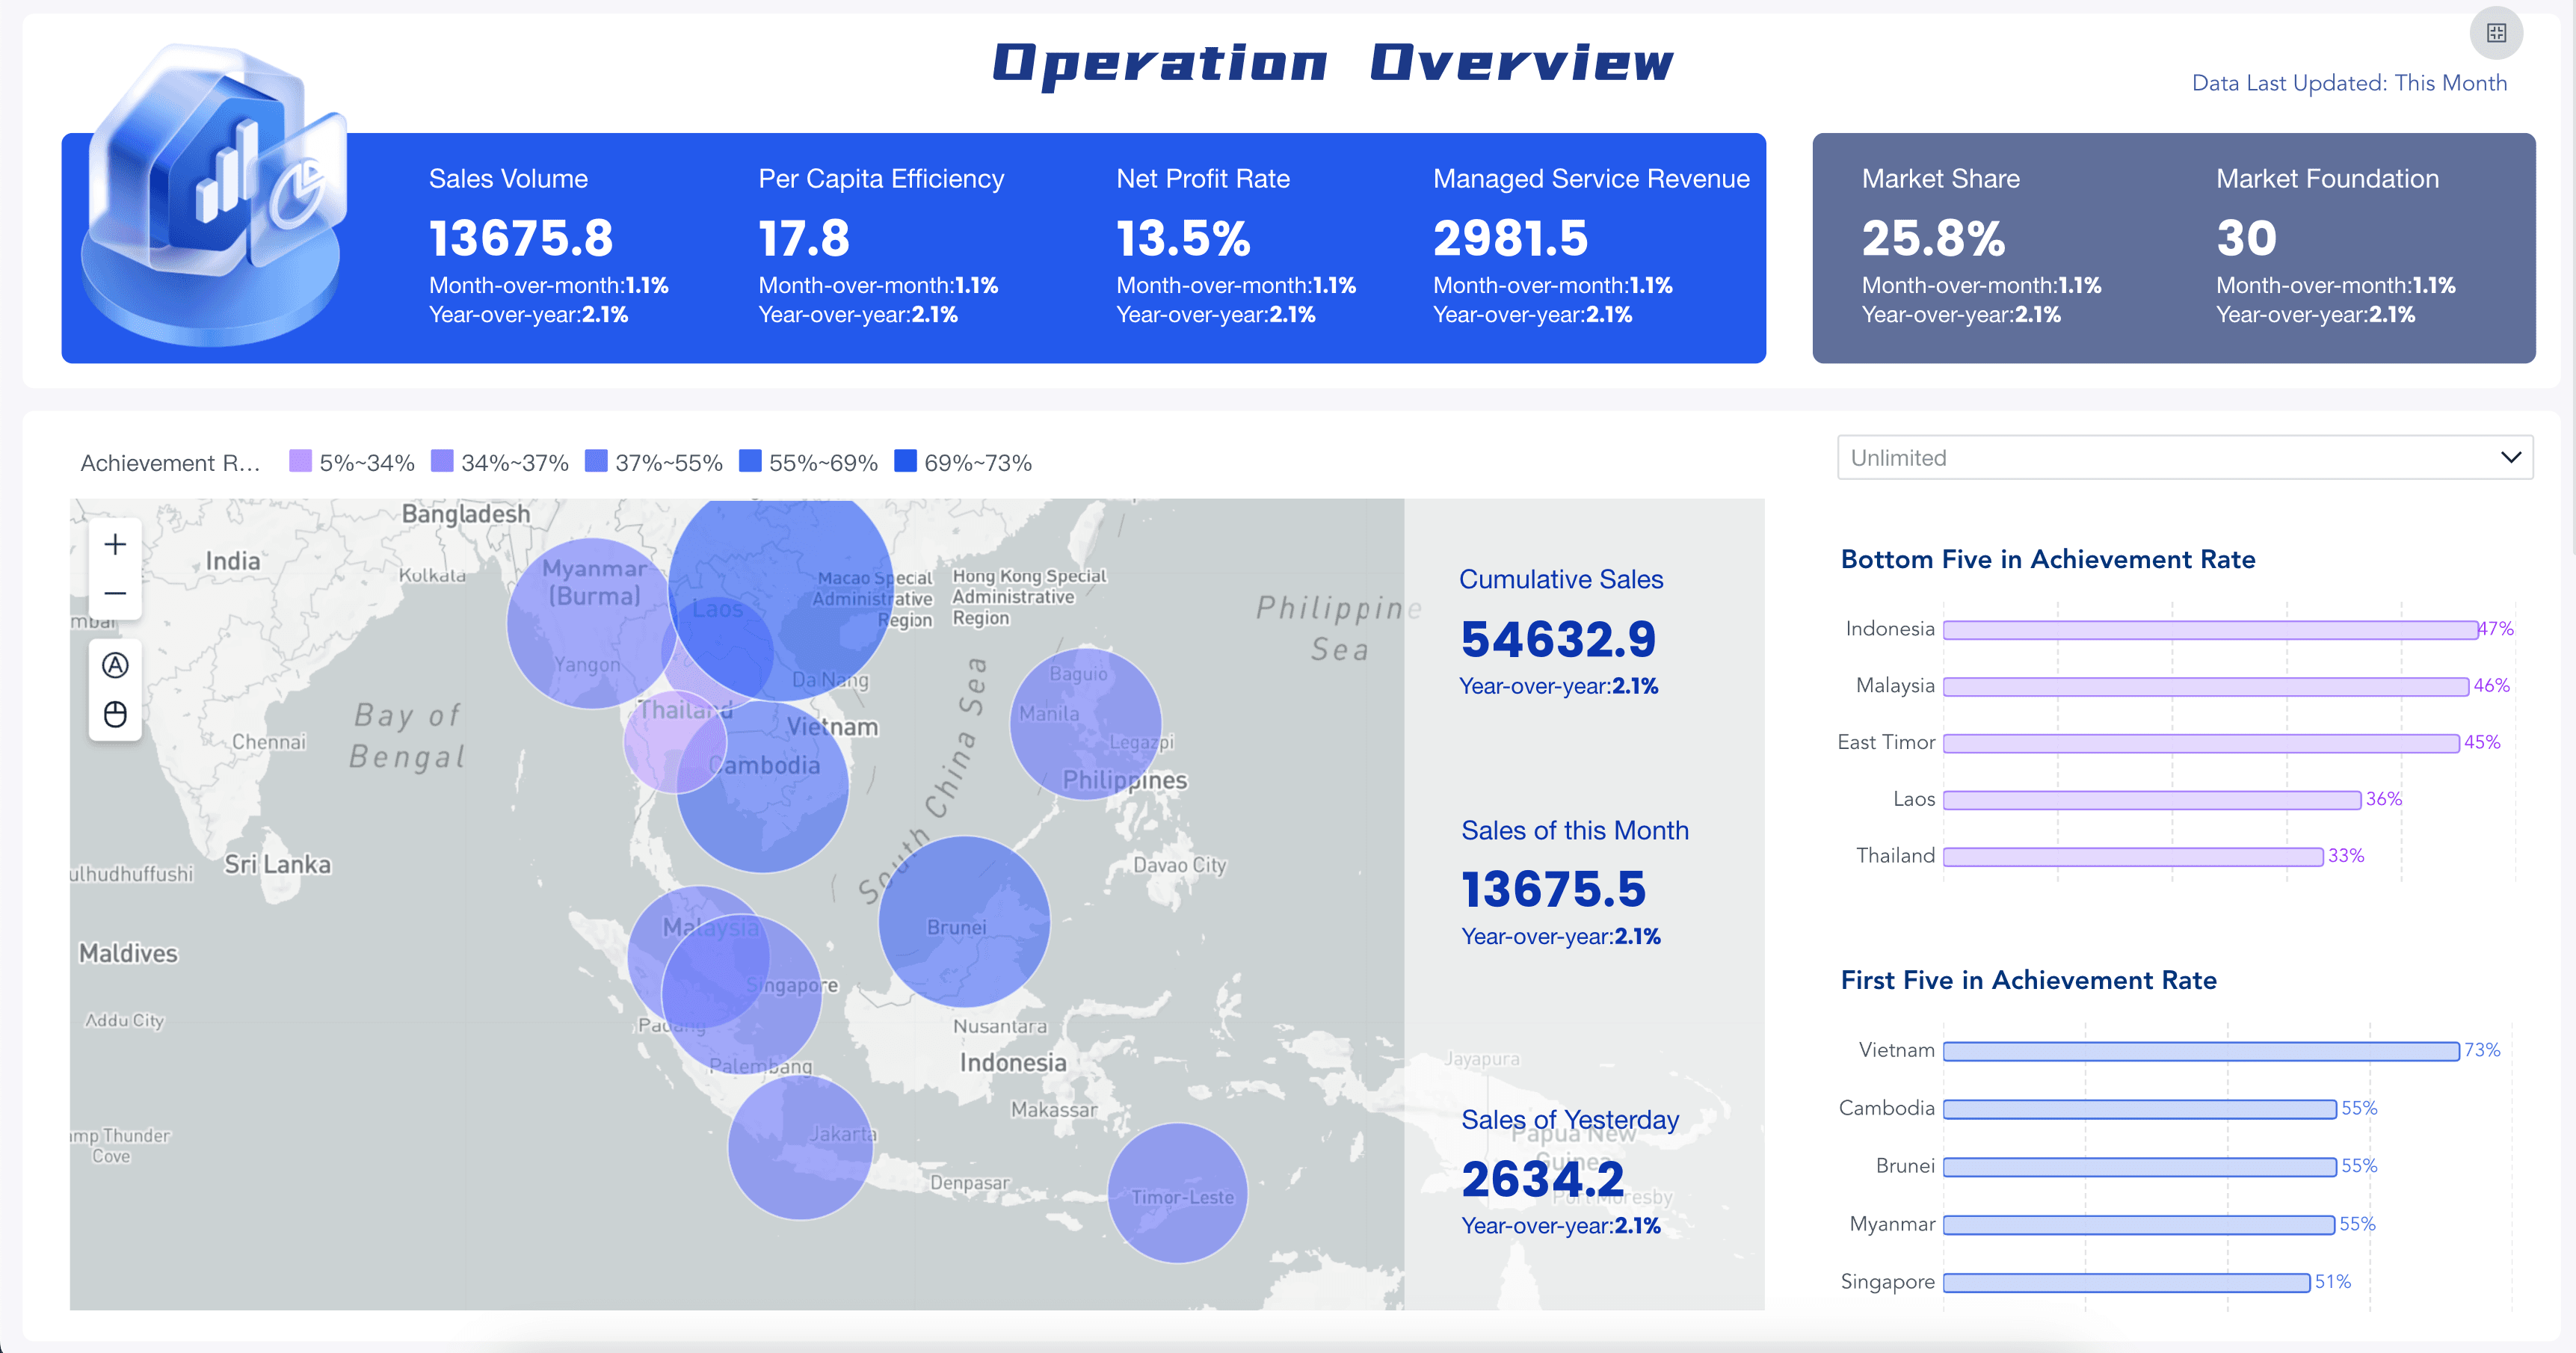
Examples make marketing analytics easier to understand because they turn a broad topic into specific decision spaces. The demo cards below come from the Gallery demo file and match marketing analytics topics such as campaign attribution, funnel conversion, customer insight, ecommerce behavior, retail response, and sales alignment.
Use these examples as learning prompts. Before copying a layout, ask: Who will use this view? What decision should it support? Which KPI definitions must remain consistent across reports?
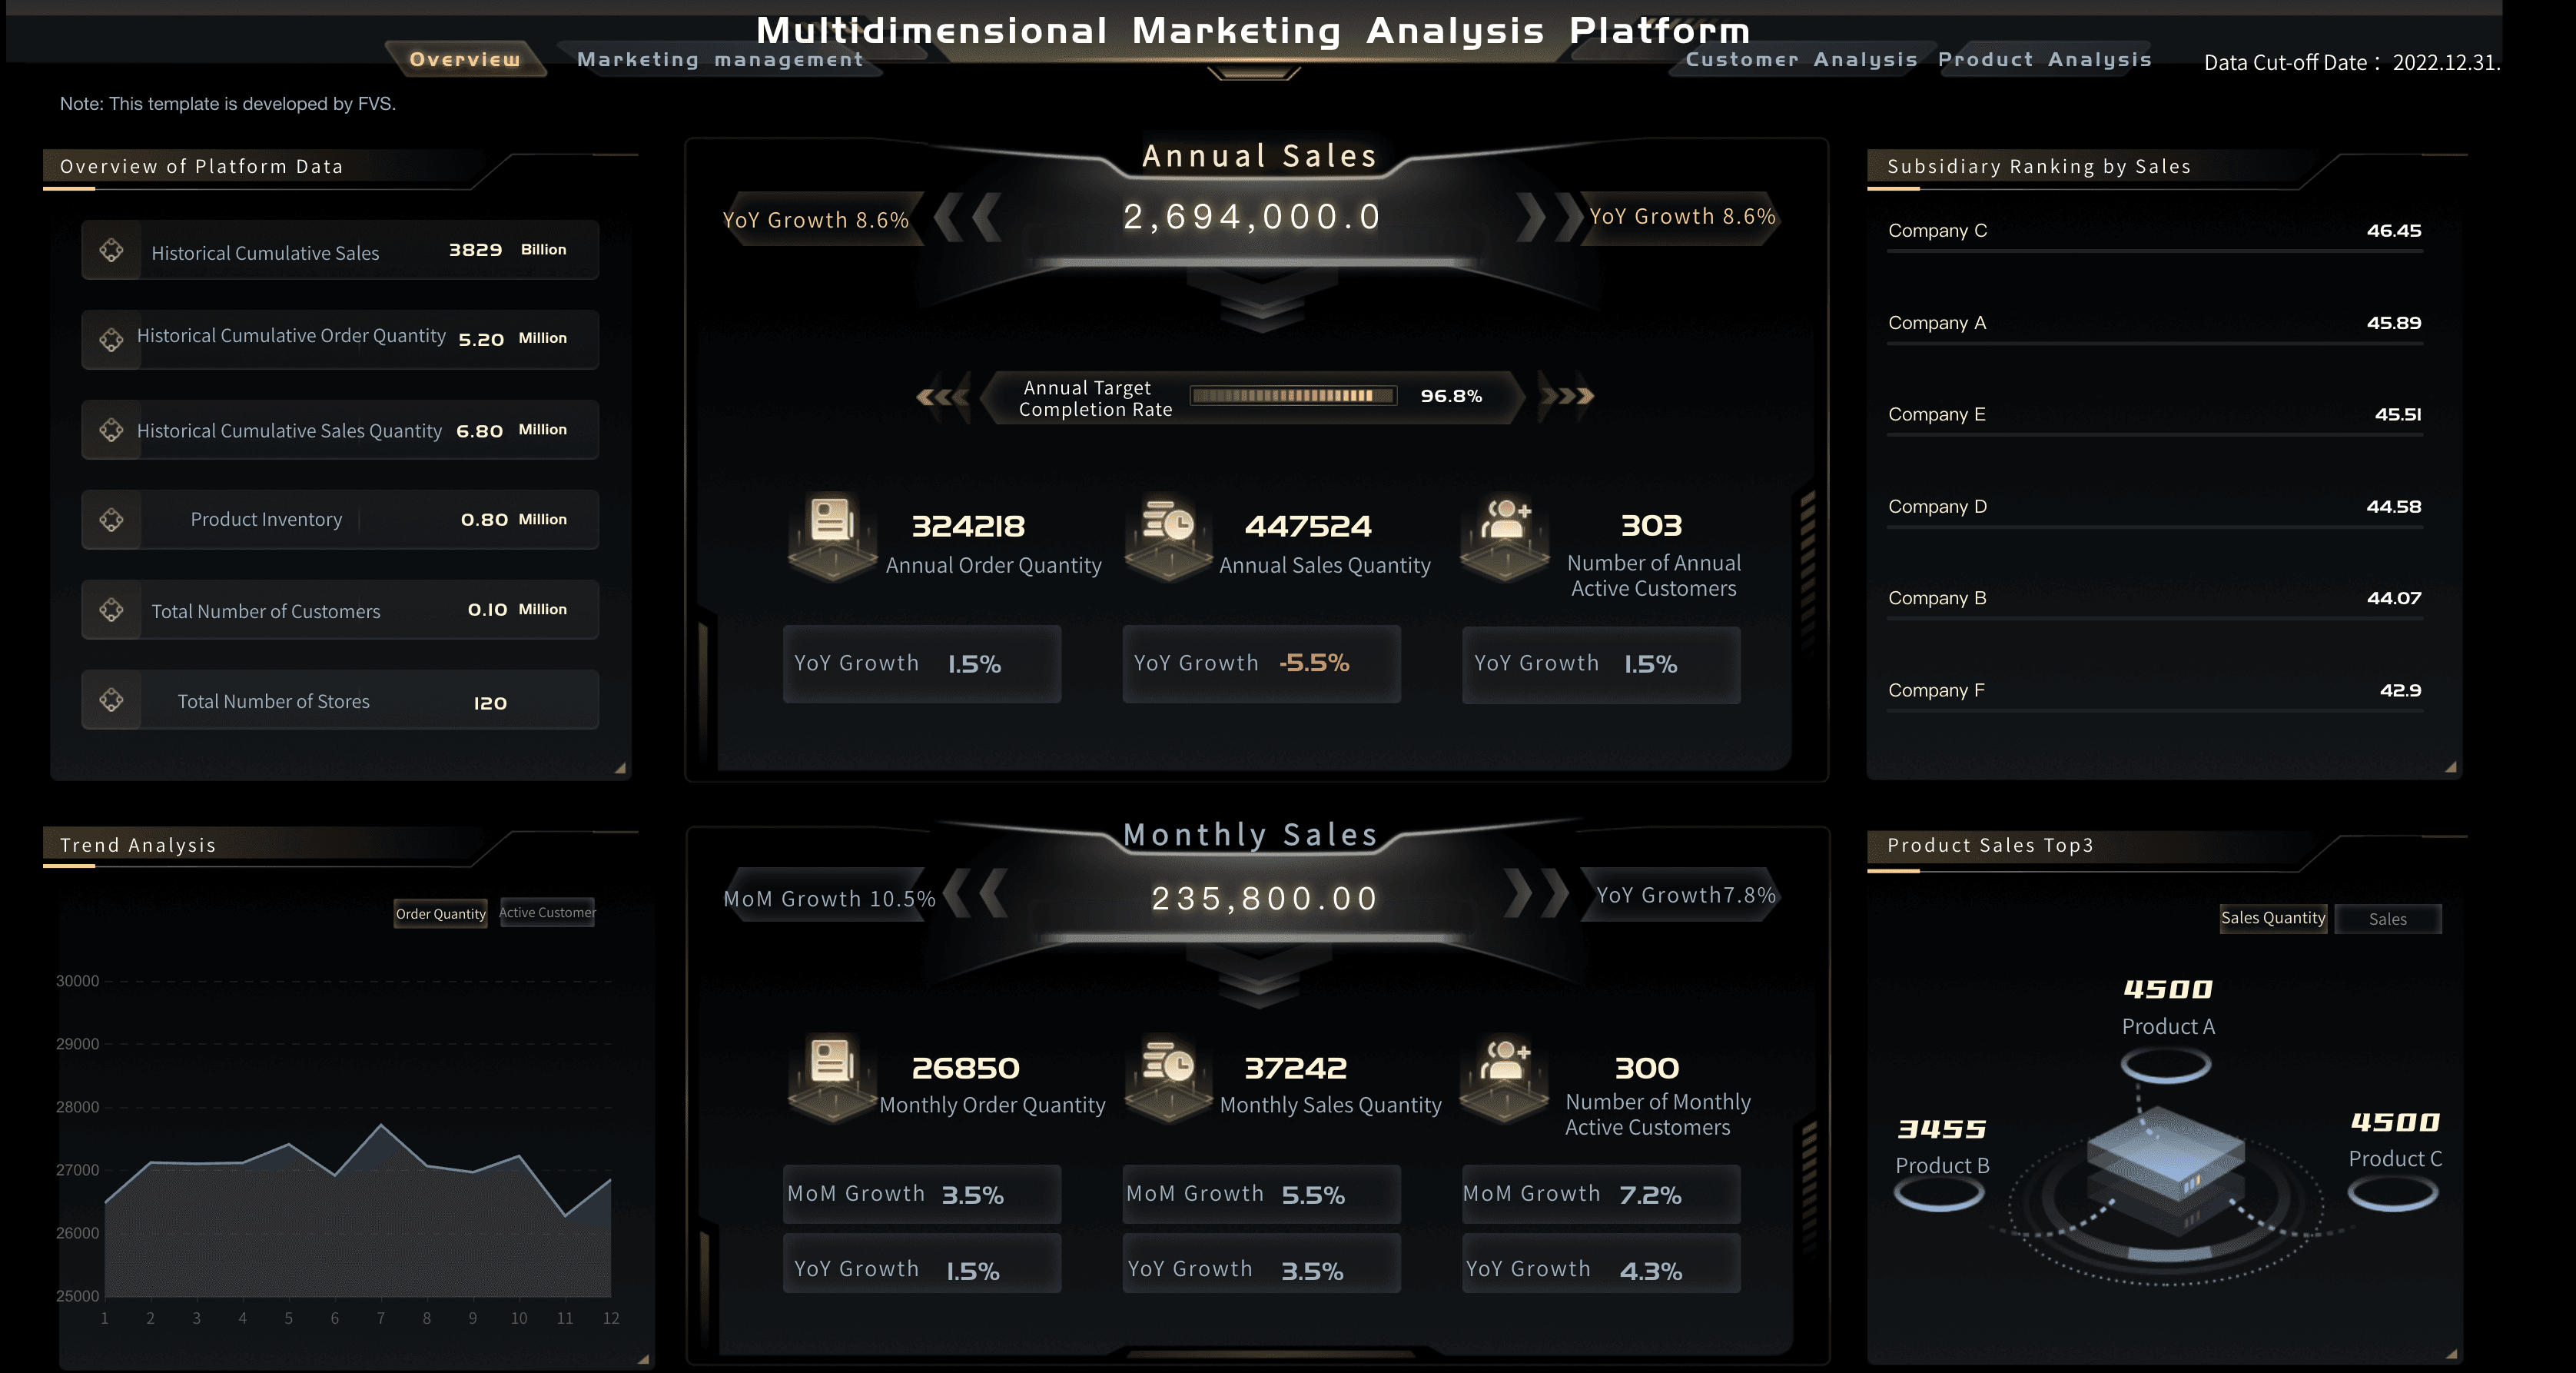
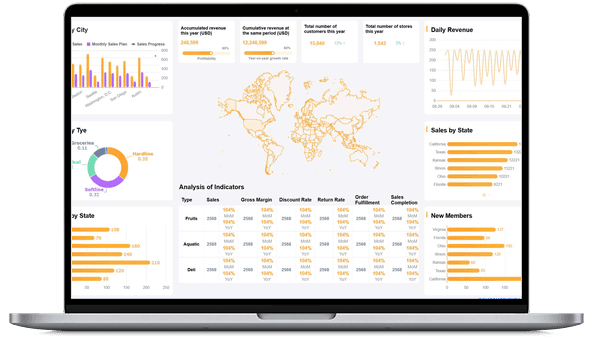
Marketing Analytics Platform

Consumer Data Center Solution
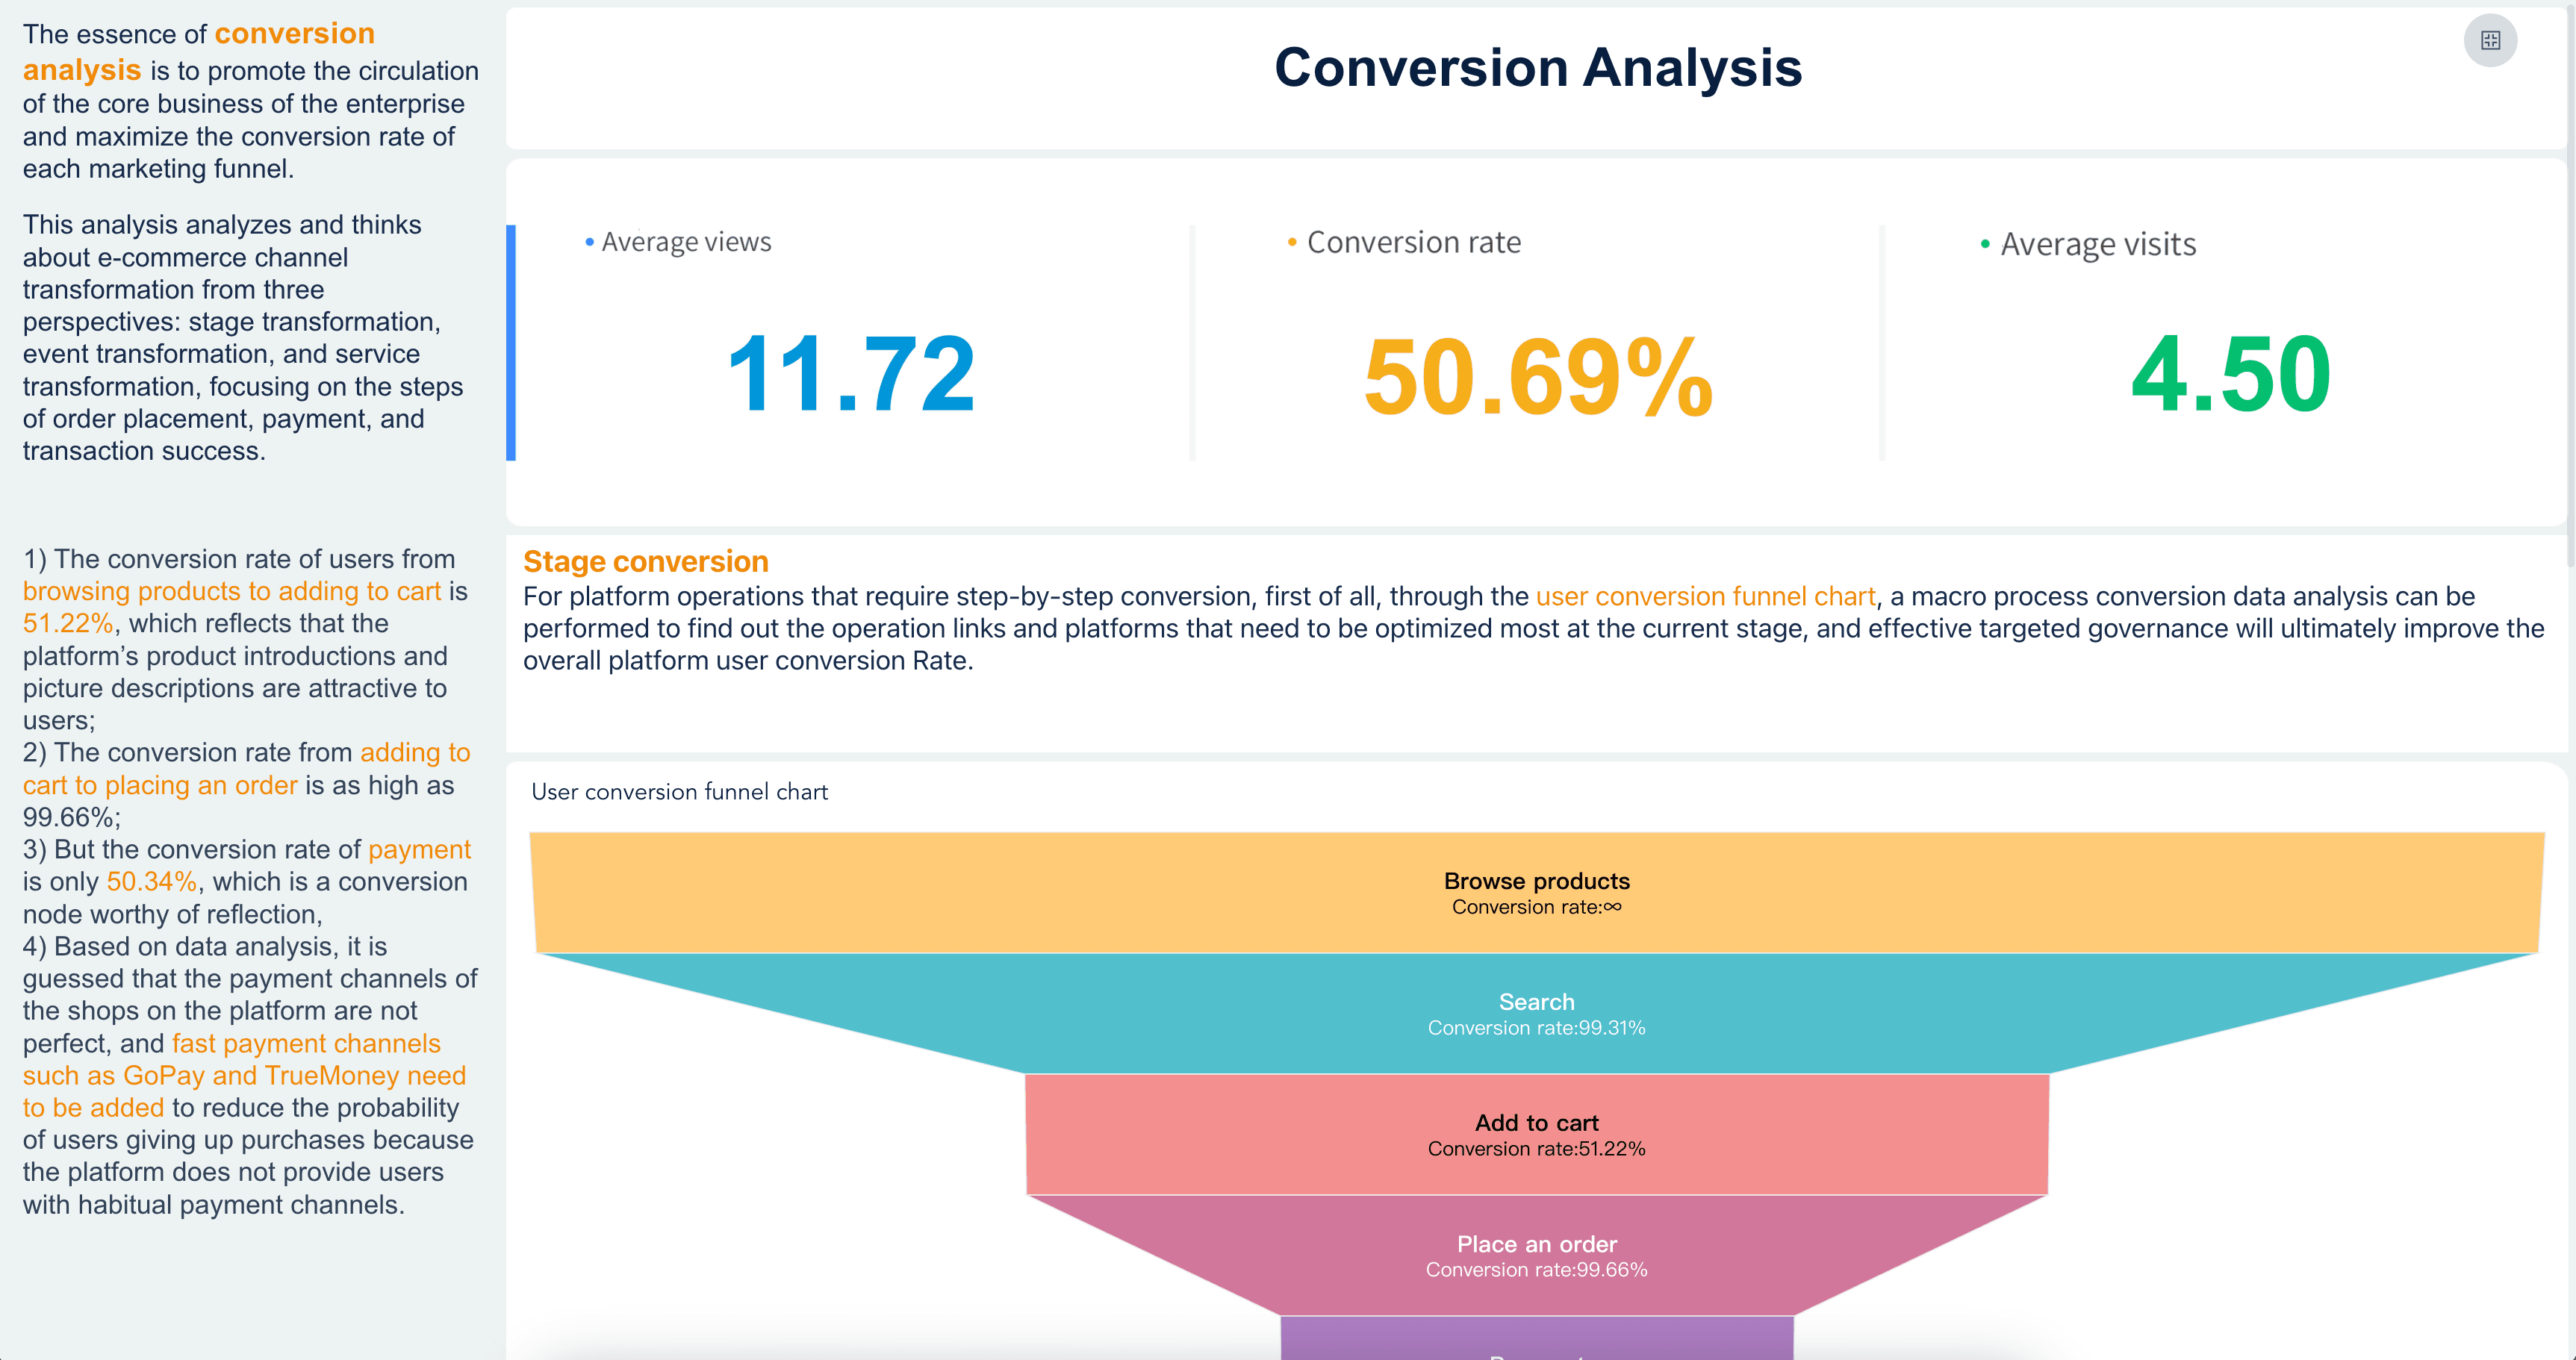
Conversion Analysis
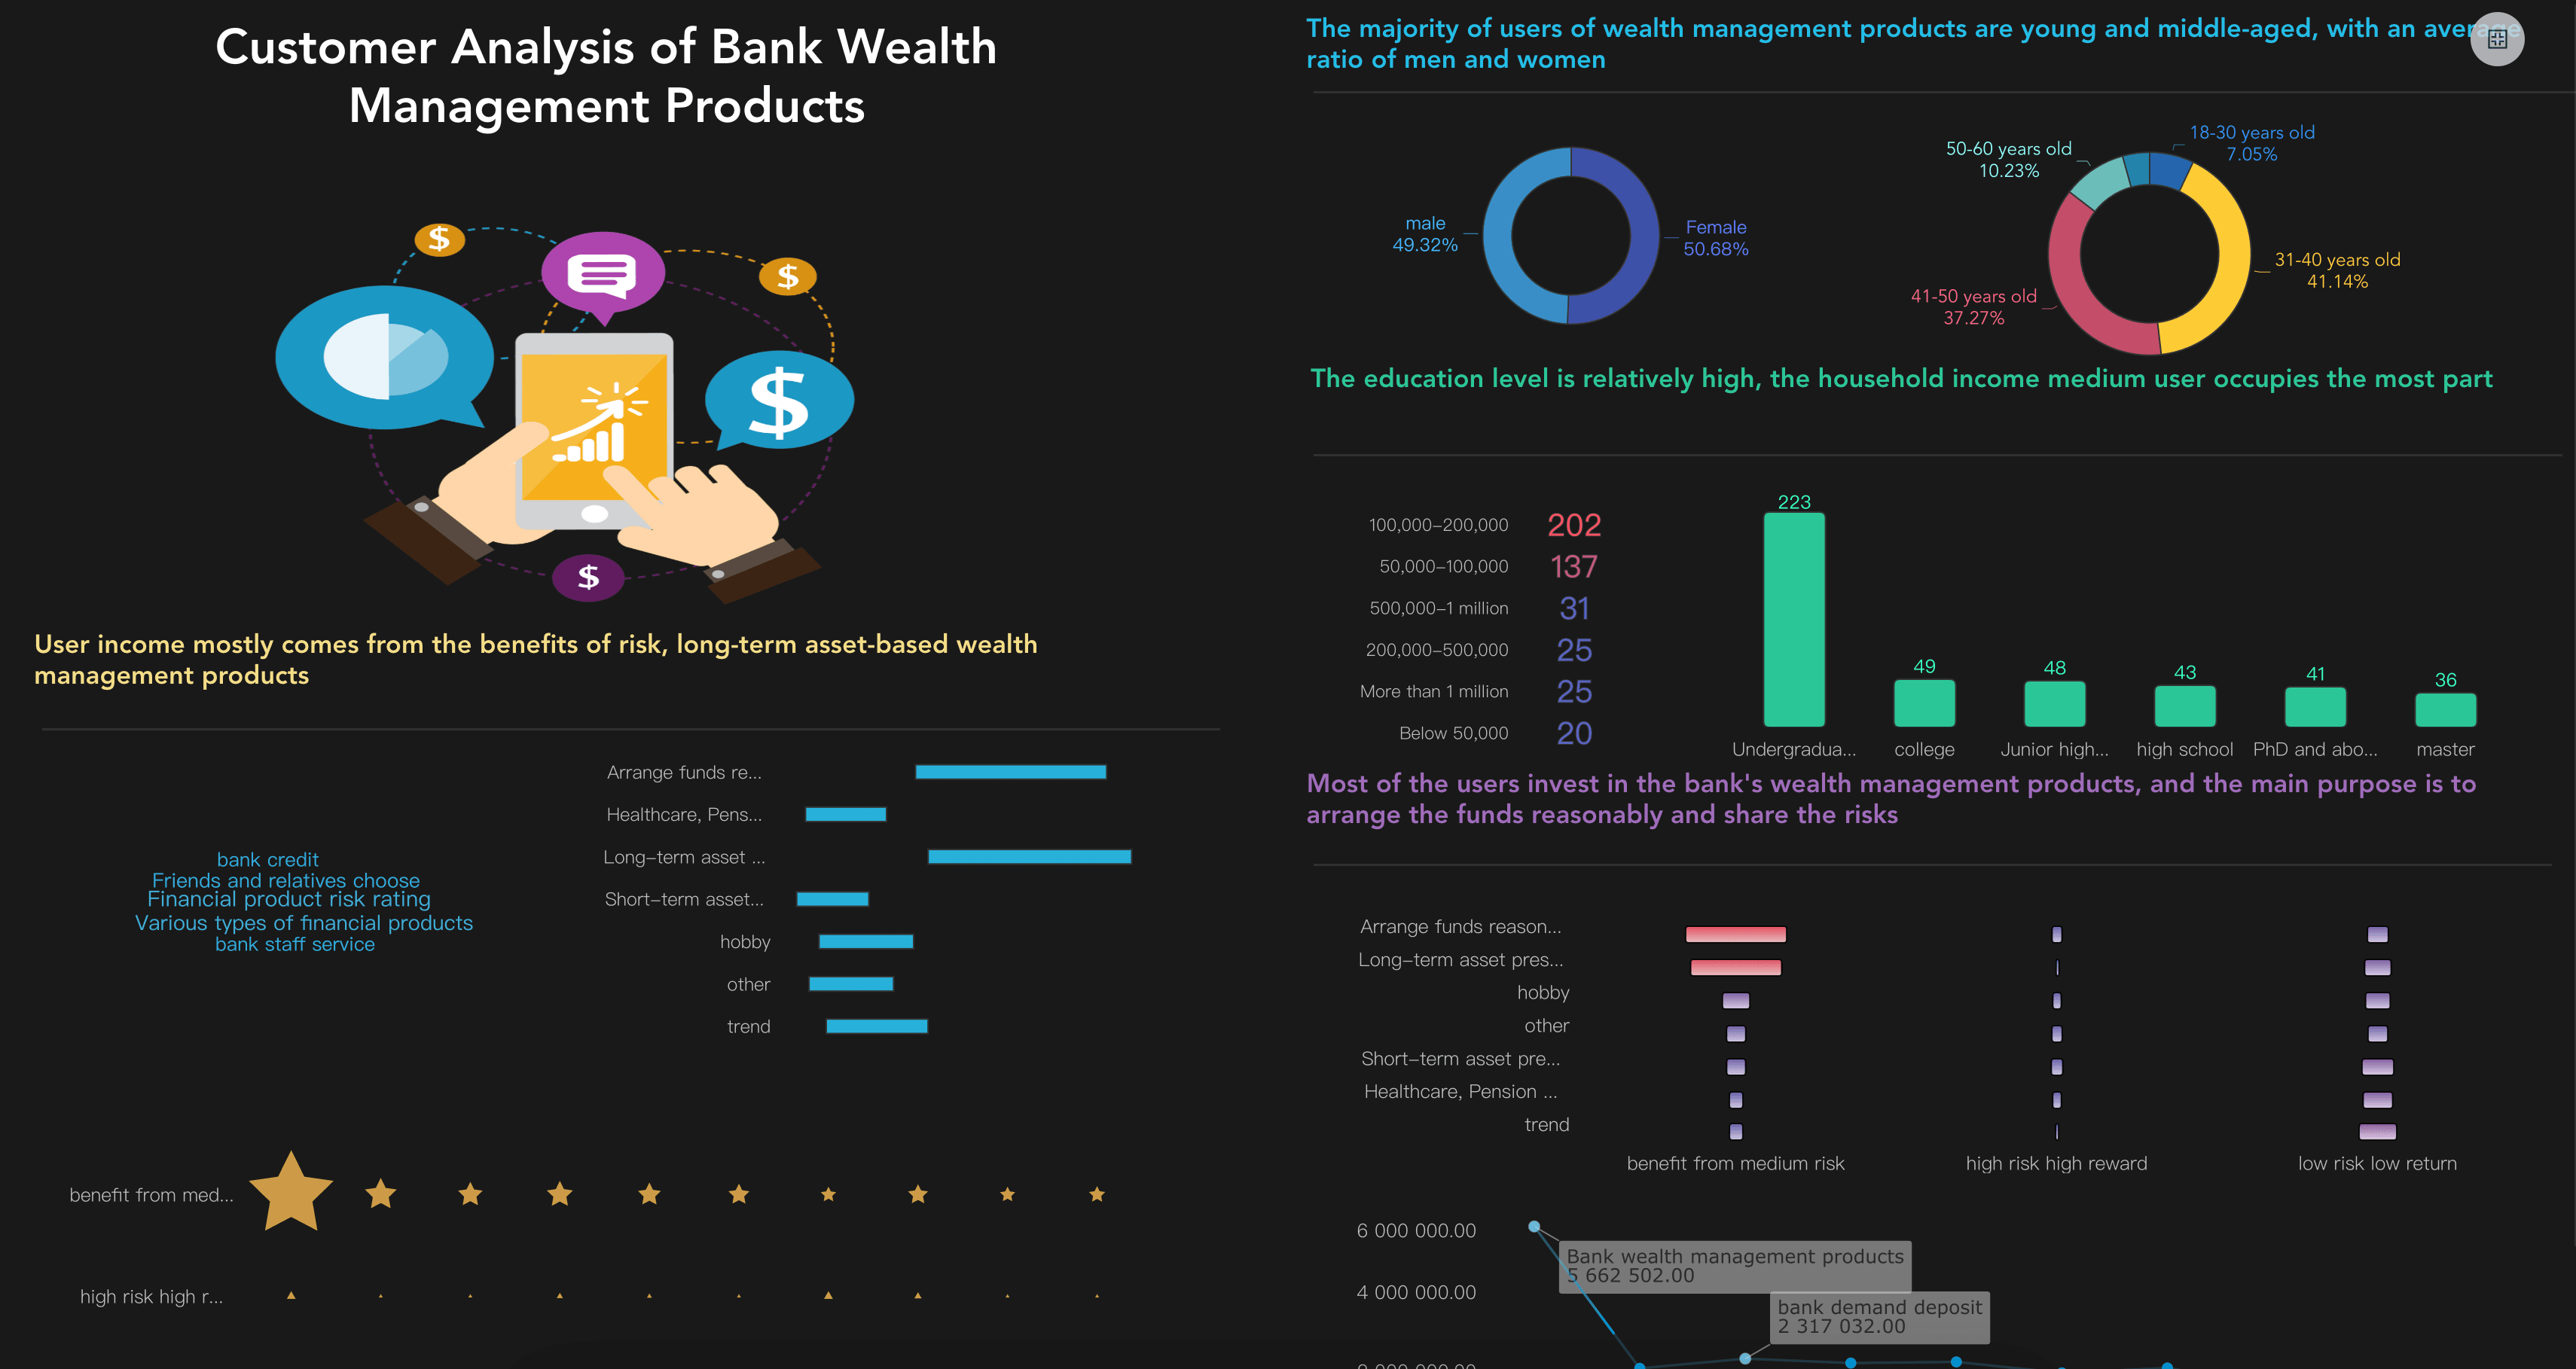
Customer Analytics Dashboard
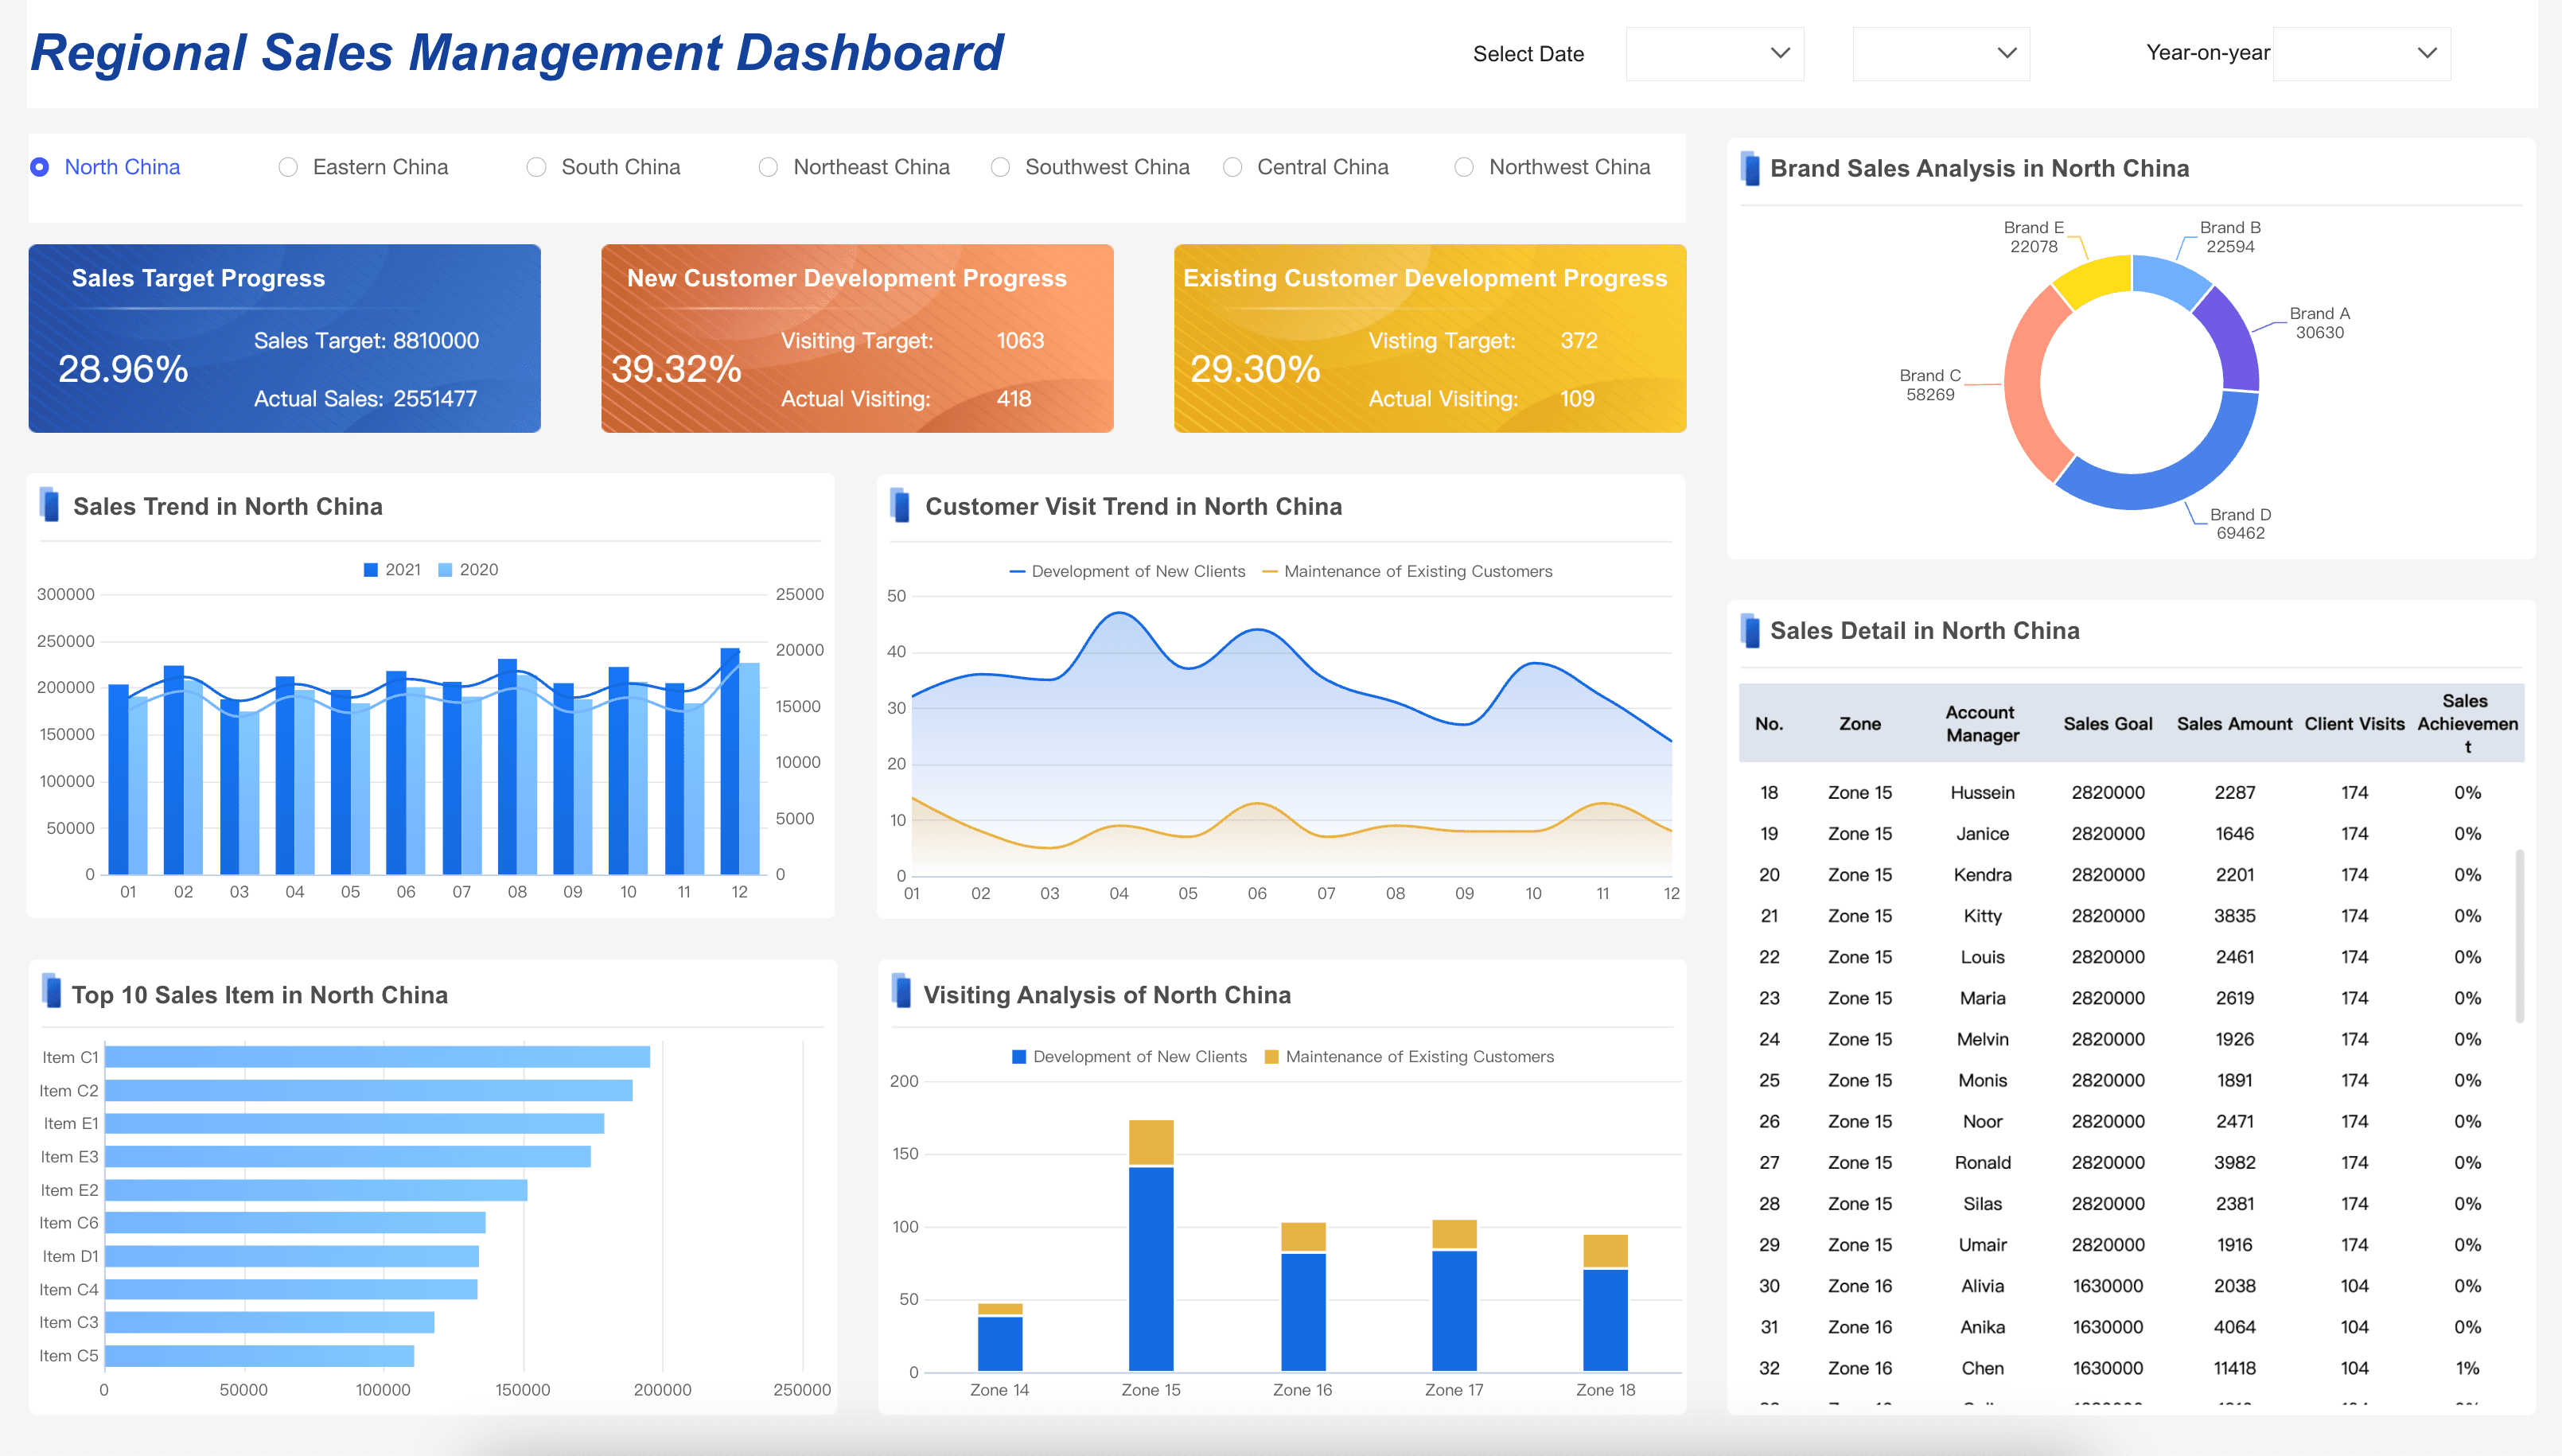
Sales Management Dashboard
Retail Analytics Dashboard

Store Dashboard
Retail Business Dashboard
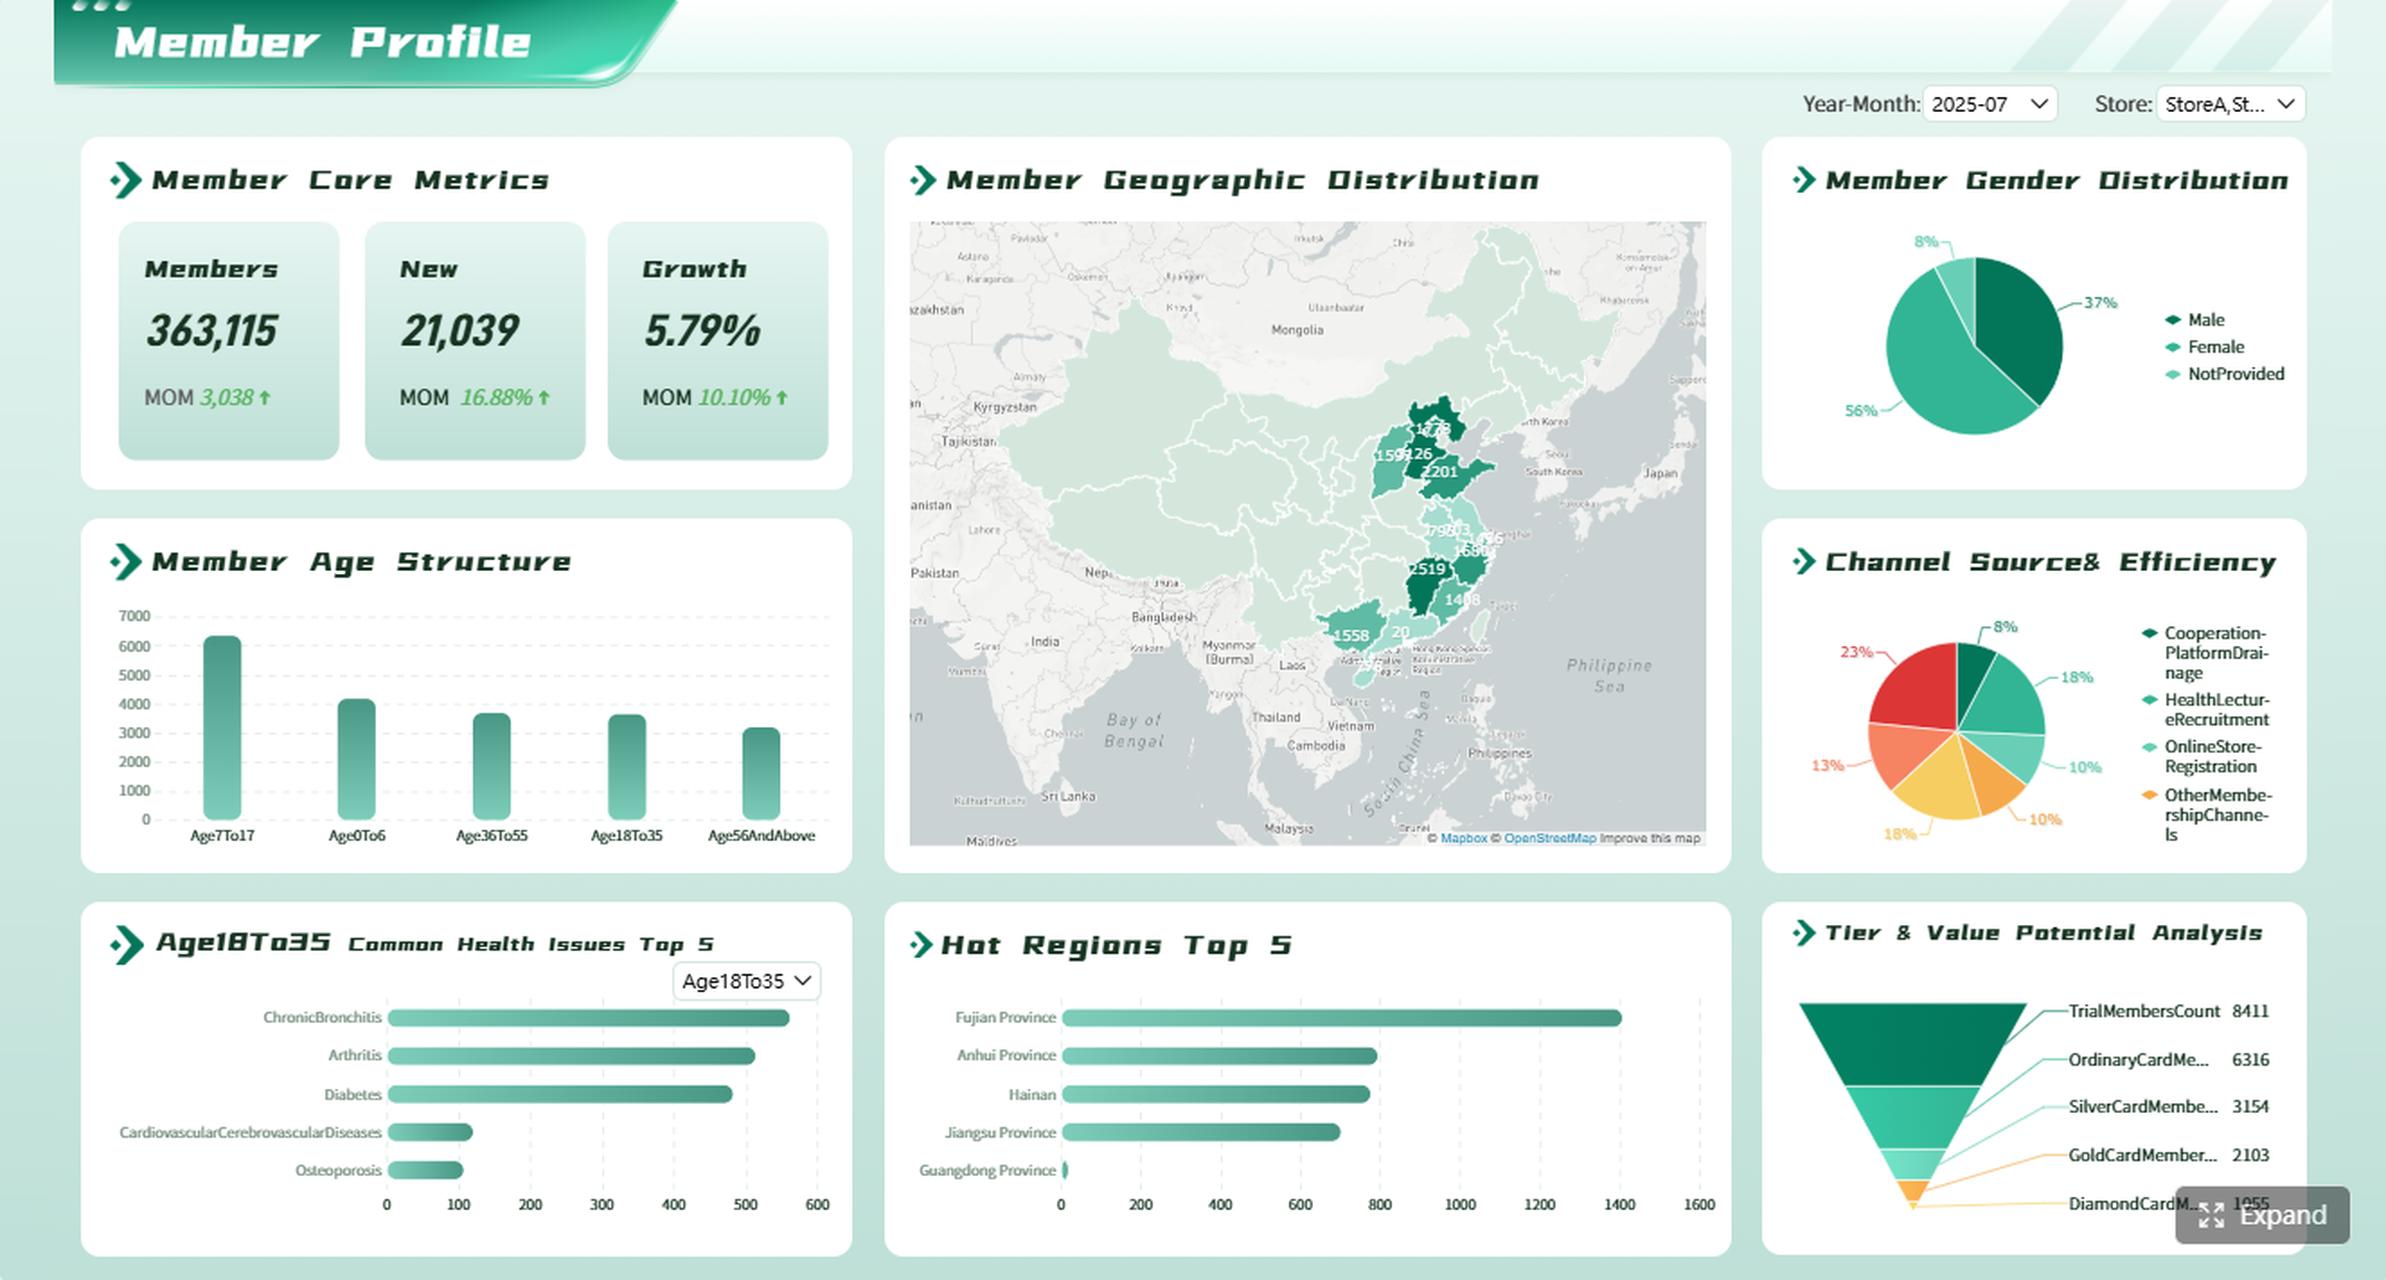
Member Analytics Dashboard
Marketing Analytics Workflow
Marketing analytics becomes useful when the workflow is repeatable. The first version does not need to solve every marketing question. It should solve one recurring decision well.
Use this workflow as a practical build path:
- Choose one decision. Start with a clear question, such as "Which channels should receive more budget next month?" or "Why did enterprise demo requests decline this week?"
- Define the audience. Decide whether the view is for executives, marketing managers, campaign owners, sales leaders, finance, or analysts.
- Map the data sources. List the systems, fields, refresh frequency, owners, and known data quality issues.
- Standardize KPI definitions. Write formulas for leads, MQLs, SQLs, CAC, ROAS, ROI, pipeline, attribution, conversion stages, and revenue.
- Create the visual structure. Use a small set of charts that match the question: trends for movement, bars for comparison, funnels for conversion, and tables for detail.
- Add commentary. Explain what changed, why it matters, what may have caused it, and what should happen next.
- Review data quality. Note missing sources, tracking changes, duplicate leads, delayed CRM updates, and attribution limitations.
- Assign follow-up. Every meaningful recommendation should have an owner, next step, and review date.
- Retire unused sections. If a chart does not change decisions for several cycles, simplify it or move it to a drill-down view.
This workflow also helps teams decide when to use ad hoc reporting, when to build a recurring BI reporting process, and when reporting software is needed. Small teams may start with spreadsheets and slide summaries. Larger teams usually need shared metric definitions, access control, scheduled refresh, reusable report assets, and governed commentary.
Challenges
Marketing analytics often fails for organizational reasons before it fails for technical reasons. The dashboard may look polished, but if people do not trust the definitions, the meeting turns into a debate about data instead of a decision about action.
Common challenges include:
- Fragmented data sources: Ad platforms, CRM, web analytics, ecommerce, and finance systems may store different versions of campaign, source, customer, and revenue data.
- Inconsistent definitions: Teams may calculate leads, MQLs, attribution, pipeline, revenue, CAC, and ROI differently.
- Weak attribution logic: Multi-touch journeys, long sales cycles, offline activity, partner influence, and privacy changes can make campaign contribution hard to explain.
- Data quality issues: Missing UTMs, duplicate leads, delayed CRM updates, bot traffic, broken tracking, and manual spreadsheet edits can distort analysis.
- Too many metrics: A crowded view makes it hard to see the signal. More charts do not automatically create better decisions.
- No owner workflow: Insights fade when the report does not assign owners, deadlines, follow-up questions, or next review dates.
- Overconfident automation: AI-generated summaries can mislead users if they are not grounded in governed metrics, source traceability, permissions, and human review.
The solution is not to add more dashboards. The solution is to improve the operating system around analytics: trusted data, clear definitions, useful visual hierarchy, stakeholder-specific views, commentary, and follow-up ownership.
Marketing Analytics With FineReport + Dora
After the marketing analytics structure is clear, FineReport + Dora can help teams move from manual data work to a more repeatable learning workflow.
FineReport can support the reporting and dashboard layer of marketing analytics: connecting data sources, designing operational dashboards, building formatted reports, creating reusable templates, scheduling report delivery, managing permissions, and helping teams present analysis in a structured format. This matters because marketing analytics depends on consistent definitions. If every dashboard calculates leads, spend, attribution, or revenue differently, the narrative will not be trusted.
Dora adds the AI action layer above governed BI and reporting assets. As a data agent, Dora can help users ask natural-language questions, search existing reports and dashboards, generate charts or structured briefings from configured data assets, summarize changes, push scheduled updates, and follow up with responsible owners. Dora should not replace the marketing team or make campaign decisions alone. It works best when it operates on trusted metrics, business terms, permissions, Skills, source traceability, and human review.
For a marketing analytics scenario, two useful Dora digital employees could be:
- Marketing Performance Analyst: Answers follow-up questions about traffic, spend, conversion, lead quality, campaign variance, and revenue impact using governed FineReport assets.
- Weekly Briefing Secretary: Generates scheduled marketing summaries, flags abnormal changes, and pushes report notes to the right owner for review.
Example chat-style prompts:
- "Show this month's marketing performance by channel. Include spend, leads, MQLs, pipeline, CAC, and the top three changes from last month."
- "Explain why demo requests dropped for enterprise accounts this week. Compare traffic source, landing page conversion, campaign spend, and CRM rejection reasons."
- "Create a dashboard-style view of campaign ROI by channel, region, and product line, then list which campaigns need budget review."
- "Summarize this week's marketing risks and assign follow-up questions for paid media, SEO, content, and sales operations."
- "Find the latest campaign report for the retail segment and generate a short briefing for the regional marketing manager."
A closed-loop AI workflow could look like this:
- Retrieve trusted data: Dora reads configured FineReport assets, KPI definitions, campaign fields, channel mappings, and permission rules.
- Detect meaningful movement: It compares current results with targets, previous periods, and known campaign changes.
- Explain likely drivers: It highlights where variance appears, such as spend changes, conversion drops, lead quality issues, or CRM stage movement.
- Generate the briefing: It creates a structured summary with charts, metric notes, commentary, and data quality warnings.
- Push to owners: It sends the relevant sections to campaign owners, sales operations, or leadership channels for review.
- Follow up and summarize: It tracks open questions, captures human feedback, and prepares a clearer summary for the next review.
 Dora's Workflow
This is the practical value of enterprise AI agents in marketing analytics. The value is not a generic chatbot that improvises from disconnected tables. The value is a governed workflow where natural-language questions map to trusted reports, semantic rules, reusable Skills, permissions, and reviewable outputs.
For IT teams, this shifts work from manually building every recurring analysis to maintaining data connections, metric definitions, semantic layers, access rules, and reusable workflows. For business users, it reduces the wait between a question and a useful first analysis. For executives, it makes marketing analytics easier to connect to action: what changed, why it matters, who owns the next step, and what will be reviewed next.
The reason this scenario can work in a real enterprise is simple: scenario + product + service. Start with one recurring marketing analytics workflow, use FineReport to govern the report and dashboard assets, use Dora to make the workflow easier to query and follow up, and support rollout with data connection, KPI definition, permission setup, Skills configuration, and user training.
If your team is exploring AI-assisted analytics beyond marketing, related learning paths include AI assistant for business and AI agent workflow.
Marketing Analytics Hub
This marketing analytics guide should work as one spoke in a broader analytics, dashboard, and reporting learning path. Marketing analytics explains campaign performance, channel efficiency, customer behavior, and growth decisions. Adjacent pages can help users go deeper into specific formats and use cases.
Use these related resources to build a complete learning path:
- Start with digital marketing analytics when the focus is web, paid, SEO, email, social, and conversion data.
- Review a marketing analytics dashboard when the team needs example views for channel, campaign, and funnel performance.
- Use a marketing dashboard when the first need is continuous monitoring rather than deep analysis.
- Pair analytics with a marketing report when stakeholders need a structured narrative for a defined period.
- Explore ecommerce analytics and ecommerce analytics tools when online store behavior, product performance, and customer value matter.
- Use customer behavior analysis and customer loyalty analytics when retention, repeat purchase, and customer lifetime value become central.
- Review data dashboard, data analytics dashboard, and analytics dashboard concepts when the team needs a stronger visual design foundation.
- Connect the analytics workflow to business intelligence, BI reporting, and reporting software when the work moves beyond one team.
FAQs
Marketing analytics is the process of collecting, connecting, analyzing, and explaining marketing data so teams can understand campaign performance, channel efficiency, audience behavior, funnel conversion, customer value, and revenue impact. It helps teams move from raw metrics to decisions.
A marketing analytics dashboard should include the metrics needed for a specific decision. Common sections include revenue or pipeline impact, qualified leads, conversion rate, spend, CAC, ROAS, channel performance, campaign trends, funnel movement, customer segments, data quality notes, and follow-up owners.
Marketing reporting communicates performance for a defined period or campaign. Marketing analytics investigates the drivers behind that performance and helps decide what to do next. Reporting explains the story; analytics tests, deepens, and improves the story.
The most important metrics depend on the decision. High-value metrics often include qualified leads, conversion rate, pipeline, revenue, customer acquisition cost, return on ad spend, channel ROI, lead quality, retention, and customer lifetime value. Avoid filling the first screen with metrics that do not change action.
FineReport can help teams connect data, create dashboards, build formatted reports, schedule delivery, and manage permissions. Dora can act as the AI Data Agent layer that answers follow-up questions, generates scheduled summaries, drafts commentary, flags abnormal changes, and pushes follow-up tasks based on governed reporting assets. Human review should remain part of the workflow.
