

What is an ESG Report?
ESG Report vs. Sustainability Reporting vs. ESG Dashboard
An ESG report, sustainability reporting, and an ESG dashboard often use the same data, but they serve different jobs.
- An ESG report is the structured communication. It explains environmental, social, and governance performance for a defined period, audience, and reporting scope.
- Sustainability reporting is a broader term that often overlaps with ESG. It may focus more on long-term business impact, stakeholder responsibility, climate transition, social value, and sustainable development.
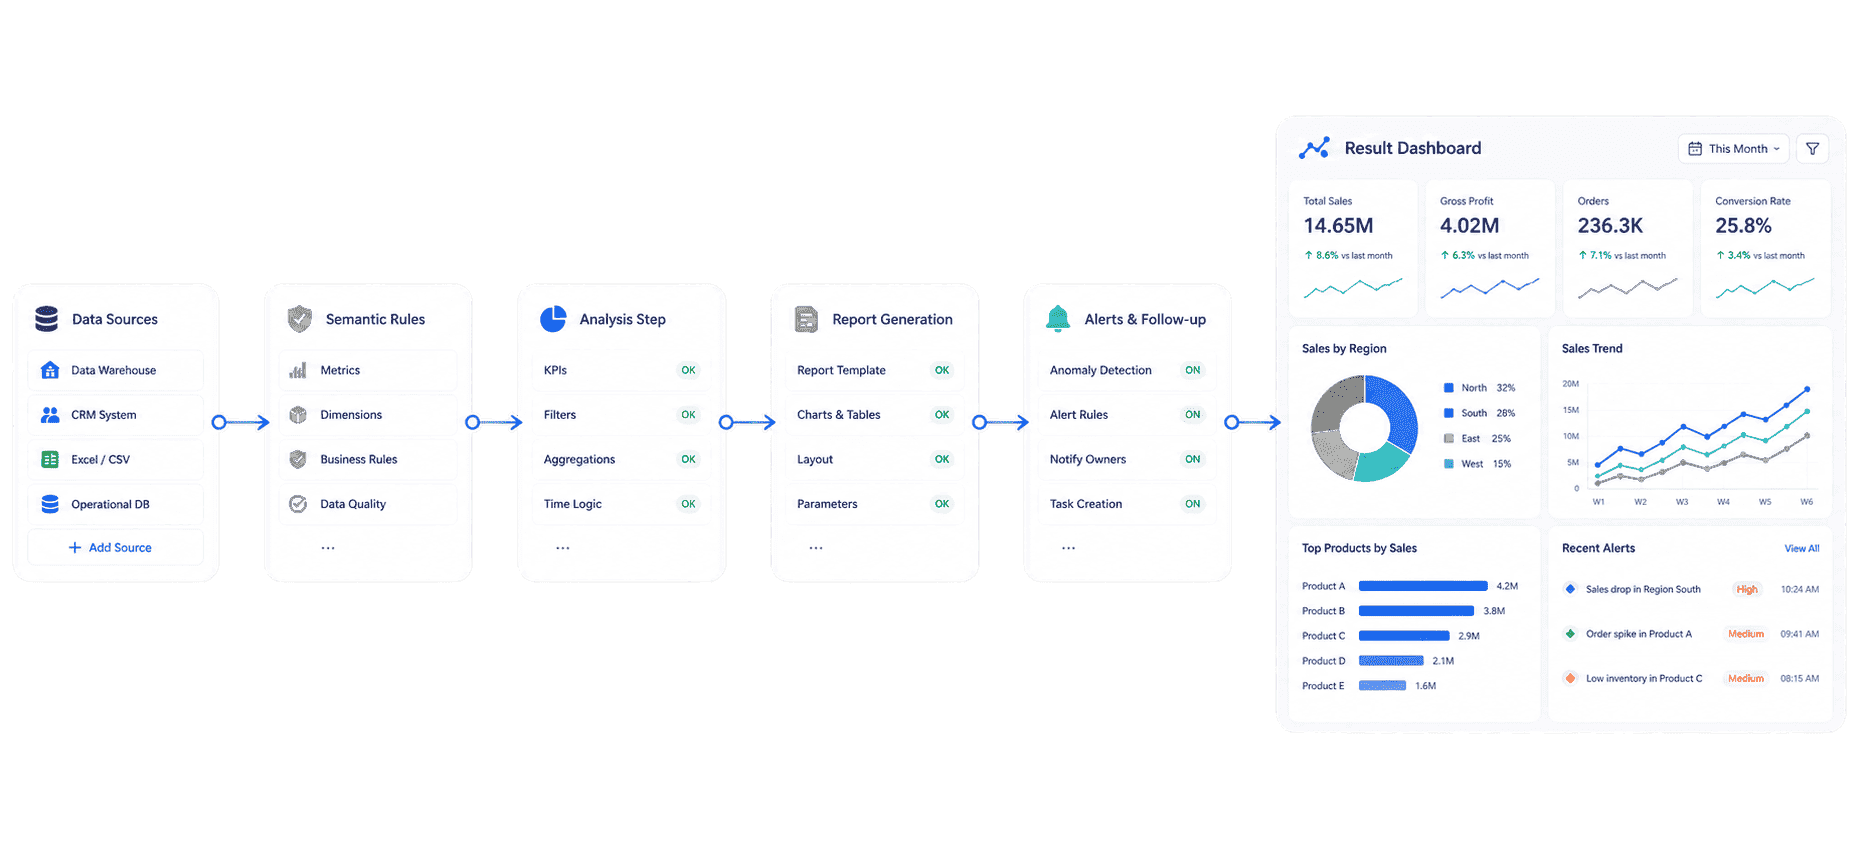
- An ESG dashboard is the working visual layer. It helps teams monitor energy, emissions, safety, suppliers, governance issues, and ESG targets before those numbers become part of a formal report.
This is also why an ESG report should not live alone. It usually connects to a broader report system, a financial report, operating dashboards, risk reviews, and department-level evidence.
Benefits of ESG Reports
An ESG report matters because ESG data is no longer only a communications task. It affects capital access, customer trust, supply chain qualification, regulatory readiness, risk management, and internal performance improvement.
A strong ESG report helps organizations:
- Create one version of ESG facts. Energy usage, greenhouse gas emissions, workforce data, supplier status, safety records, and governance events often sit in different systems. A report gives readers a shared reference point.
- Connect ESG topics to business decisions. ESG reporting becomes more useful when it explains cost exposure, operational risk, resilience, customer requirements, investor questions, and management action.
- Show progress against targets. Readers need to see baseline values, target years, current performance, variance, and whether progress is on track.
- Improve accountability. ESG metrics should have owners, review cadence, evidence requirements, and clear escalation paths.
- Prepare for changing requirements. ESG rules, standards, and customer questionnaires continue to change. A repeatable reporting process makes it easier to adapt without rebuilding everything each year.
- Reduce greenwashing risk. Clear definitions, evidence, and cautious language help prevent unsupported claims.
The best ESG report is not the longest one. It is the one that helps readers understand material topics, trust the data, and see the actions behind the numbers.
Don't just collect ESG data. Visualize what matters.
Download the KPI Dashboard Guide to strengthen your ESG report workflow:
- 10 essential steps to turn ESG goals into measurable KPI views
- How to choose charts for emissions, energy, safety, supplier, and governance data
- 15 dashboard templates for 2026 that can inspire clearer ESG reporting

ESG Report Standards and Frameworks
ESG report standards and frameworks help readers compare disclosures across companies, industries, and time periods. They also help writers avoid guessing what to include.
The most common frameworks serve different purposes:
1. GRI Standards
Main use
Impact reporting for a broad stakeholder audience
How it helps an ESG report
Helps explain how the organization affects the economy, environment, and people.
2. IFRS Sustainability Disclosure Standards / ISSB
Main use
Investor-focused sustainability-related financial disclosures
How it helps an ESG report
Helps connect sustainability risks and opportunities to financial relevance.
3. SASB Standards
Main use
Industry-specific disclosure topics and metrics
How it helps an ESG report
Helps choose metrics that investors often expect for a specific industry.
4. ESRS under CSRD
Main use
EU corporate sustainability reporting
How it helps an ESG report
Helps companies report under European sustainability requirements where applicable.
5. TCFD-style Climate Disclosure
Main use
Climate governance, strategy, risk management, metrics, and targets
How it helps an ESG report
Helps structure climate risk and transition discussion.
6. GHG Protocol
Main use
Greenhouse gas accounting
How it helps an ESG report
Helps calculate Scope 1, Scope 2, and Scope 3 emissions consistently.
7. UN Sustainable Development Goals
Main use
Voluntary alignment with global development goals
How it helps an ESG report
Helps connect ESG initiatives to broader social and environmental themes.
These frameworks are not interchangeable checklists. GRI is often used to explain broader impacts. ISSB is designed for investor-useful sustainability-related financial information. ESRS is tied to EU reporting requirements for companies in scope. SASB helps with industry-specific metric selection. The GHG Protocol is often used for emissions accounting rather than full ESG narrative structure.
Because rules and implementation timelines can change, treat this section as a learning map rather than legal advice. If your ESG report is tied to regulatory filing, assurance, or public-company disclosure, confirm requirements with legal, finance, sustainability, and audit professionals.
For deeper learning, pair this section with ESG reporting regulations, ESG data reporting, and environmental, social and governance reporting.
Metrics of ESG Reports
The metric set should follow the ESG report purpose. A manufacturing company may focus heavily on energy, emissions, water, safety, waste, and supplier risk. A software company may focus more on energy use, cloud emissions, data privacy, workforce diversity, ethics, and governance controls.
Use this list as a starting point, not a universal checklist.
Environmental
Common ESG report metrics
- Scope 1 emissions
- Scope 2 emissions
- Scope 3 emissions
- Emissions intensity
- Energy consumption
- Renewable energy share
- Water withdrawal
- Wastewater discharge
- Waste generated
- Recycling rate
- Environmental incidents
Useful context to include
- Boundary
- Calculation method
- Emission factors
- Baseline year
- Target year
- Facility coverage
- Data gaps
Social
Common ESG report metrics
- Employee headcount
- Turnover
- Diversity
- Training hours
- Injury rate
- Lost-time incidents
- Employee engagement
- Human rights due diligence
- Supplier labor risk
- Community investment
Useful context to include
- Workforce scope
- Region
- Job level
- Incident definitions
- Supplier coverage
- Survey method
Governance
Common ESG report metrics
- Board structure
- Board independence
- Ethics training
- Anti-corruption controls
- Whistleblowing cases
- Data privacy incidents
- Audit findings
- Risk management reviews
- Policy completion
Useful context to include
- Governance ownership
- Policy scope
- Investigation process
- Remediation status
- Oversight cadence
Cross-functional
Common ESG report metrics
- ESG targets
- Target progress
- Material topics
- Risk level
- Owner status
- Evidence completeness
- Assurance status
Useful context to include
- Target assumptions
- Review dates
- Responsible departments
- Confidence level
Metric quality matters more than metric quantity. A useful ESG report should show:
- Actual value: What is the current number?
- Comparison: How does it compare with baseline, target, previous period, or peer group?
- Business meaning: Why does the change matter?
- Cause or explanation: What likely drove the change?
- Action: What will the organization do next?
- Evidence: Which source supports the number?
If your ESG report uses many KPIs, consider building a supporting KPI dashboard. The dashboard can help teams monitor data throughout the year, while the ESG report explains the annual or quarterly story.
ESG Report Examples
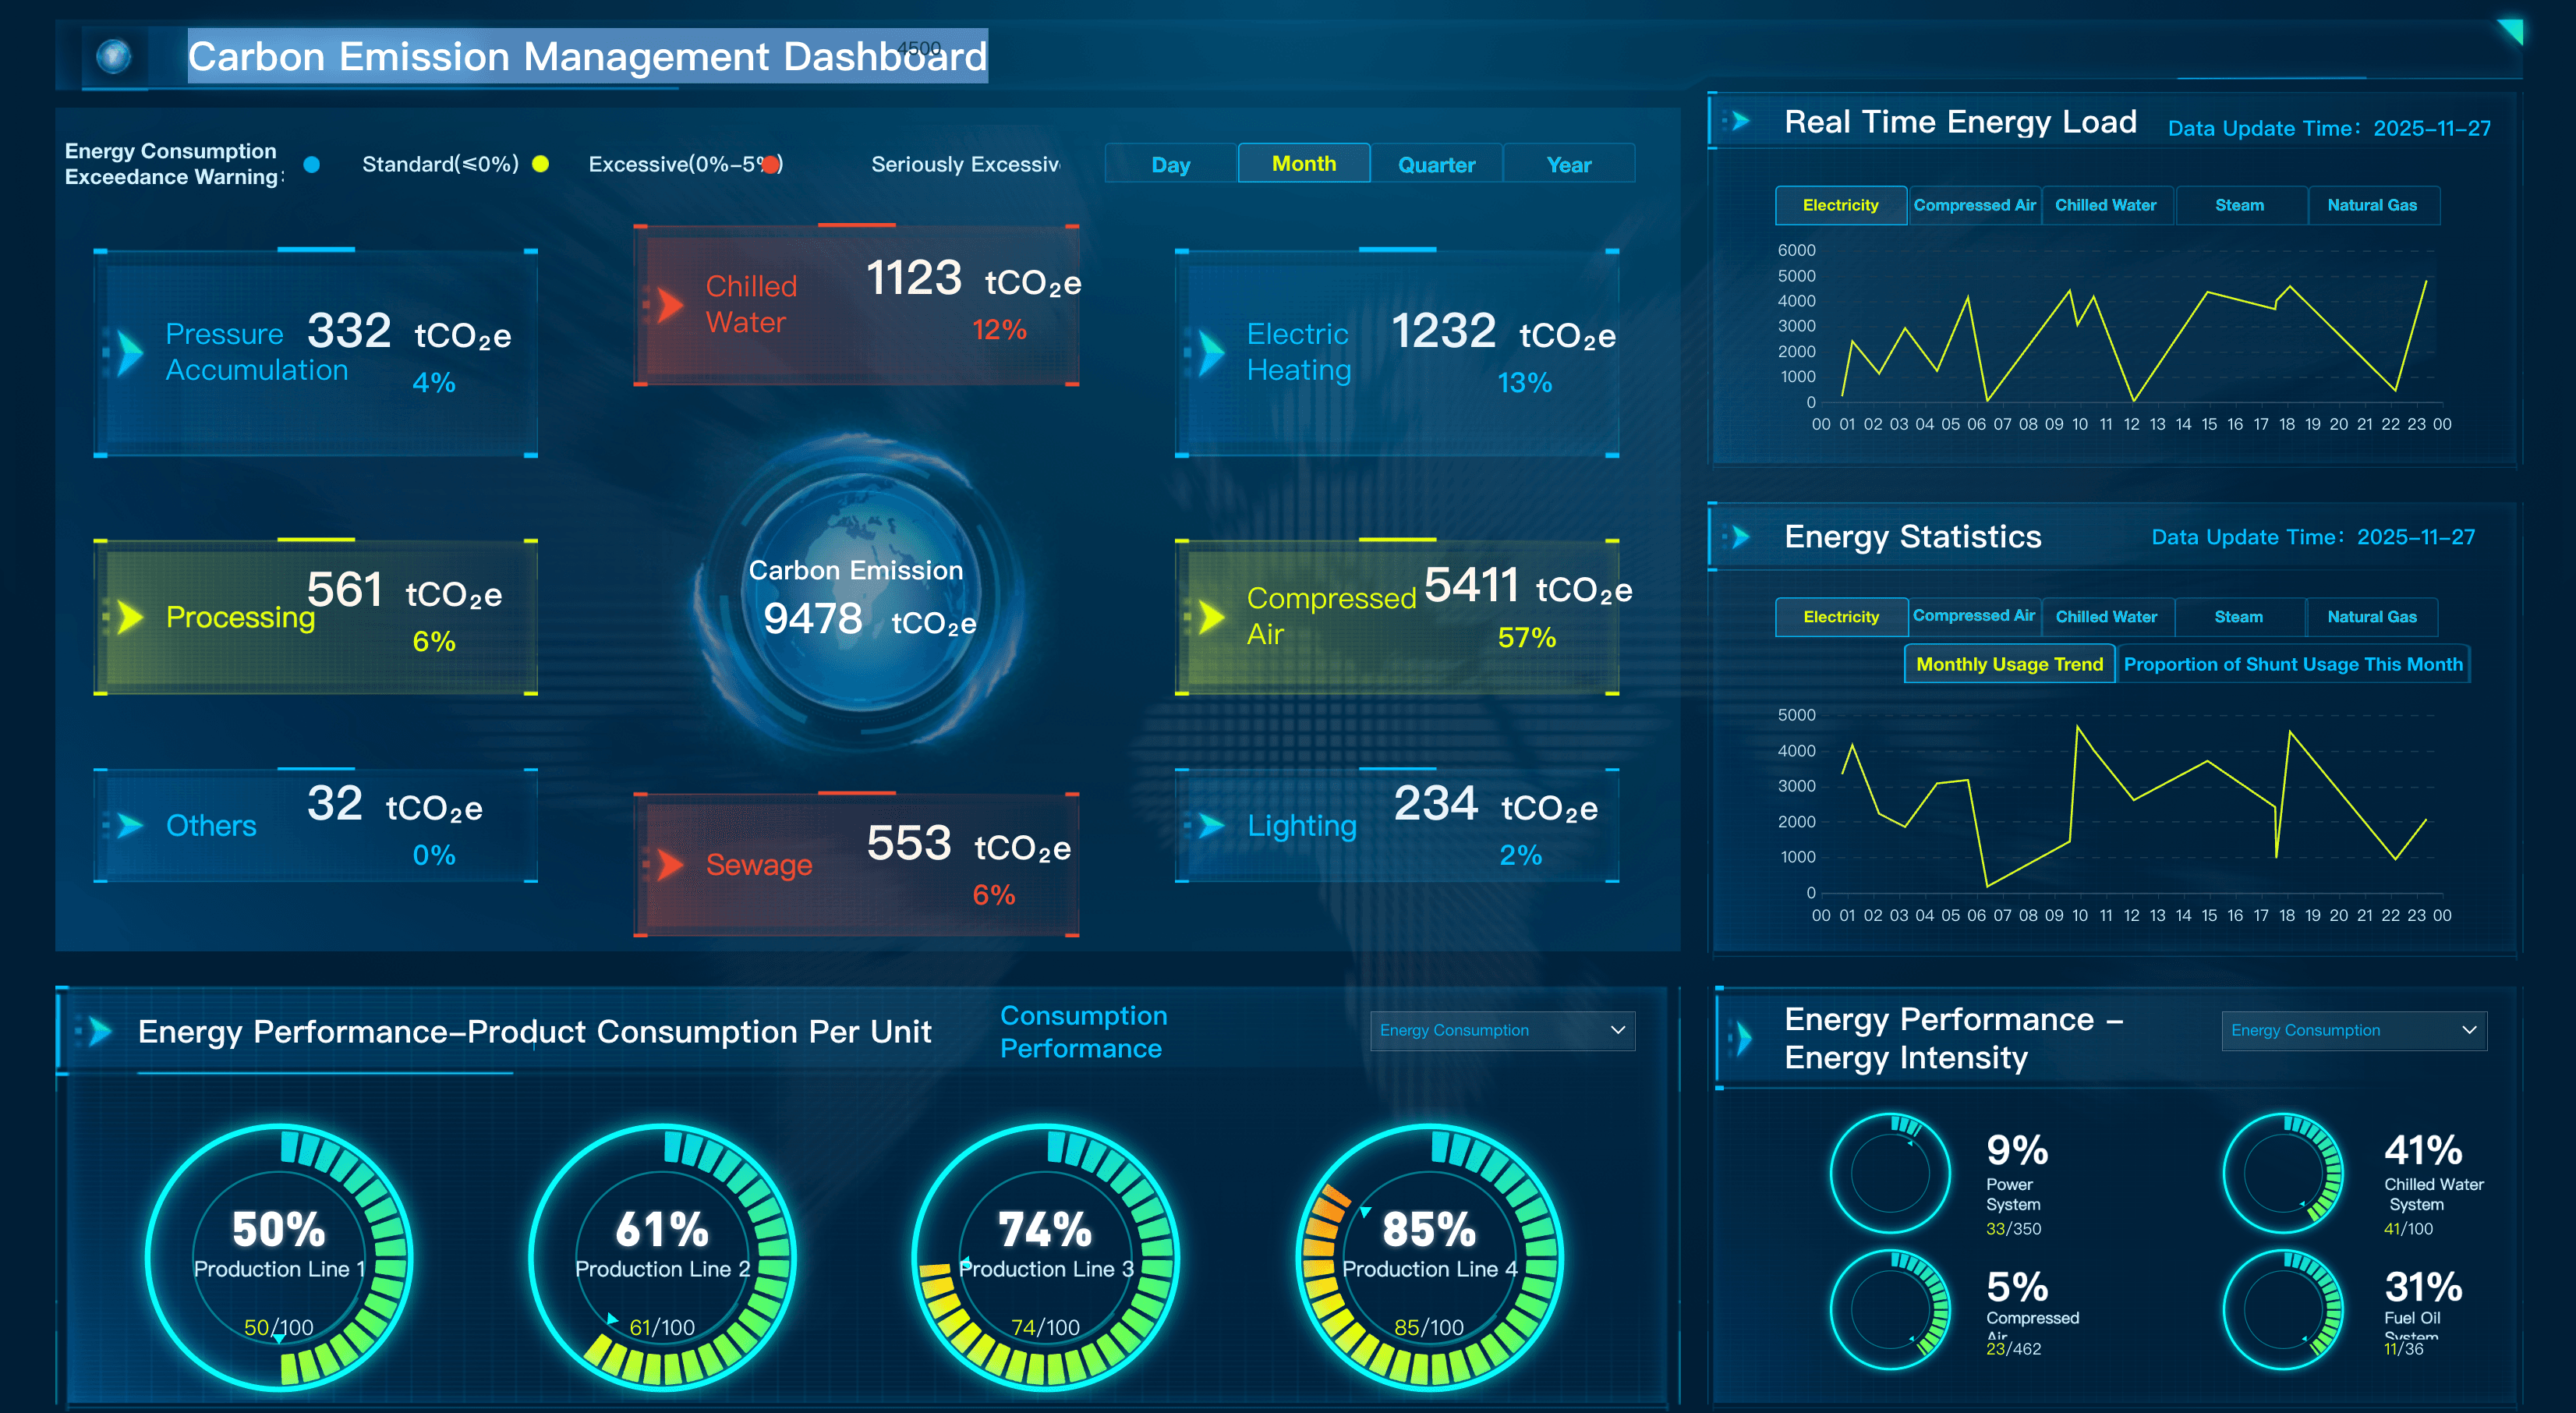
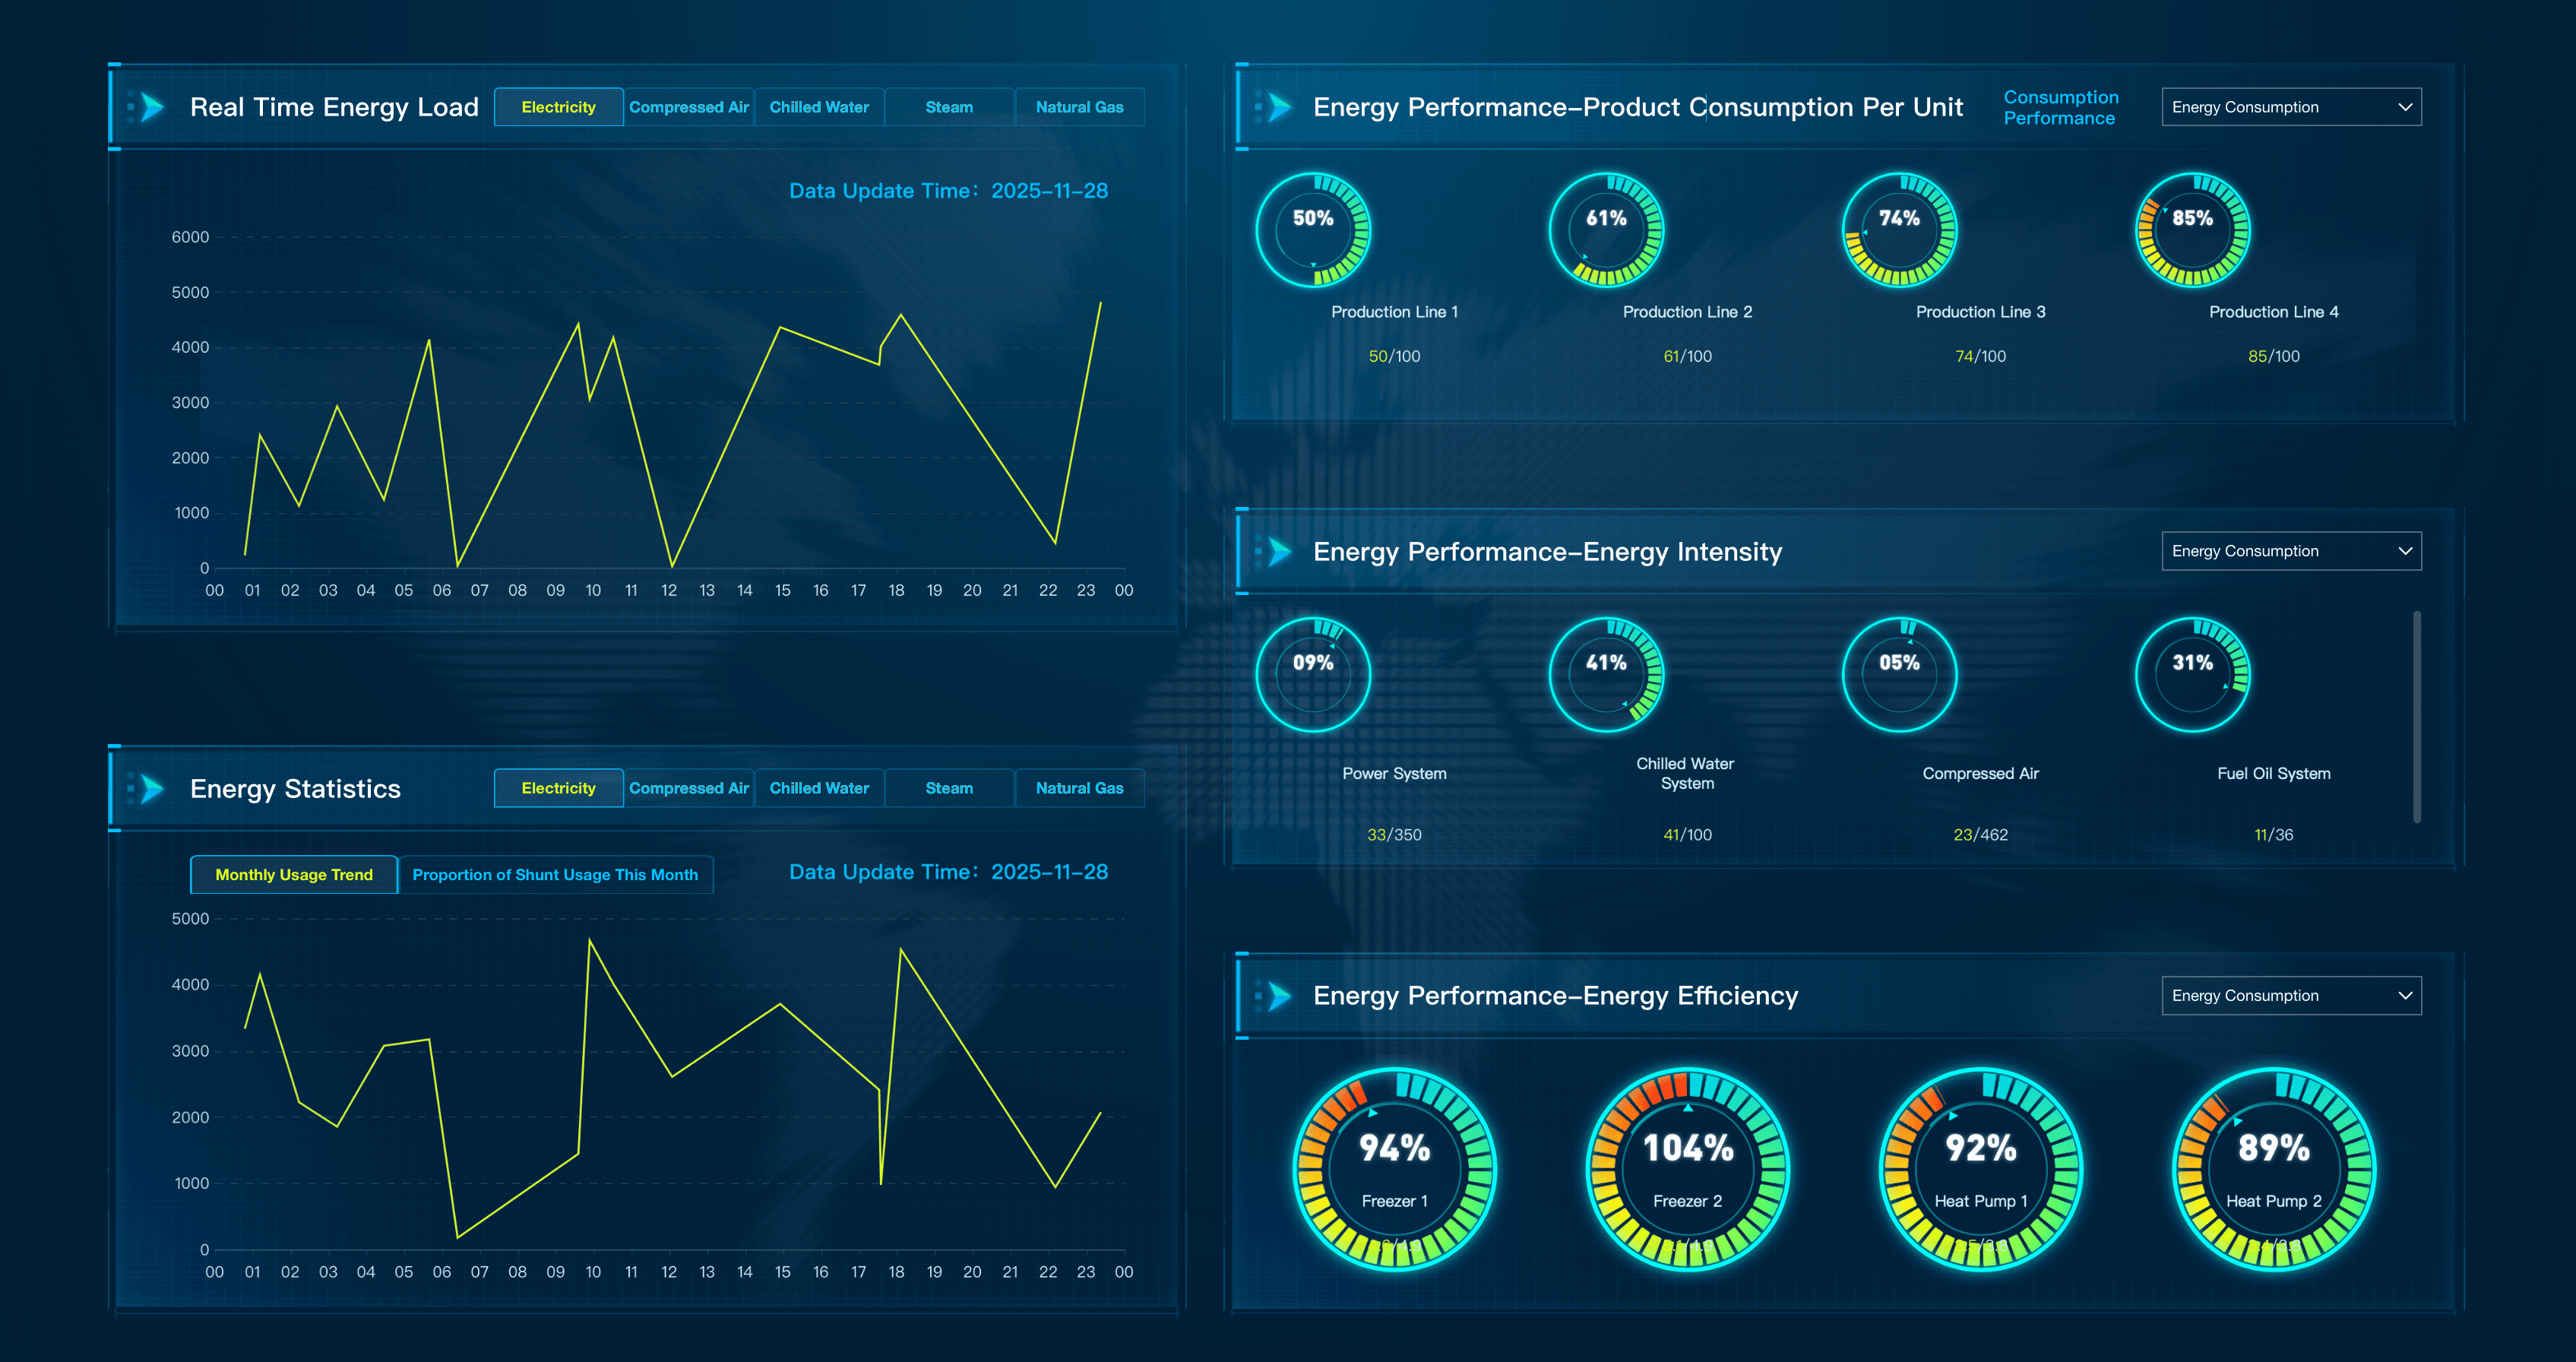
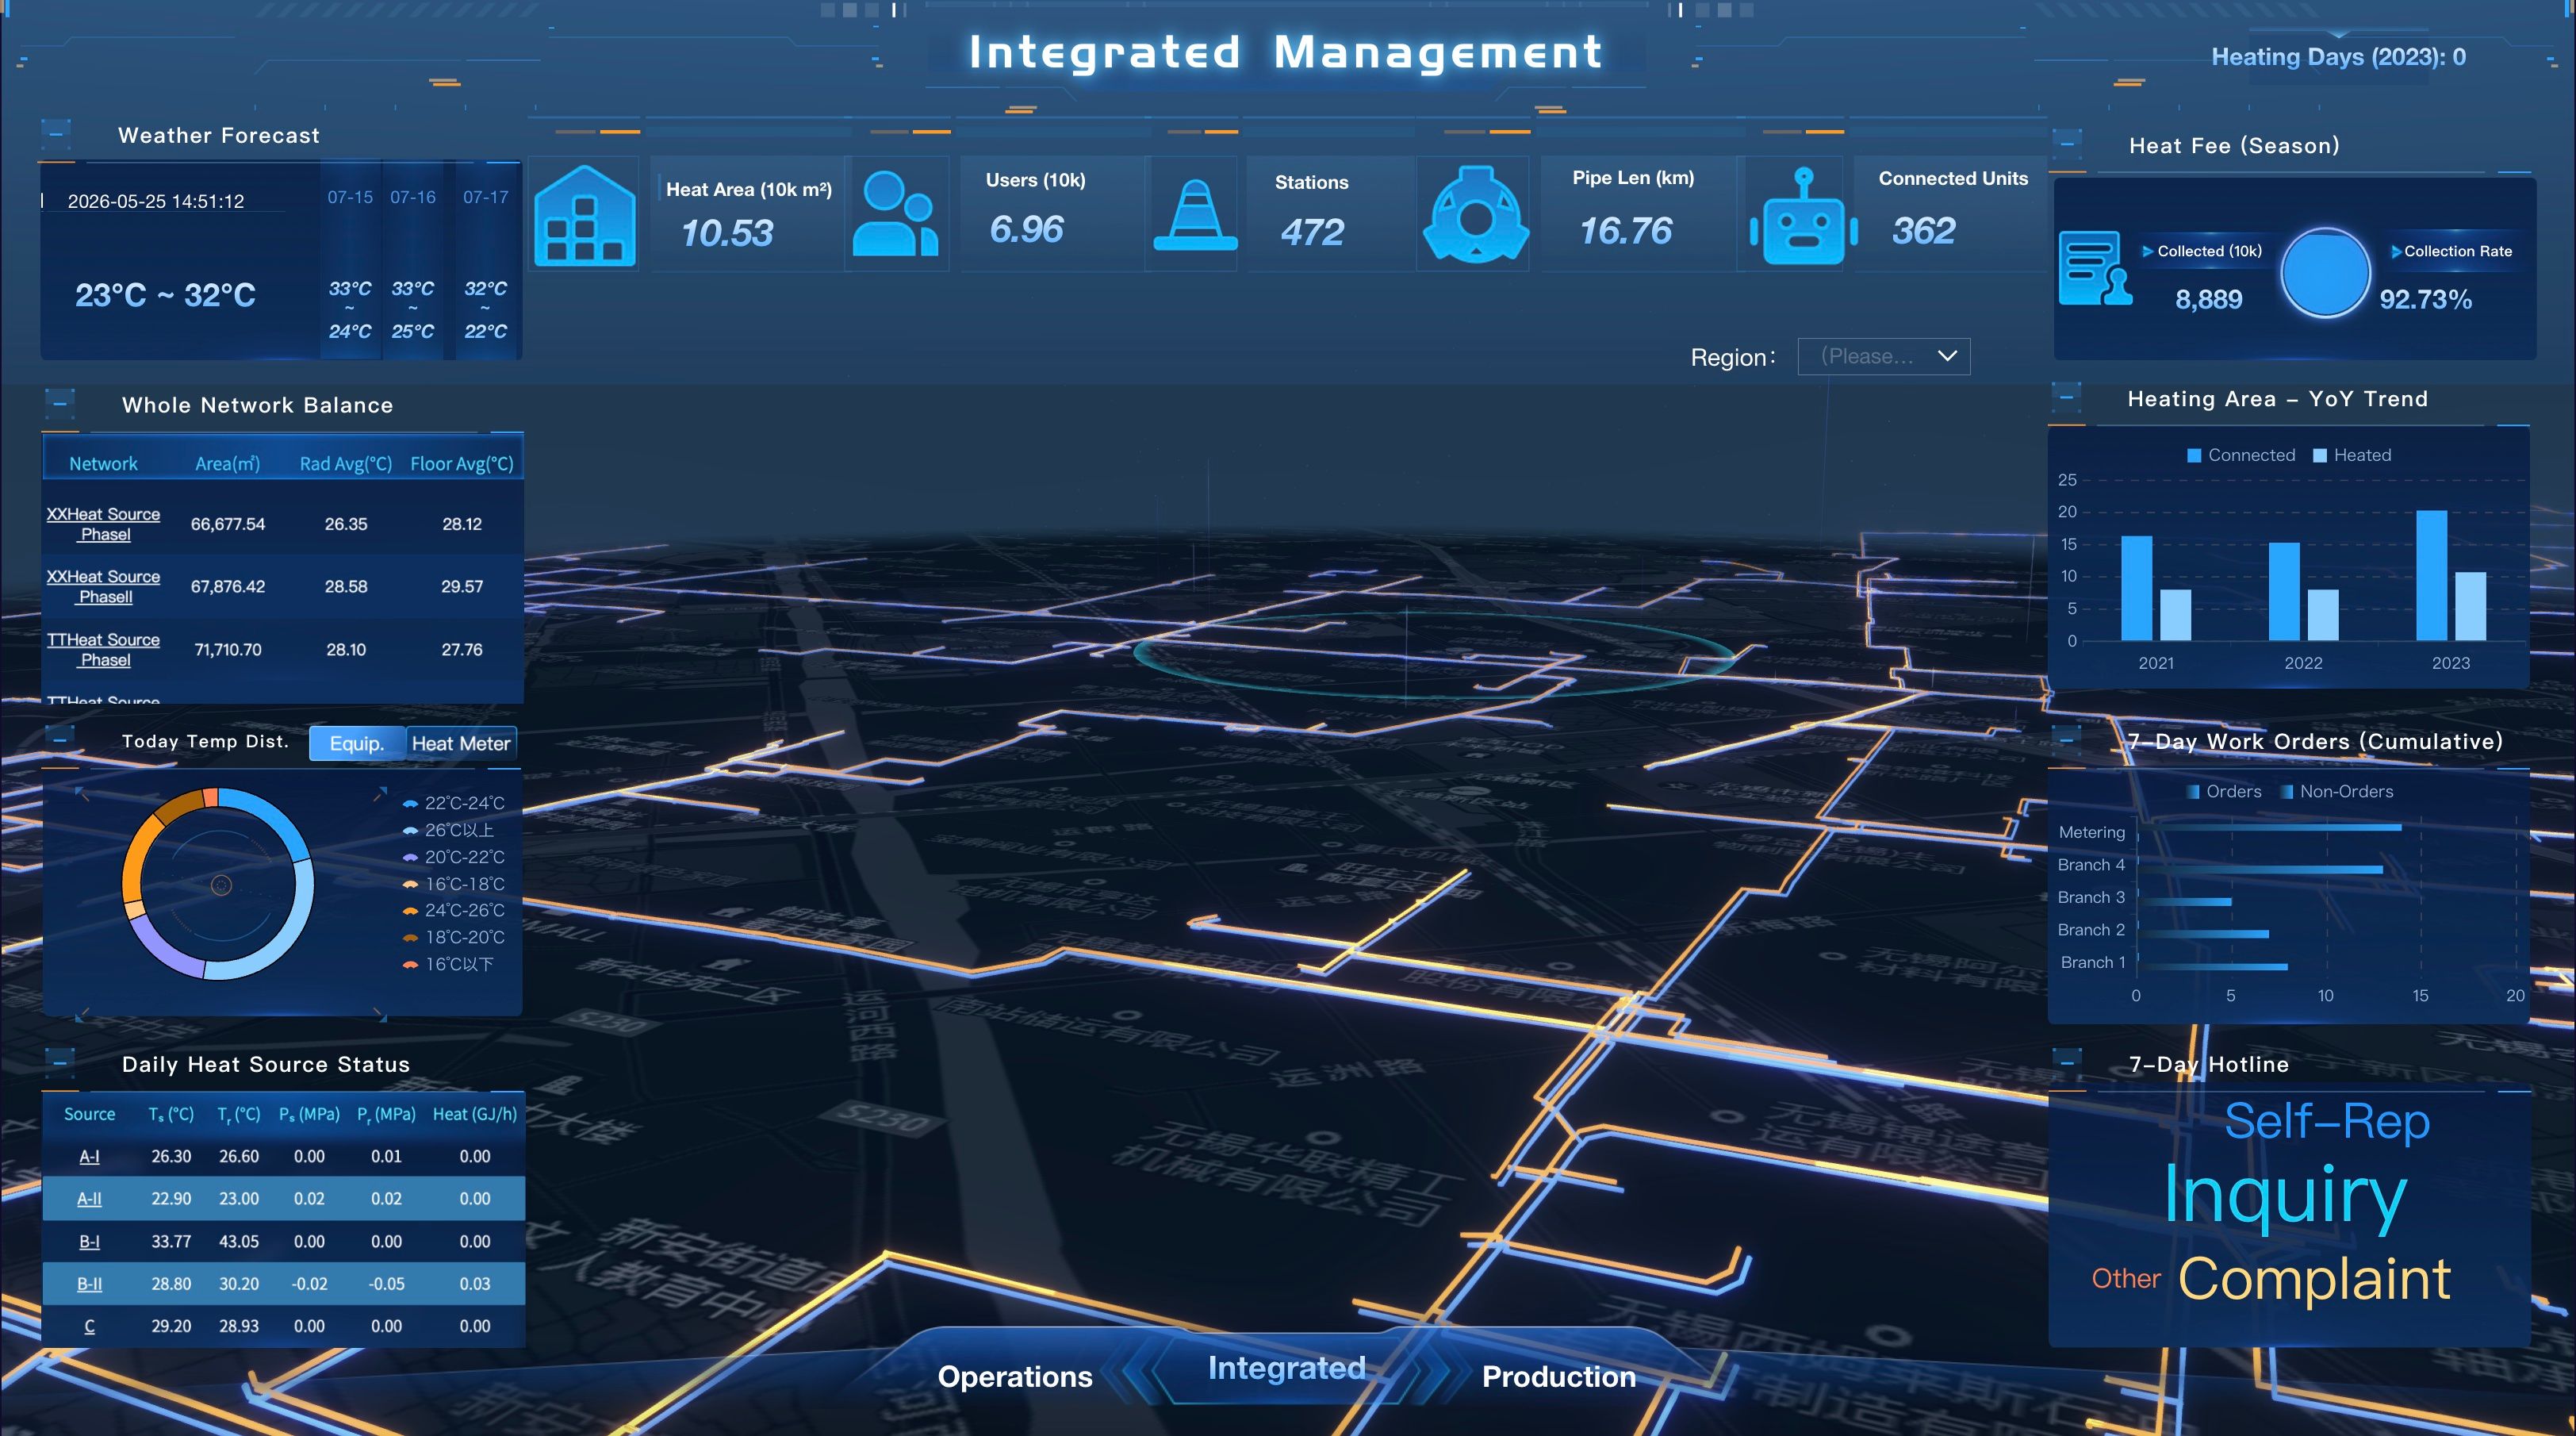
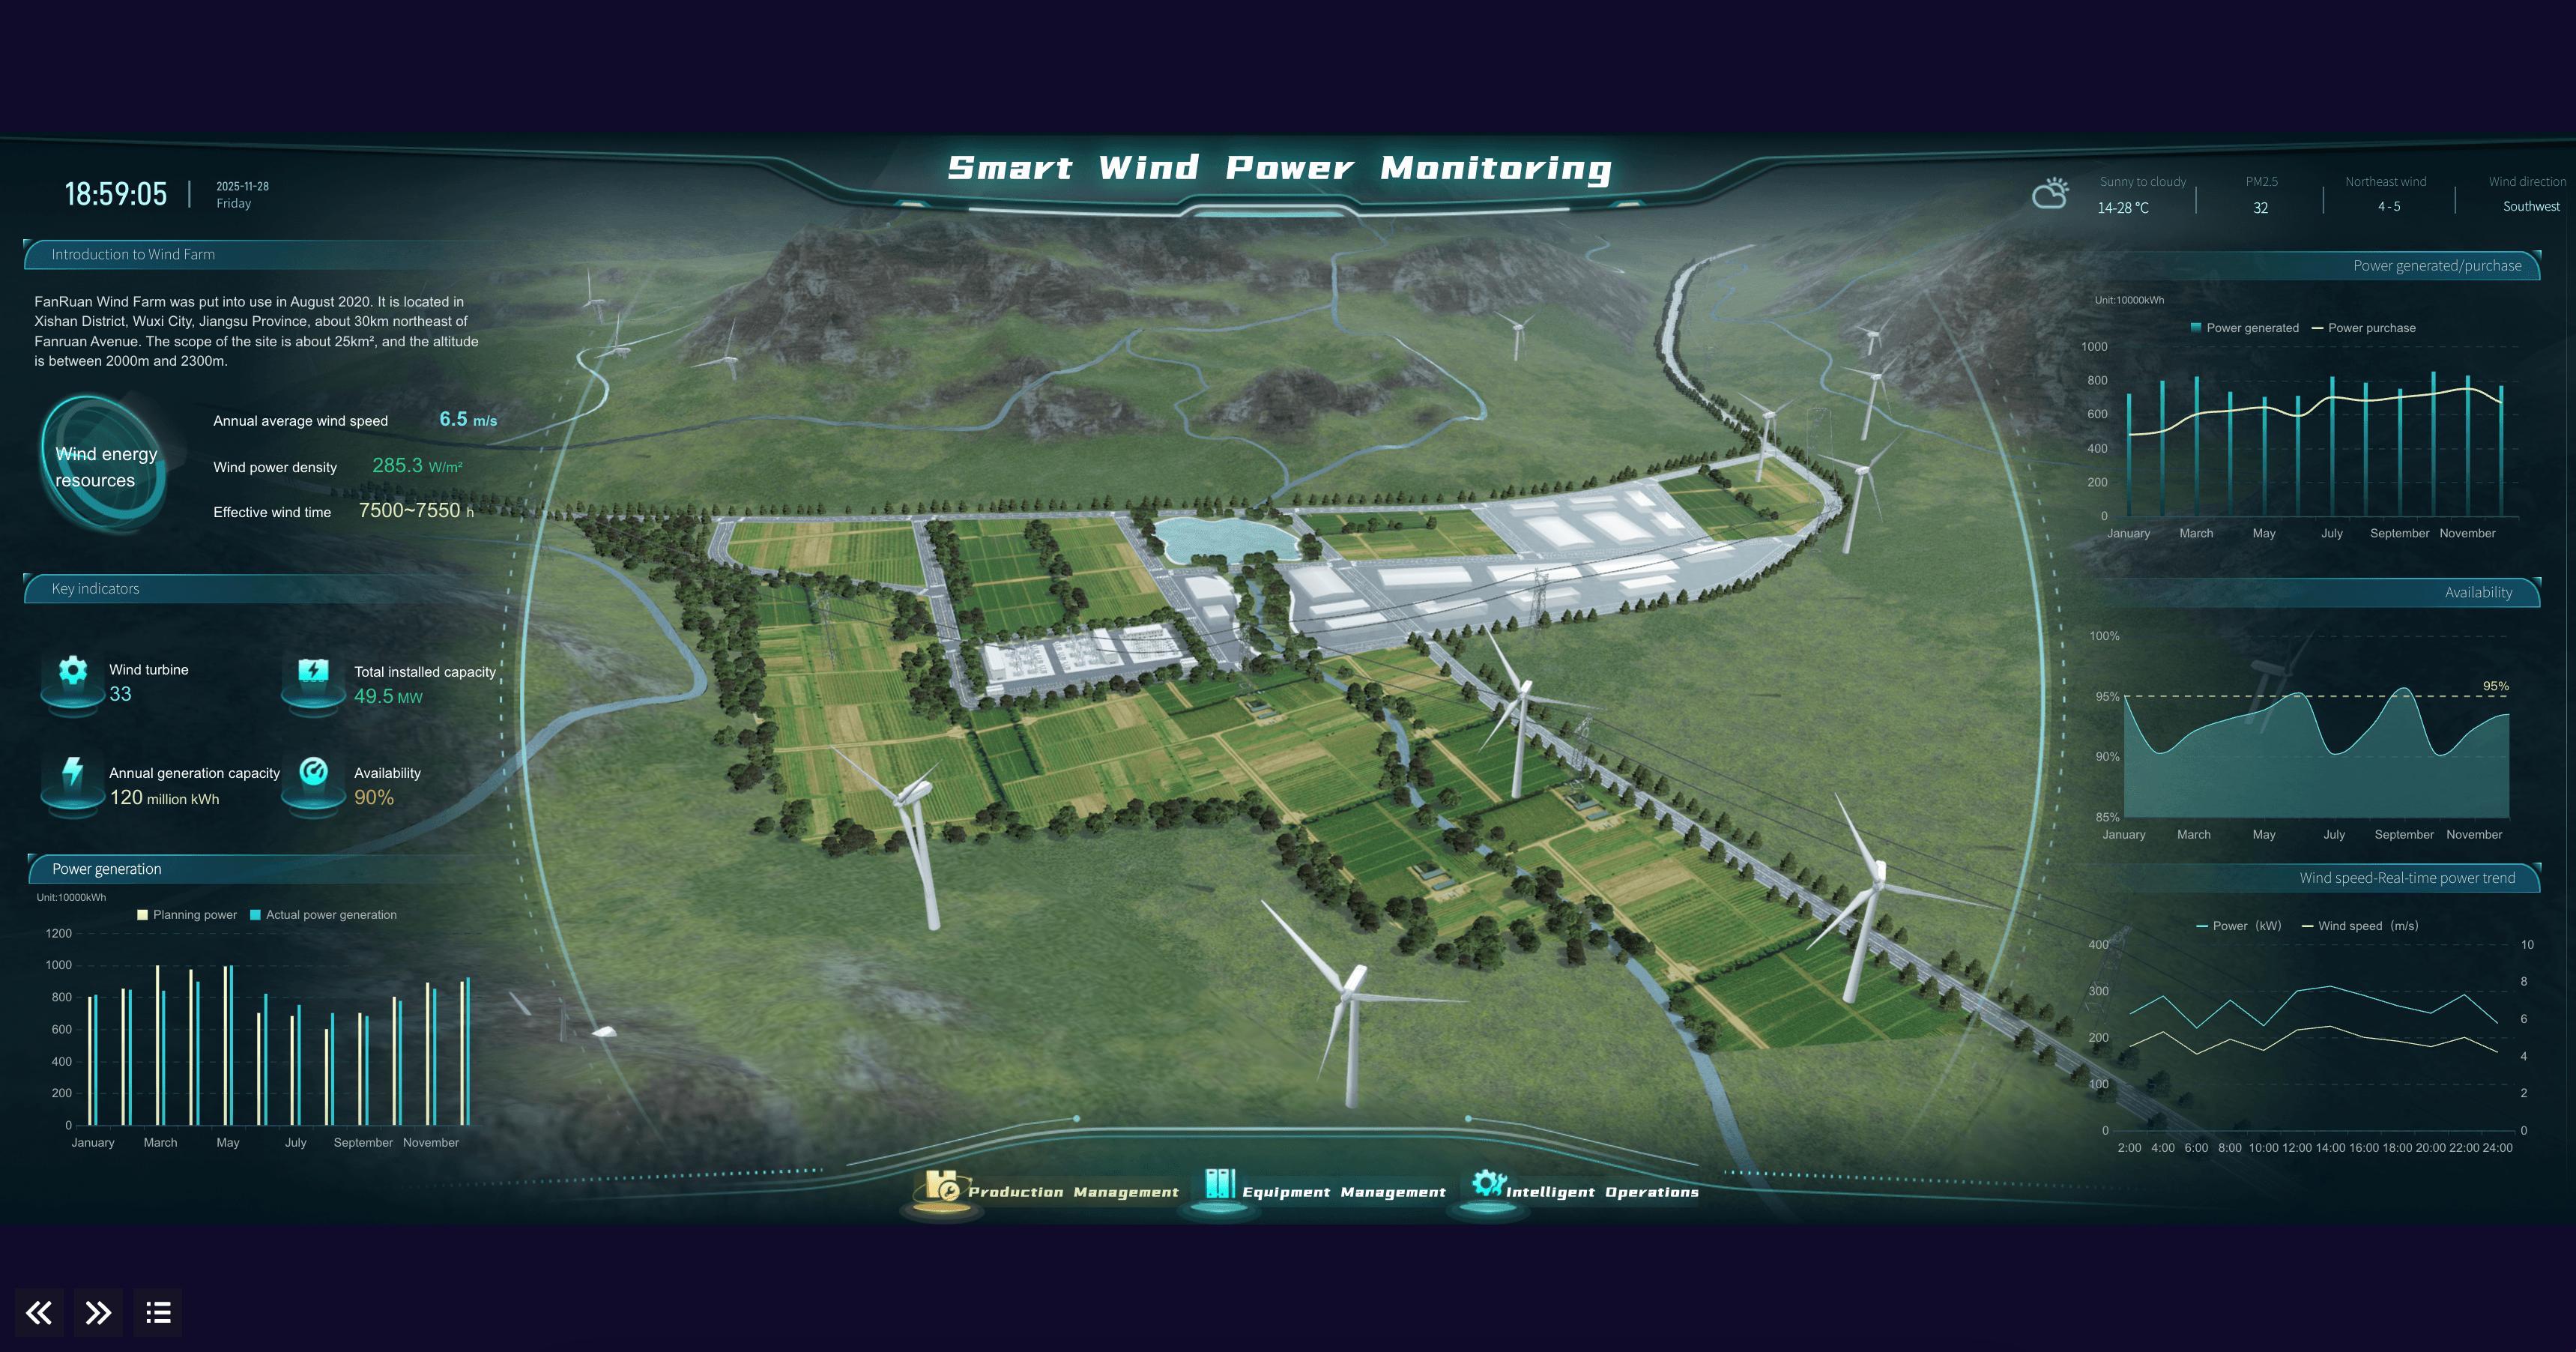
ESG reports become easier to plan when teams can see how ESG data might look in a working visual system. The examples below come from the FanRuan gallery and match common ESG report topics: emissions, energy, water, operational efficiency, supplier management, renewable energy, and supply chain risk.
Use these demos as learning material. Do not copy every chart. Study how each template groups metrics, shows trends, separates summary from detail, and makes exceptions visible.


Here is how to use these ESG report examples:
- Use the carbon emissions demo to study how emissions, energy efficiency, trend, and intensity metrics can be grouped.
- Use the energy management demo to plan views for facility consumption, renewable energy share, and resource optimization.
- Use the water and wastewater demos to understand environmental compliance, plant operations, and discharge quality monitoring.
- Use the procurement and supply chain demos to think about supplier risk, Scope 3 data collection, and value chain accountability.
- Use the wind power demo to explore renewable asset monitoring and clean energy performance.
For additional visual inspiration, compare these examples with sustainability dashboard, energy dashboard, and dashboard examples resources.
How to Create an ESG Report
An ESG report process should reduce repeated manual work while keeping human review. The goal is not to automate responsibility away. The goal is to make the reporting cycle easier to trust, repeat, and improve.
Use this ESG report workflow:
- Define the report purpose. Decide whether the report supports investor communication, customer requirements, regulatory readiness, internal governance, supplier evaluation, or executive management.
- Confirm the reporting boundary. List included entities, facilities, regions, business units, and time periods.
- Run a materiality assessment. Identify which environmental, social, and governance topics matter most to the organization and stakeholders.
- Map standards and disclosures. Decide which frameworks, questionnaires, or internal policies the report should align with.
- Build the metric dictionary. Define formulas, owners, units, data sources, calculation rules, and evidence requirements.
- Collect and validate data. Pull data from ERP, HR systems, EHS systems, energy meters, procurement systems, spreadsheets, and manual submissions. Check missing values and unusual changes.
- Analyze variance. Compare performance against baseline, target, previous period, and business activity drivers.
- Write the narrative. Explain what changed, why it changed, what is uncertain, and what actions are planned.
- Review and approve. Route sections to sustainability, finance, legal, operations, HR, procurement, and leadership reviewers.
- Publish and maintain. Keep source evidence, assumptions, definitions, and approval records so the next ESG report is easier.
For more detailed process guidance, see ESG reporting process. If your team is still evaluating systems, compare ESG reporting platforms, sustainability reporting software, sustainability reporting tools, and corporate sustainability reporting software.
ESG Report Data Management
ESG report data is difficult because it comes from many places. Finance data may already have strong controls. ESG data often depends on meters, invoices, facility logs, HR systems, EHS records, supplier questionnaires, procurement files, legal records, and spreadsheets.
Common ESG data challenges include:
- Scattered sources: Energy, water, waste, safety, workforce, supplier, and governance data often live in different systems.
- Inconsistent definitions: One site may define waste, incident, training completion, or supplier risk differently from another.
- Manual collection: Many ESG data points still arrive through email, spreadsheets, or local files.
- Unit conversion risk: Energy, fuel, water, emissions, and waste data may need unit conversion and factor-based calculation.
- Incomplete evidence: A number without source evidence is hard to review, assure, or explain.
- Late updates: ESG data can arrive after the management team has already drafted the report.
- Permission complexity: Some ESG data is sensitive, especially workforce, supplier, incident, and governance data.
A trustworthy ESG report data model should include:
Source System
What to define
- ERP
- HRIS
- EHS
- Procurement
- Utility bills
- Meters
- Surveys
- Spreadsheets
Why it matters Helps users trace where each number came from.
Metric Owner
What to define
- Sustainability
- Finance
- Operations
- HR
- Procurement
- Legal
- IT
Why it matters Makes review and correction accountable.
Formula
What to define
- Unit
- Numerator
- Denominator
- Exclusions
- Conversion factors
Why it matters Prevents different teams from calculating the same metric differently.
Reporting Boundary
What to define
- Entity
- Facility
- Region
- Department
- Supplier tier
Why it matters Makes the scope of the ESG report clear.
Evidence
What to define
- Invoice
- Meter reading
- Log
- Certification
- Policy
- Approval record
Why it matters Supports review, assurance, and confidence.
Refresh Cadence
What to define
- Monthly
- Quarterly
- Annual
- Ad hoc
Why it matters Matches data collection to the report cycle.
Permission Rule
What to define
- Who can view
- Edit
- Approve
- Export
- Publish
Why it matters Protects sensitive ESG data.
This is where data reporting and BI governance become practical. ESG reporting is not just about publishing a PDF. It is about building a repeatable data foundation that can survive questions from executives, customers, auditors, and regulators.
ESG Report With FineBI + Dora
FineBI + Dora can be introduced as a learning layer around ESG reporting rather than a hard-selling replacement for every ESG process.
FineBI can support the visual and analytical layer:
- Connect ESG data from ERP, HR, EHS, procurement, spreadsheets, facility systems, and other business sources.
- Build governed datasets for emissions, energy, water, waste, safety, workforce, supplier, and governance metrics.
- Create ESG dashboards, report pages, filters, drill-downs, and visual templates.
- Manage permissions for sustainability teams, executives, departments, regions, and facility owners.
- Keep recurring ESG report views easier to refresh and review.
Dora can support the question and workflow layer. As a data agent, dora can help users ask follow-up questions, retrieve existing FineBI assets, draft structured ESG report summaries, detect missing evidence, push owner-specific reminders, and summarize unresolved risks.
A practical learning path could look like this:
- Week 1: Define the ESG report question map. List the questions stakeholders ask most often: emissions progress, energy efficiency, water risk, safety, supplier compliance, governance incidents, and target status.
- Week 2: Build the ESG metric dictionary. Define formulas, owners, units, reporting boundary, source systems, refresh cadence, and evidence requirements.
- Week 3: Prototype the ESG dashboard layer in FineBI. Create summary views for environmental, social, governance, and cross-functional metrics.
- Week 4: Use dora for follow-up analysis. Ask why a metric changed, which facility or supplier contributed most, and which evidence is missing.
- Week 5: Create reusable reporting Skills. Turn repeated ESG tasks into governed workflows, such as monthly emissions briefing, supplier evidence follow-up, or safety anomaly summary.
- Week 6: Review with humans. Sustainability, finance, legal, operations, HR, and procurement teams review AI-generated summaries before anything becomes official report language.
The commercial reason this scenario can land in a real enterprise is simple: ESG reporting is recurring, cross-functional, evidence-heavy work. The practical package is scenario + product + service: choose a high-value ESG workflow, configure FineBI data assets and dashboards, set up dora Skills and permission rules, and help business owners adopt the review rhythm.
If your team is exploring AI-assisted analytics more broadly, related learning paths include enterprise AI agents, AI assistant for business, and AI agent workflow.
 Dora's Workflow
ESG Report Hub
This ESG report guide works best as a spoke inside a broader report learning hub. Use the hub to explain reporting as a category, then connect readers to specific report types and ESG subtopics.
Within the report cluster, ESG report naturally connects with business report, status report, marketing report, expense report, regulatory reporting, sustainability reporting, BI reporting, supply chain reporting, and CRM reporting. A finance team may start from a financial report, then add ESG cost and risk context. A sales team may use a sales report, then add customer ESG requirements or supply chain commitments. A sustainability team may start from ESG data reporting, then build a formal ESG report for external readers.
For dashboard-connected ESG reporting, pair this page with the dashboard hub, dashboard examples, dashboard design, KPI dashboard, ESG dashboard, sustainability dashboard, and energy dashboard resources.
FAQs
An ESG report is a structured document that explains a company's environmental, social, and governance performance. It usually includes material topics, metrics, targets, progress, risks, governance practices, methodology, and supporting data definitions.
An ESG report should include the reporting boundary, materiality assessment, ESG strategy, governance structure, environmental metrics, social metrics, governance metrics, targets, progress, methodology, assumptions, data limitations, and an index or mapping to relevant standards if applicable.
An ESG report is often a specific publication focused on environmental, social, and governance topics. Sustainability reporting is the broader process of collecting, analyzing, and communicating sustainability-related information. In practice, many organizations use the terms together because the content overlaps.
The right standards depend on audience, regulation, industry, and reporting goal. GRI is commonly used for impact reporting, ISSB standards support investor-focused sustainability-related financial disclosures, SASB helps with industry-specific metrics, ESRS applies to companies in scope of EU CSRD rules, and the GHG Protocol supports emissions accounting.
Many companies publish an annual ESG report, but internal ESG dashboards and management updates may refresh monthly or quarterly. The cadence should match stakeholder needs, regulatory obligations, data maturity, and management review rhythms.
Parts of an ESG report can be automated, including data collection, metric calculation, dashboard refresh, variance detection, evidence tracking, and scheduled briefings. Human review is still needed for materiality, interpretation, legal language, assurance, and final publication decisions.
FineBI can support ESG data modeling, dashboards, permissions, and visual analysis. dora can help users ask questions over trusted BI assets, generate draft summaries, detect missing evidence, push owner follow-ups, and prepare recurring ESG briefings for human review.
