
What is a Business Report?
Business Report vs. Dashboard vs. BI Report
A business report, a dashboard, and a BI report often use the same data, but they serve different reading habits.
- A business report is built for explanation. It usually has a defined audience, a reporting period, a narrative structure, supporting charts, and recommended actions. It helps readers understand what happened, why it happened, and what should happen next.
- A dashboard is built for monitoring. It gives users a visual way to track metrics, spot exceptions, filter data, and drill into detail. A dashboard is useful when readers need frequent visibility.
- A business intelligence report connects reporting to governed data, self-service analysis, permissions, and repeatable metric definitions. It is useful when teams need reporting that can scale beyond manual spreadsheets.
Use a business report when the reader needs context and accountability. Use a dashboard when the reader needs ongoing visibility. Use BI reporting when the organization needs both reliable data and flexible analysis.
A simple example:
1. Review Quarterly Performance with Executives
Best format
Business Report
Why
Combines KPI results, variance explanations, risks, and recommendations.
2. Track Daily Sales Pipeline
Best format
Dashboard
Why
Shows live or scheduled updates for frontline decisions.
3. Explore Data by Region, Product, and Team
Best format
BI Report
Why
Provides governed metrics with interactive analysis.
The strongest reporting systems often use all three. A dashboard reveals the signal, a business report explains the story, and a BI layer keeps the data consistent.
Why Business Reports Matter
Business teams already have spreadsheets, slides, dashboards, chat updates, and system exports. The problem is not a lack of information. The problem is that information often arrives without structure.
A well-written business report helps teams:
- Clarify the decision. A report should begin with the question it is trying to answer: Are we on track? Why did margin change? Which region needs attention? Should we expand this program?
- Create one version of the facts. A report can document data sources, metric definitions, reporting periods, assumptions, and known limitations.
- Connect numbers to causes. A chart can show revenue dropped. A business report should explain whether the driver was volume, price, product mix, churn, seasonality, supply, or data quality.
- Support accountability. Recommendations should include owners, deadlines, expected impact, and follow-up metrics.
- Preserve institutional memory. When decisions are recorded in a report, new team members can understand what was decided and why.
This is why a business report remains useful even when a company already uses dashboards. Dashboards help people watch the business. Reports help people explain and decide.
Don’t just collect data. Visualize what matters.
Download the KPI Dashboard Guide to strengthen your business report workflow:
- 10 essential steps to turn business goals into measurable KPI views
- How to choose charts that make business reports easier to read
- 15 dashboard templates you can study before building your next report

Types of Business Report
There is no single business report format that fits every situation. The right format depends on the reader, the decision, the time period, and the level of detail required.
Executive business report
An executive business report summarizes company performance, strategic priorities, risks, and decisions for senior leaders. It usually combines financial outcomes, customer signals, operations, people metrics, and major initiatives. Keep the first layer concise. Put supporting evidence in drill-down charts, appendices, or linked dashboards.
Financial business report
A financial report explains revenue, cost, profit, cash flow, budget variance, financial risk, and business outlook. It may include financial statements, management commentary, variance analysis, and forecast assumptions.
Sales business report
A sales report tracks revenue, pipeline, quota attainment, win rate, deal velocity, forecast accuracy, territory performance, and sales team activity. The best sales reports separate activity from outcomes so leaders can see whether the team is busy, effective, or blocked.
Marketing business report
A marketing report connects campaigns, channels, traffic, leads, conversion, cost, and revenue contribution. It should avoid vanity metrics unless they clearly connect to demand, pipeline, retention, or customer value.
Operational business report
An operational business report focuses on process health. It may cover fulfillment, production, inventory, procurement, service quality, delivery, SLA performance, or resource usage. Operations reports are strongest when they highlight exceptions, bottlenecks, and cost drivers.
Status business report
A status report tracks progress against a plan. It is useful for projects, transformation programs, department priorities, and cross-functional initiatives. Include current status, completed work, blockers, next milestones, owners, and decisions needed.
ESG and compliance business report
An ESG report, sustainability update, or compliance report documents performance against environmental, social, governance, regulatory, and risk requirements. These reports need strong data lineage because readers must trust both the numbers and the definitions behind them.
Expense business report
An expense report records spending, reimbursement, budget usage, policy exceptions, and cost patterns. For managers, expense reporting can reveal where budgets are drifting and where approval rules need attention.
Analytical business report
An analytical report investigates a question in depth. It compares segments, identifies patterns, tests explanations, and recommends next steps. Use this format when the main job is not to summarize, but to diagnose.
Examples and Templates
Business reports become easier to plan when you can see what the final decision space might look like. The examples below come from the FanRuan gallery and match common business report use cases: executive review, finance, sales, marketing, procurement, HR, retail operations, and budget control.
Use these demos as learning material. Do not copy every chart. Study how each template groups metrics, handles visual hierarchy, and connects summary views to detail.
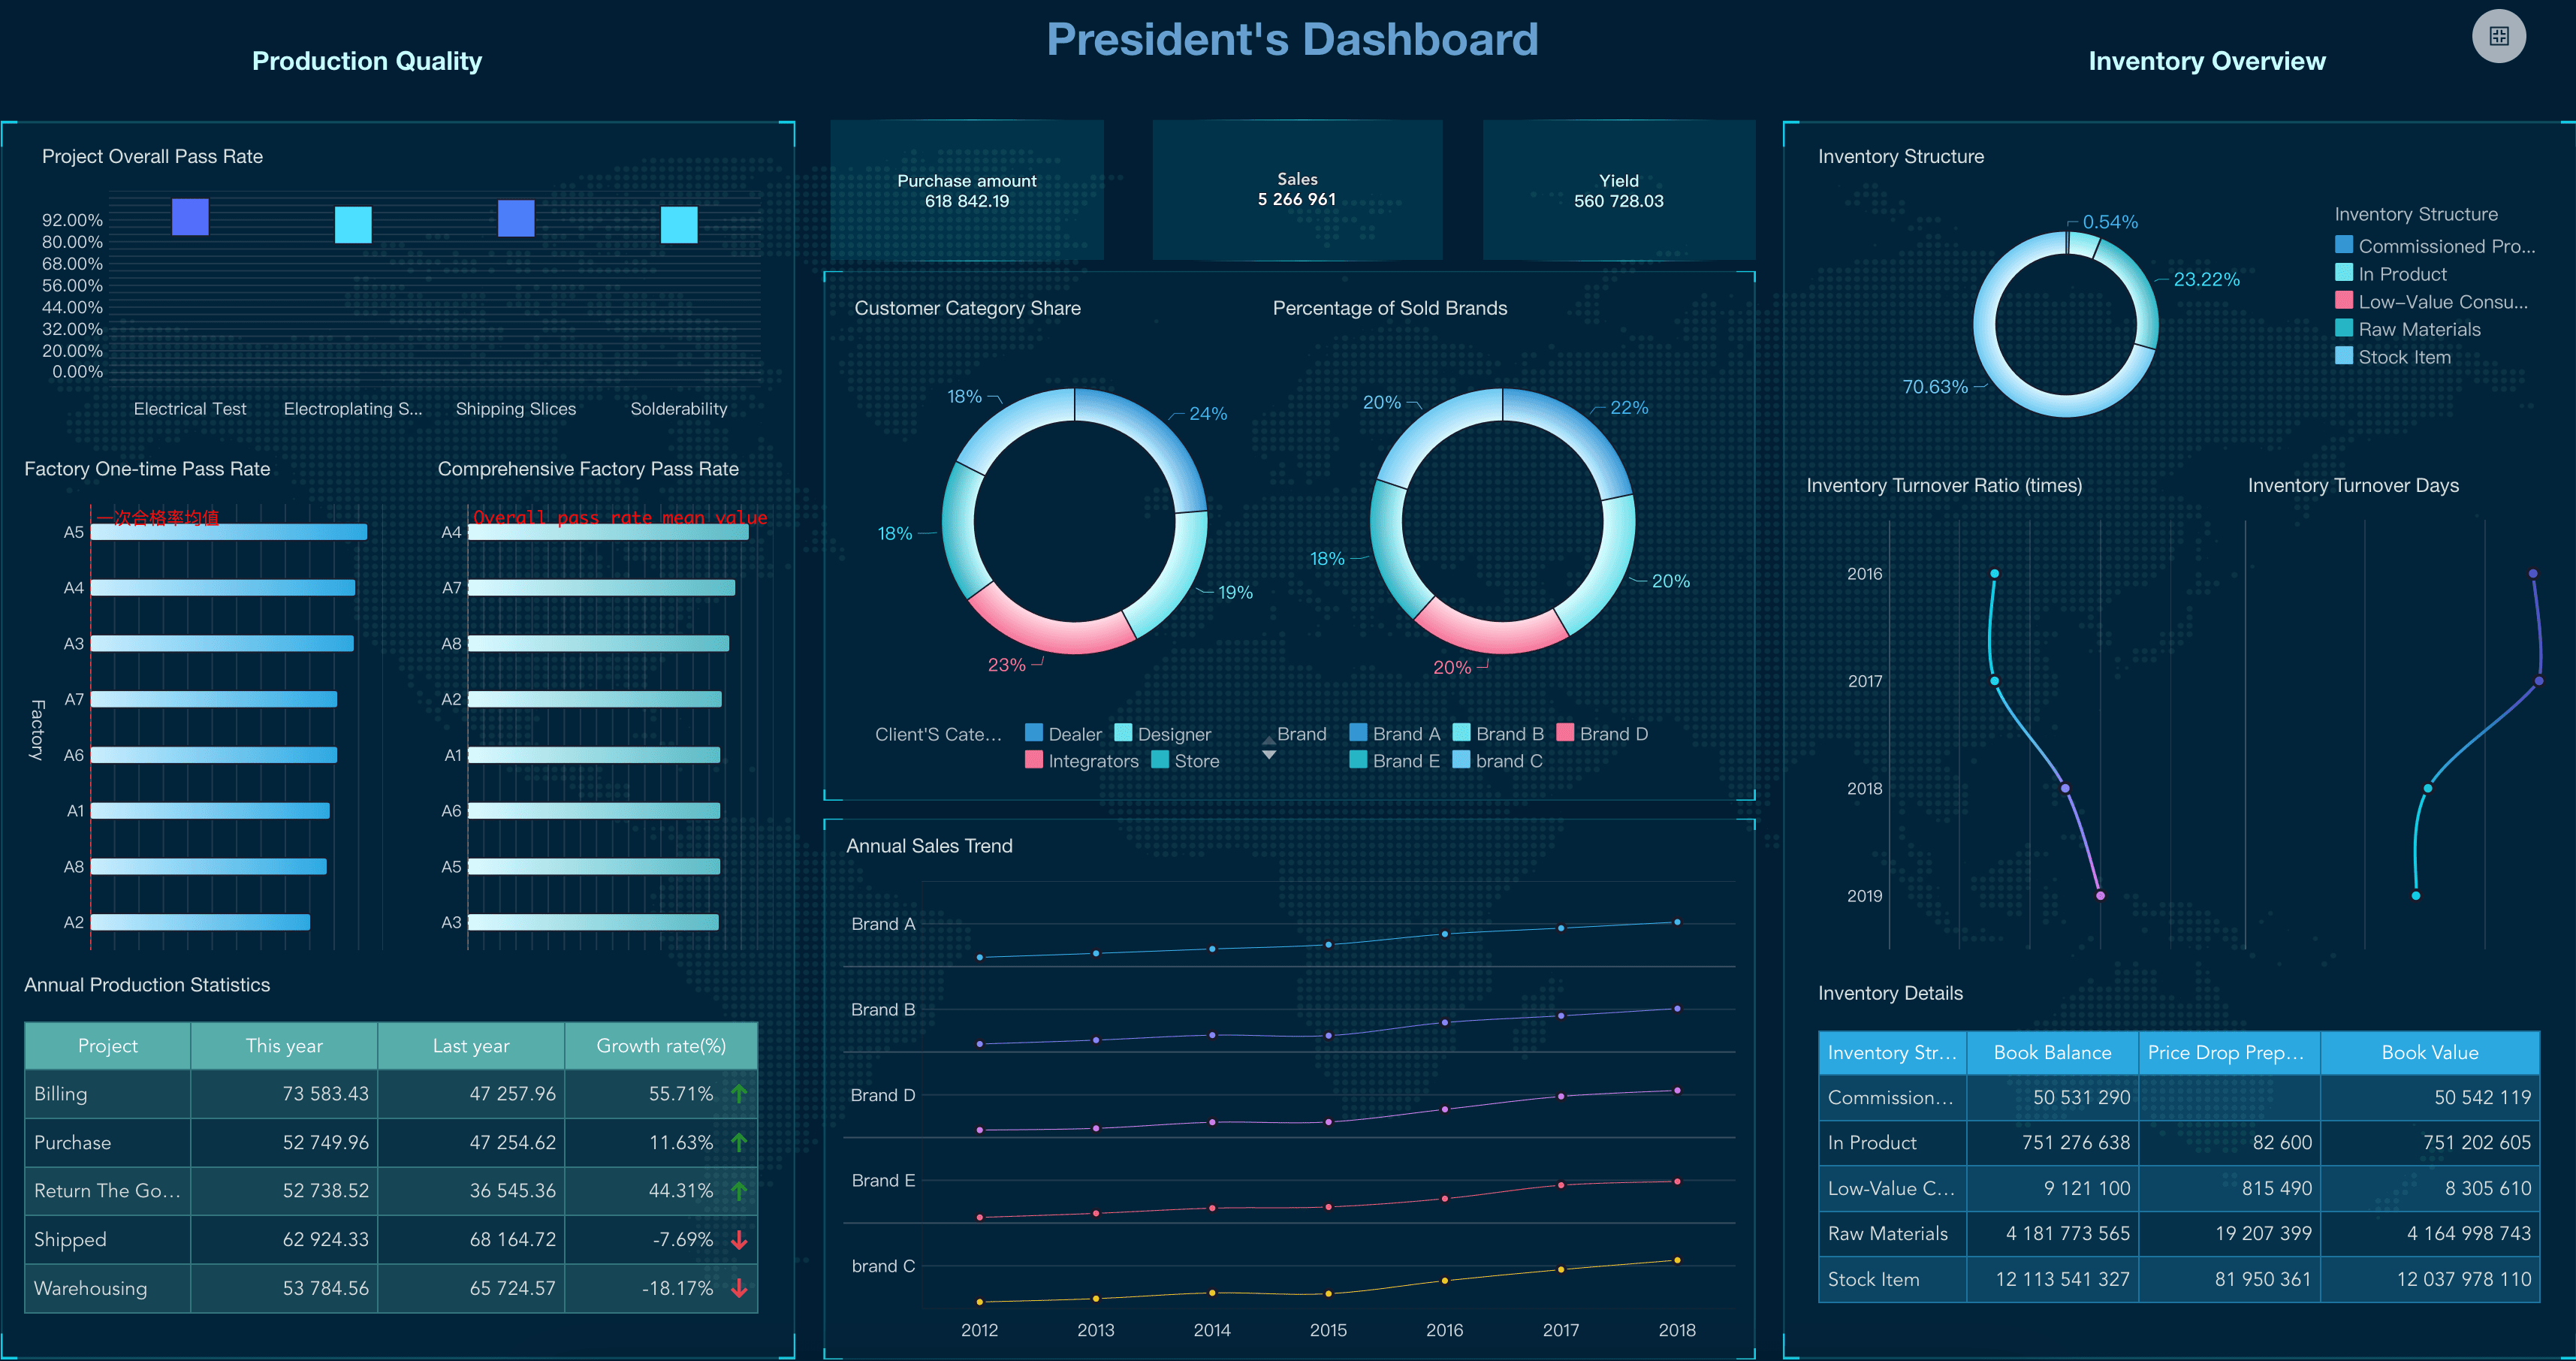
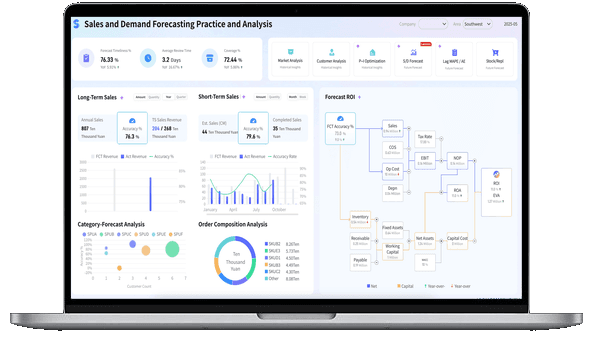
Executive Dashboard
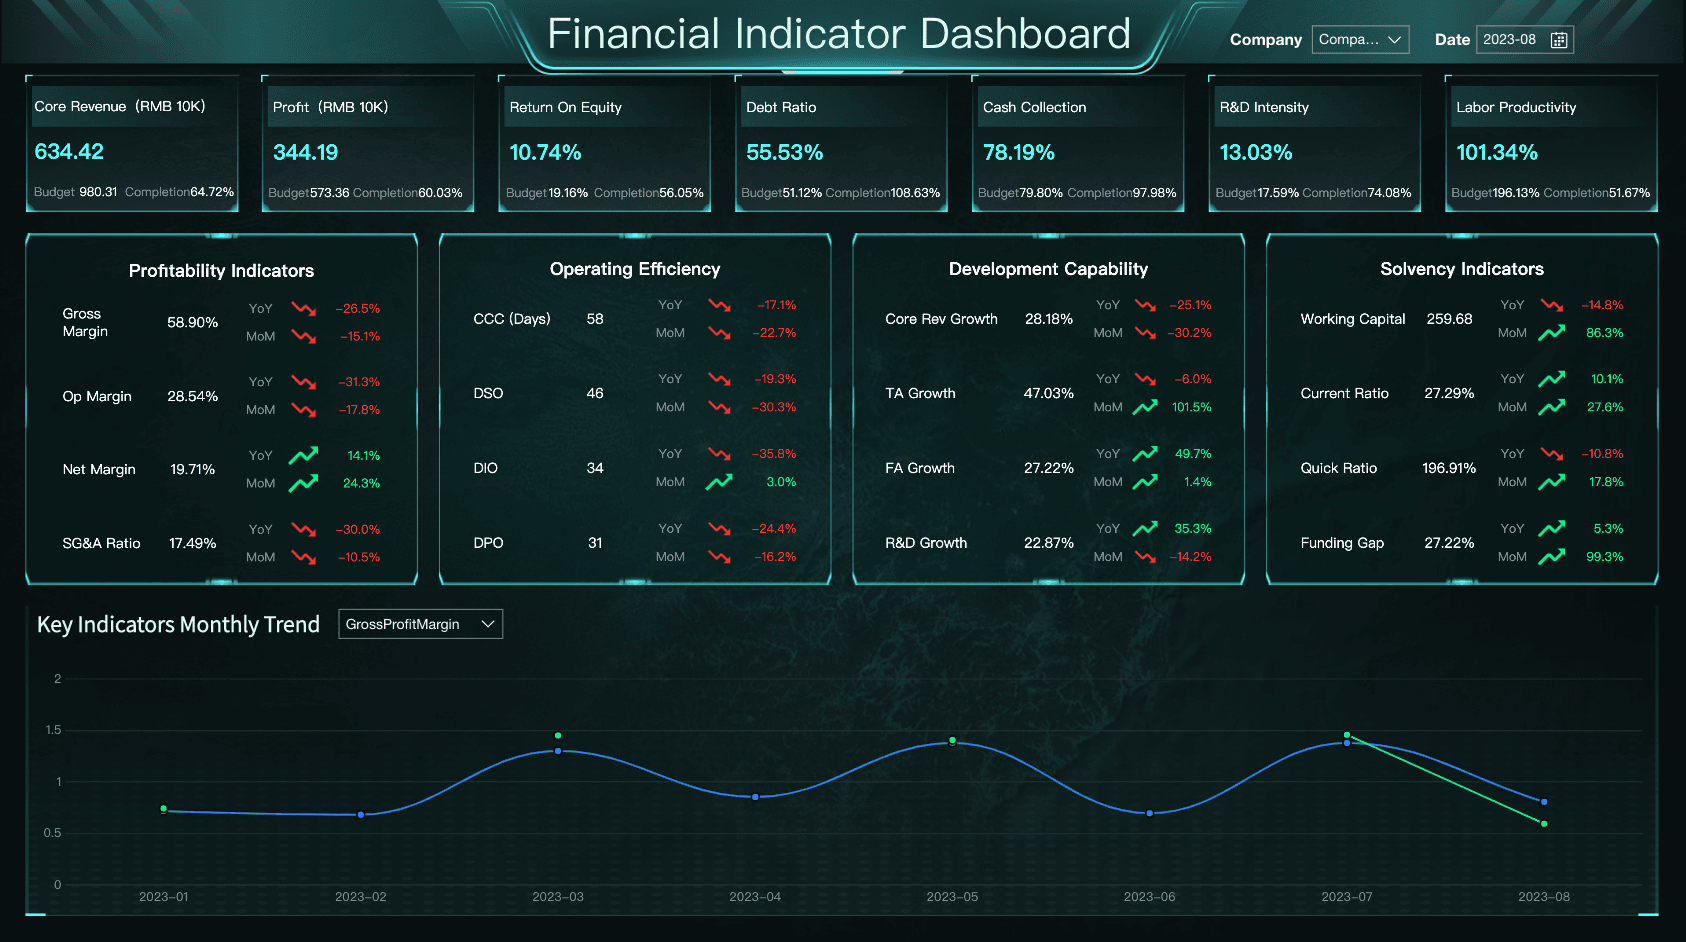
Financial Metrics Dashboard

Budget Control Dashboard
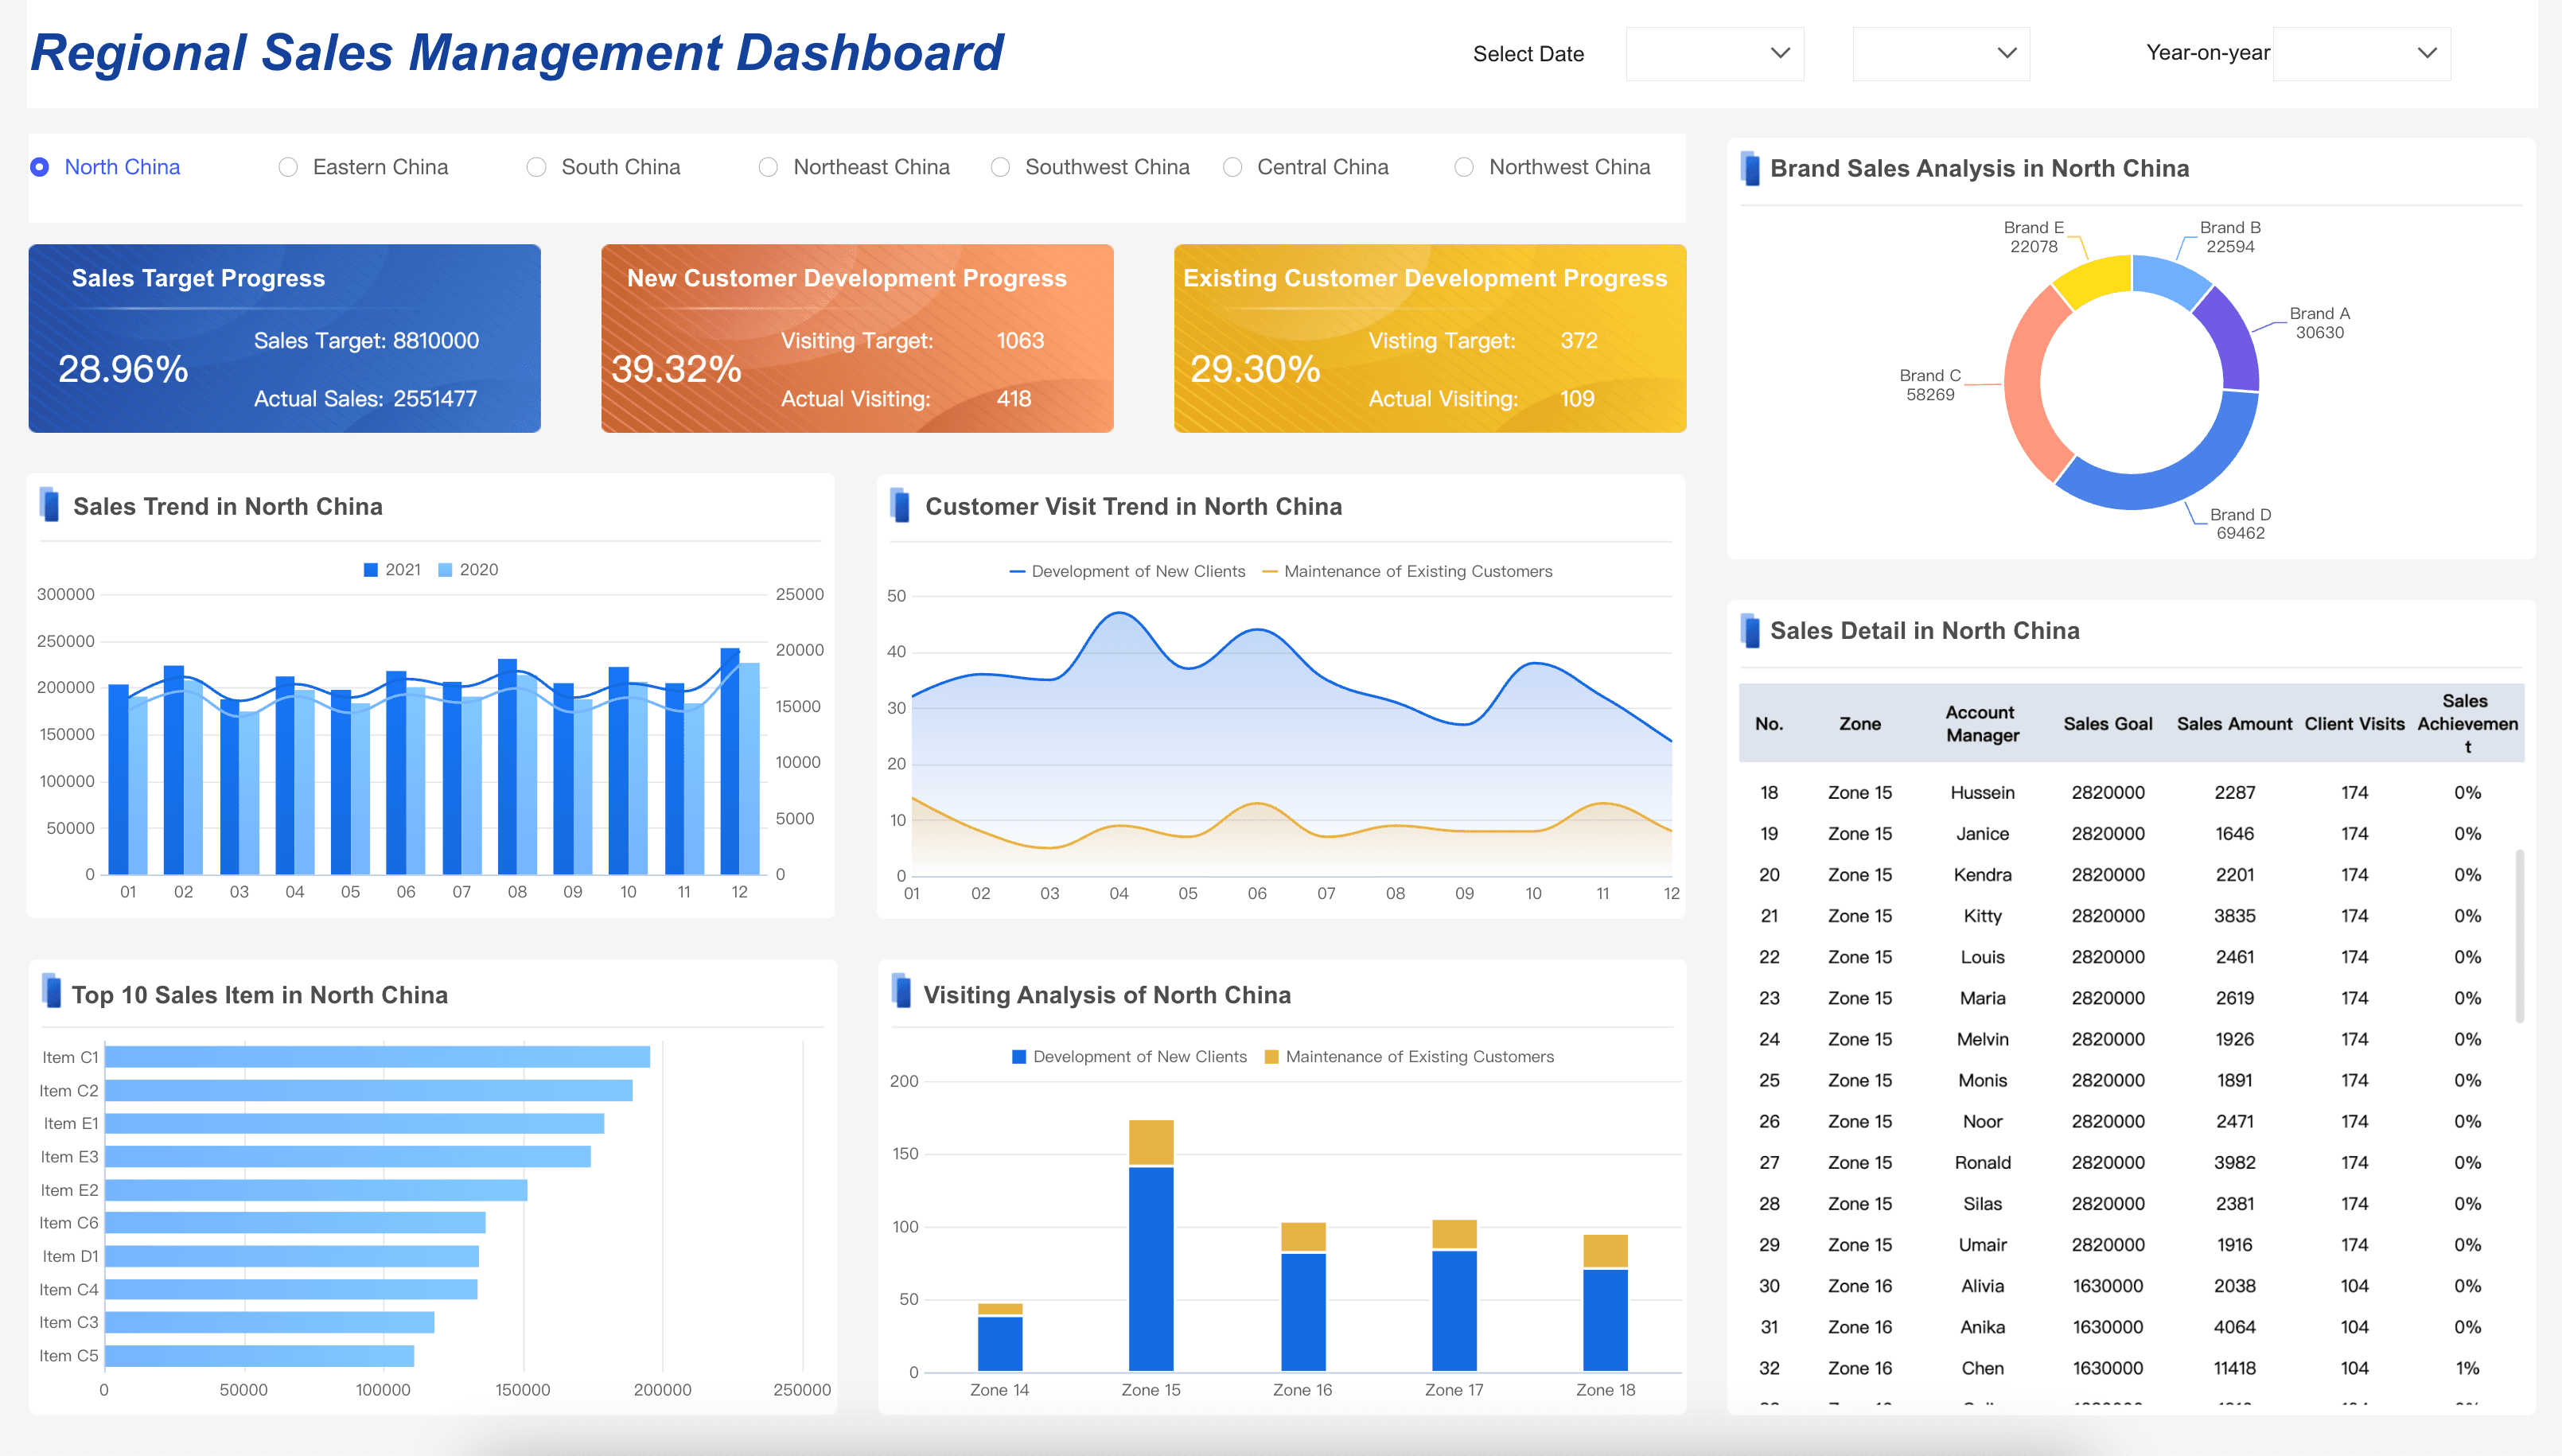
Sales Management Dashboard
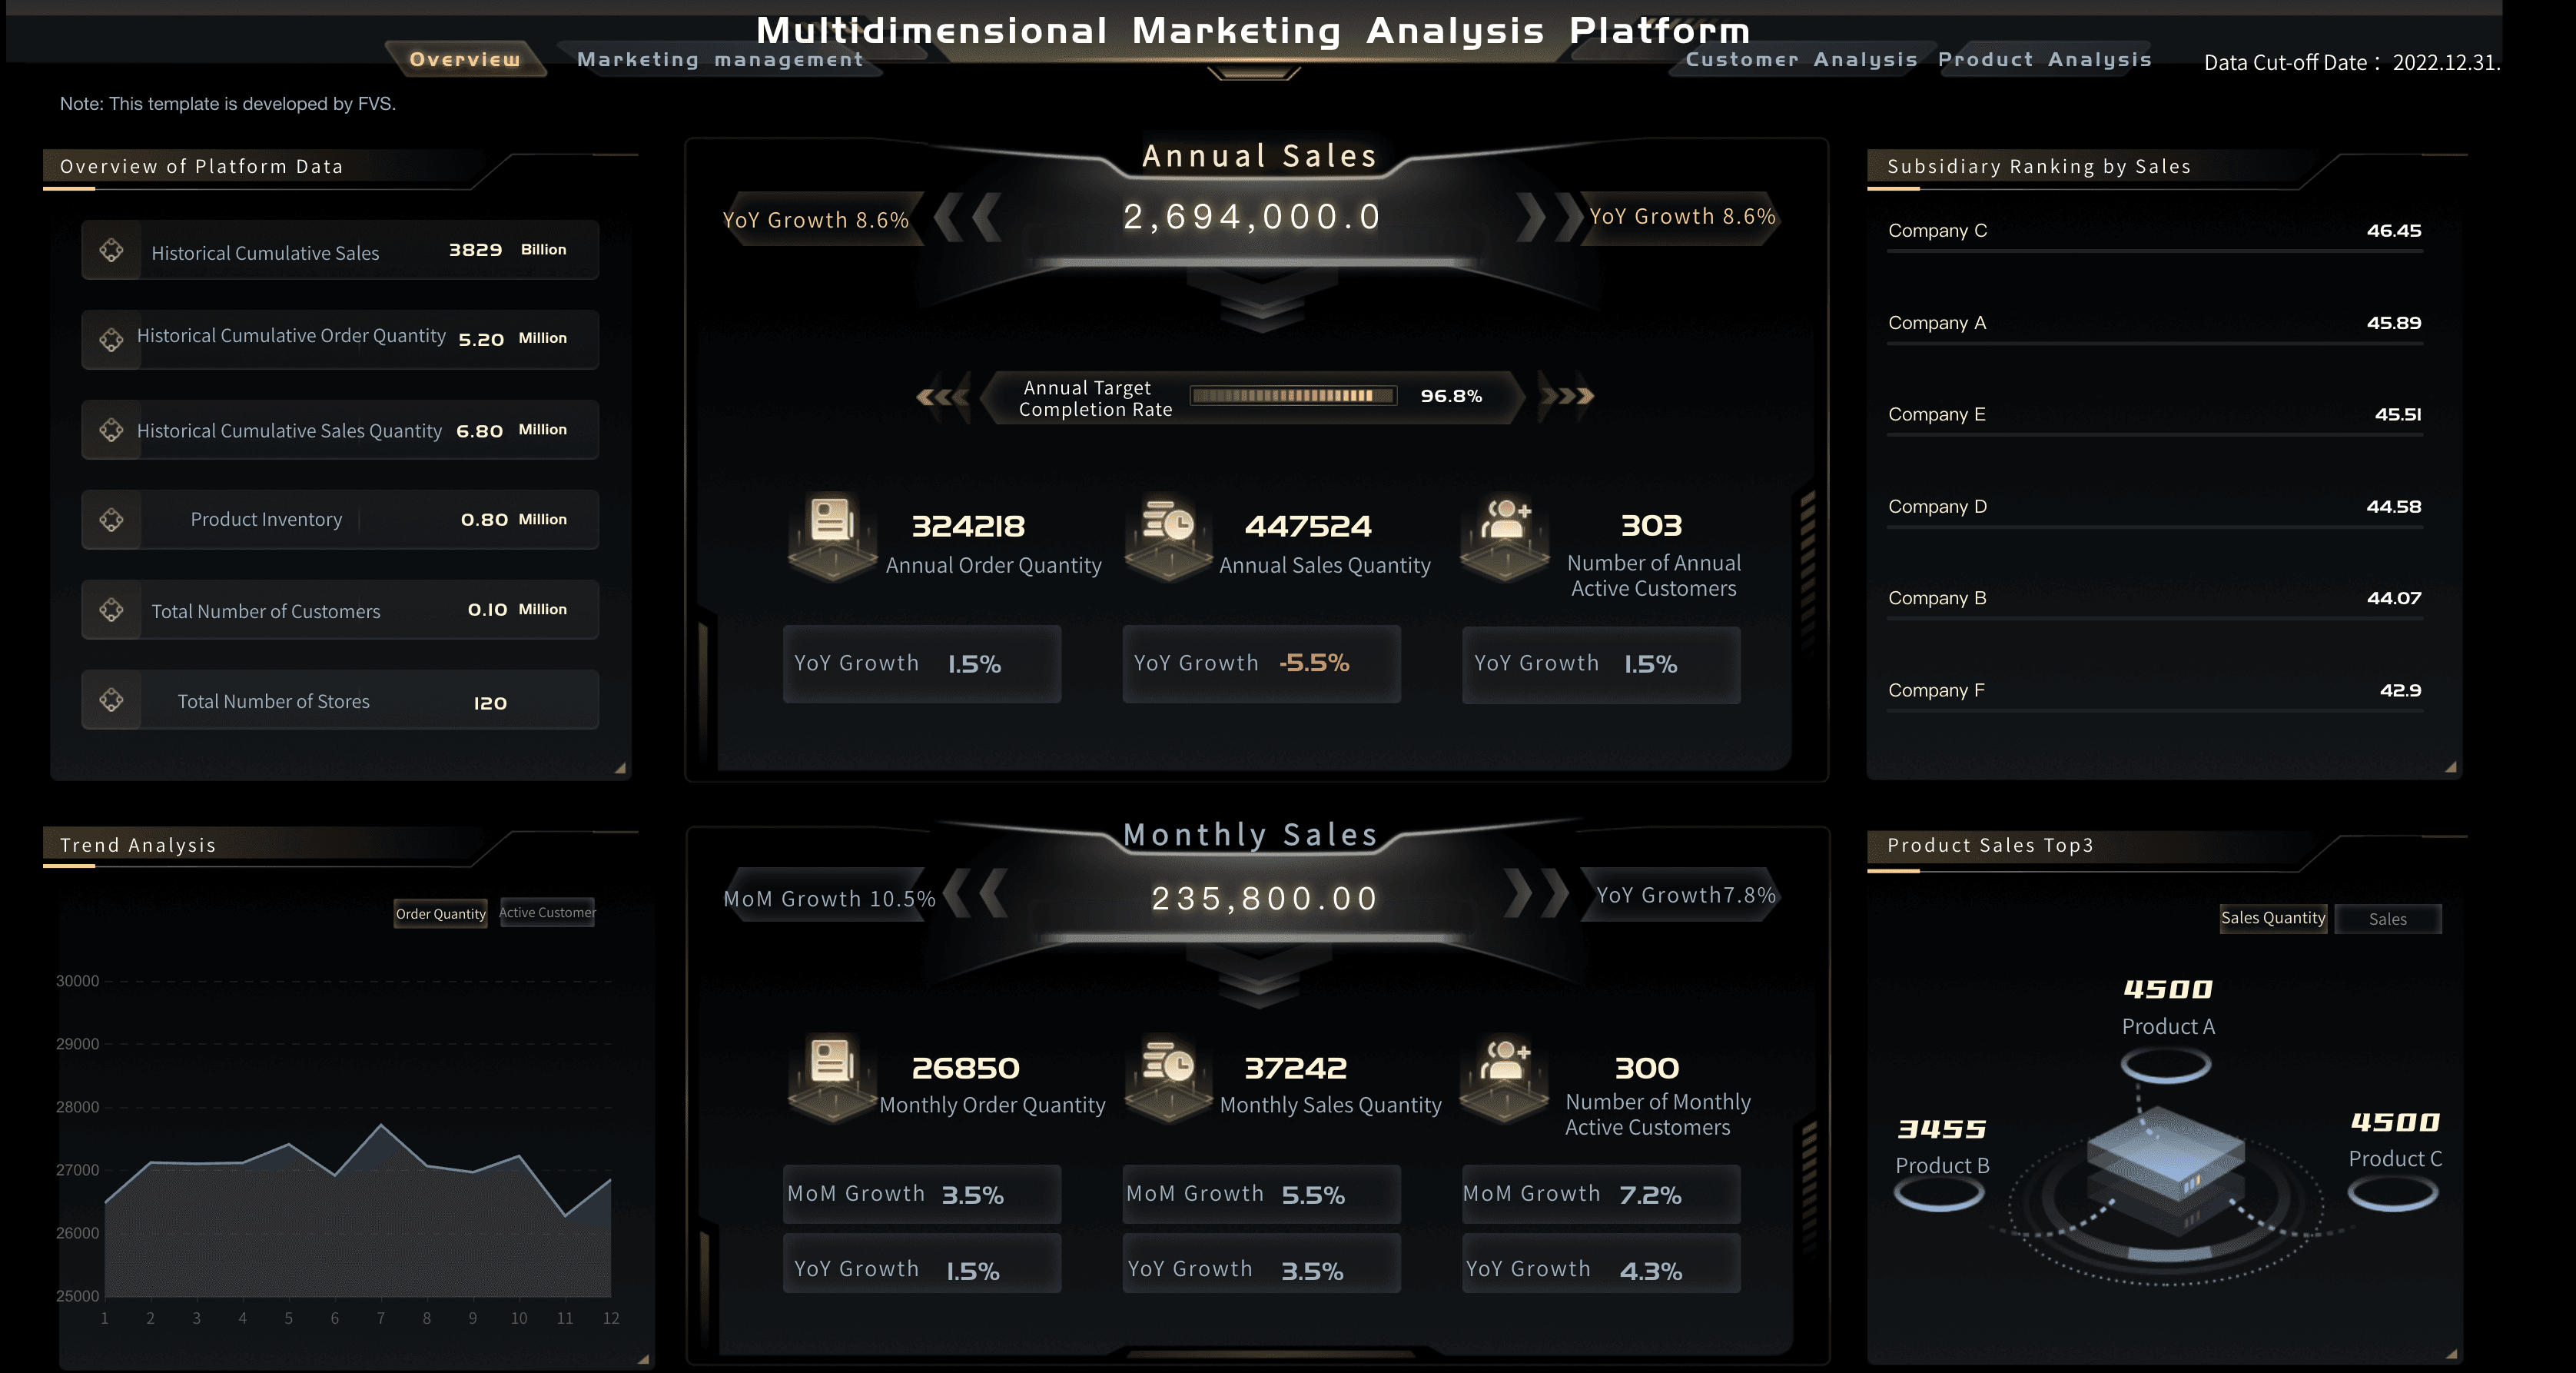
Marketing Analytics Platform
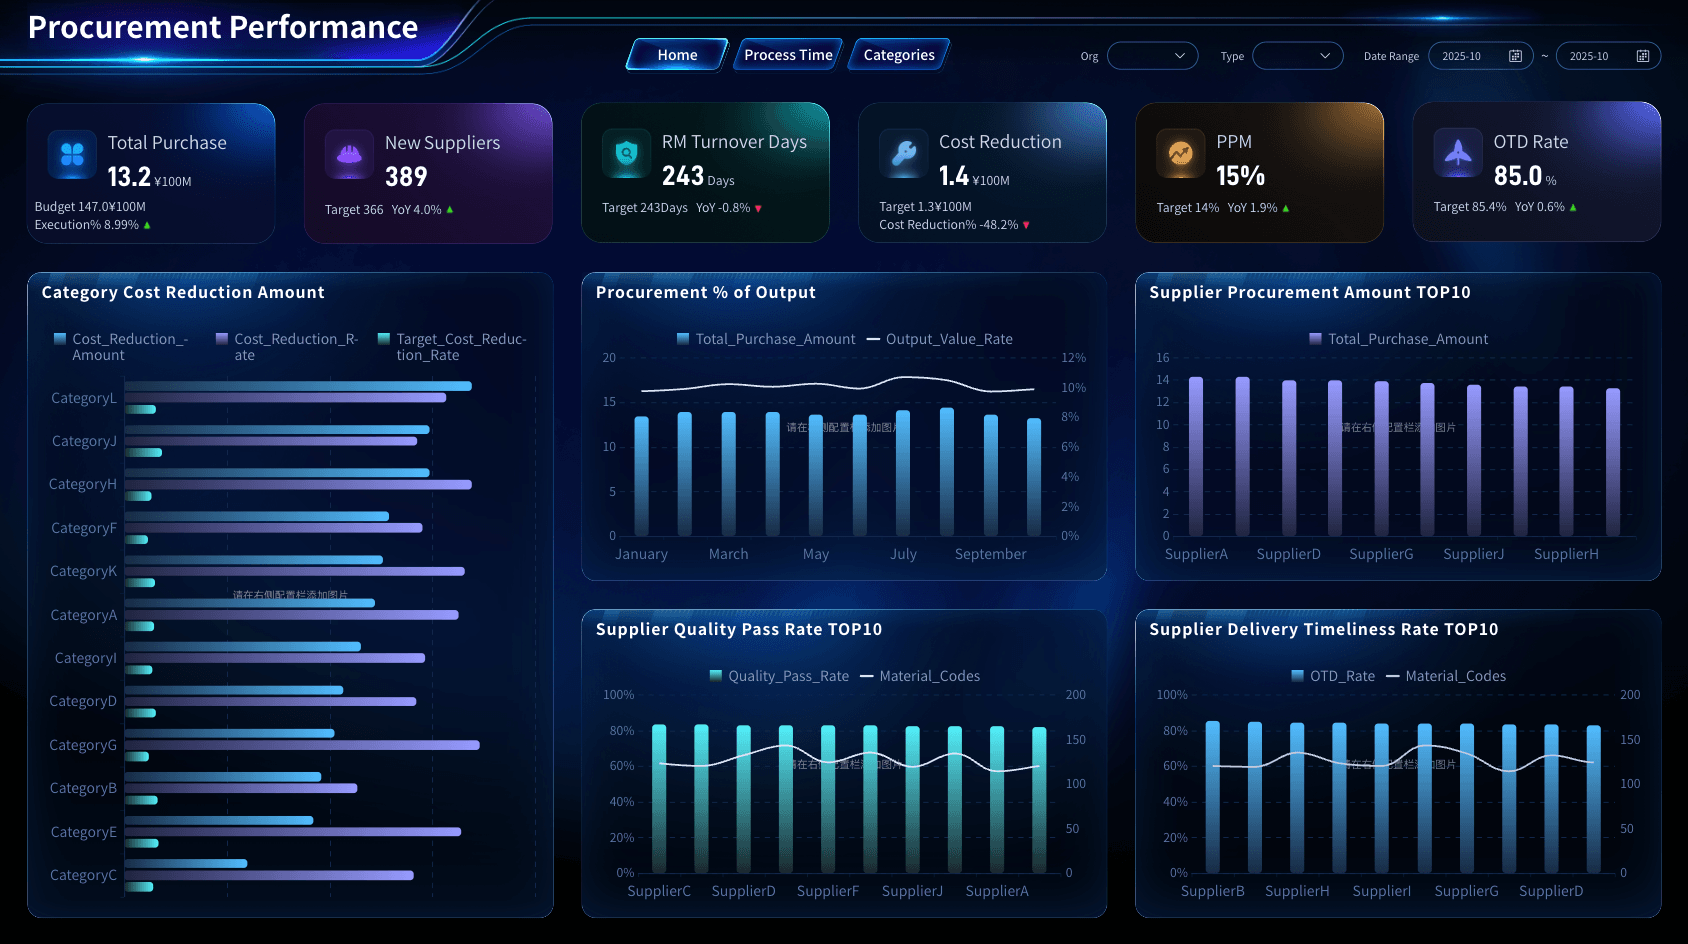
Procurement Category Management
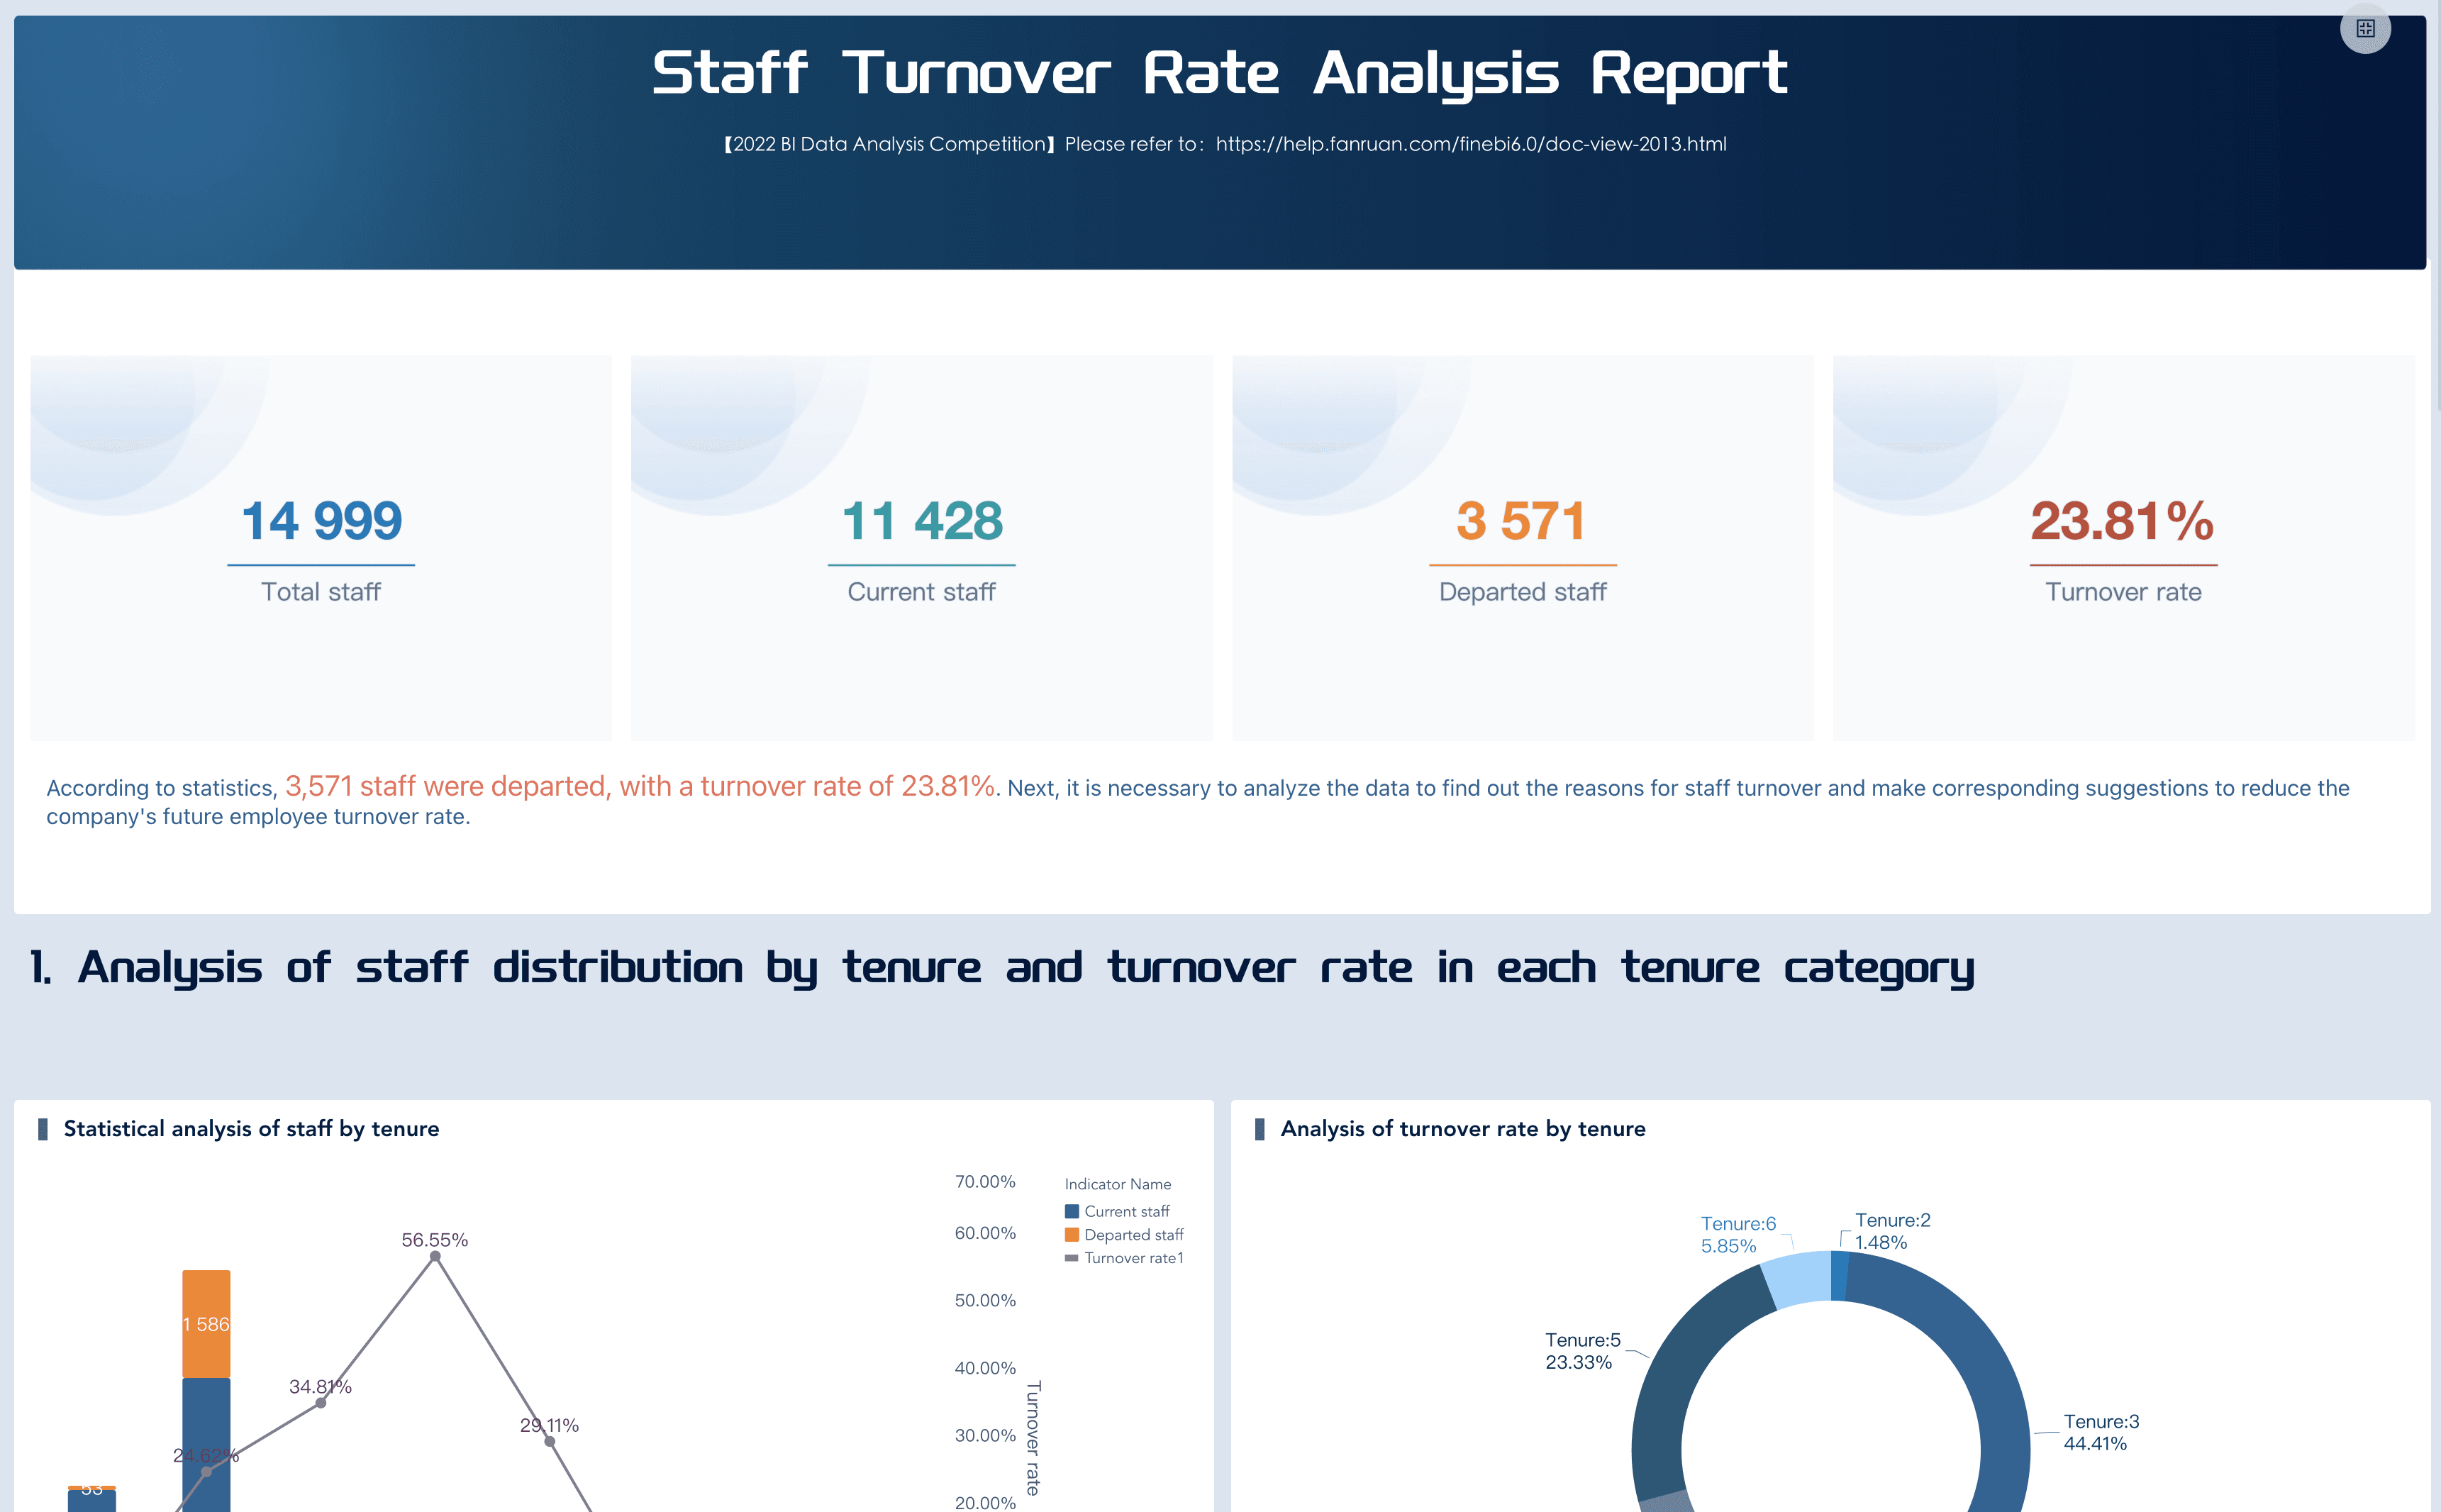
Employee Turnover Dashboard
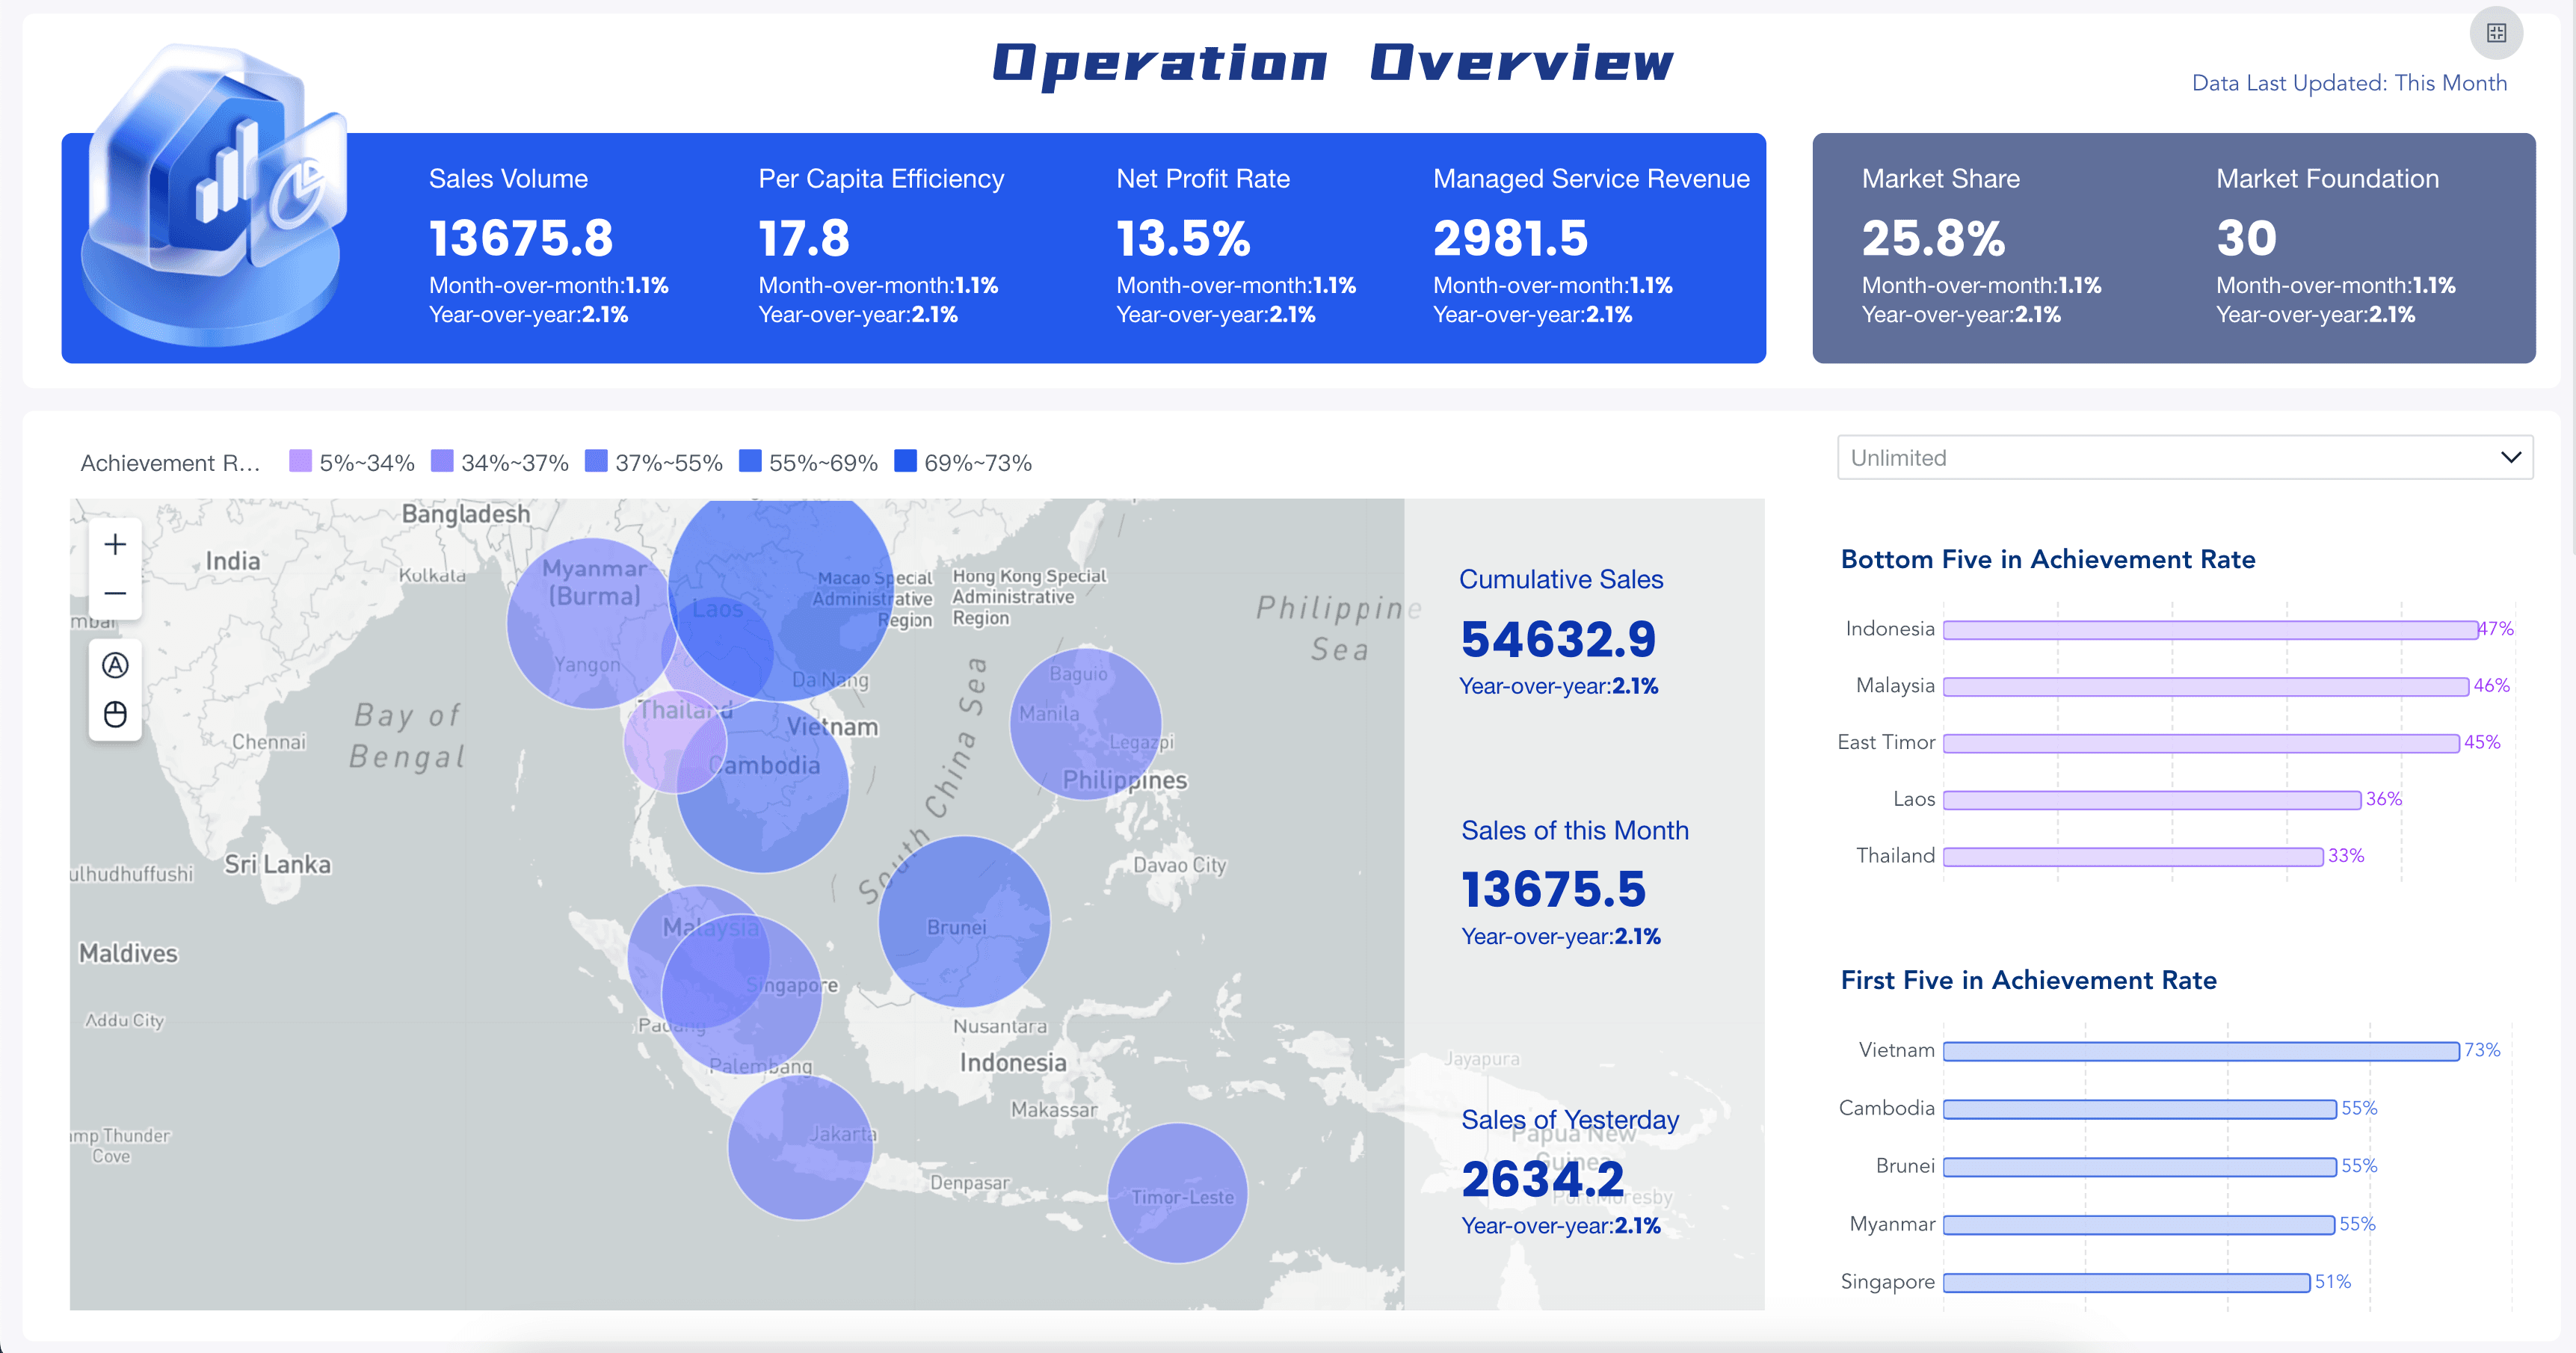
Retail Business Dashboard
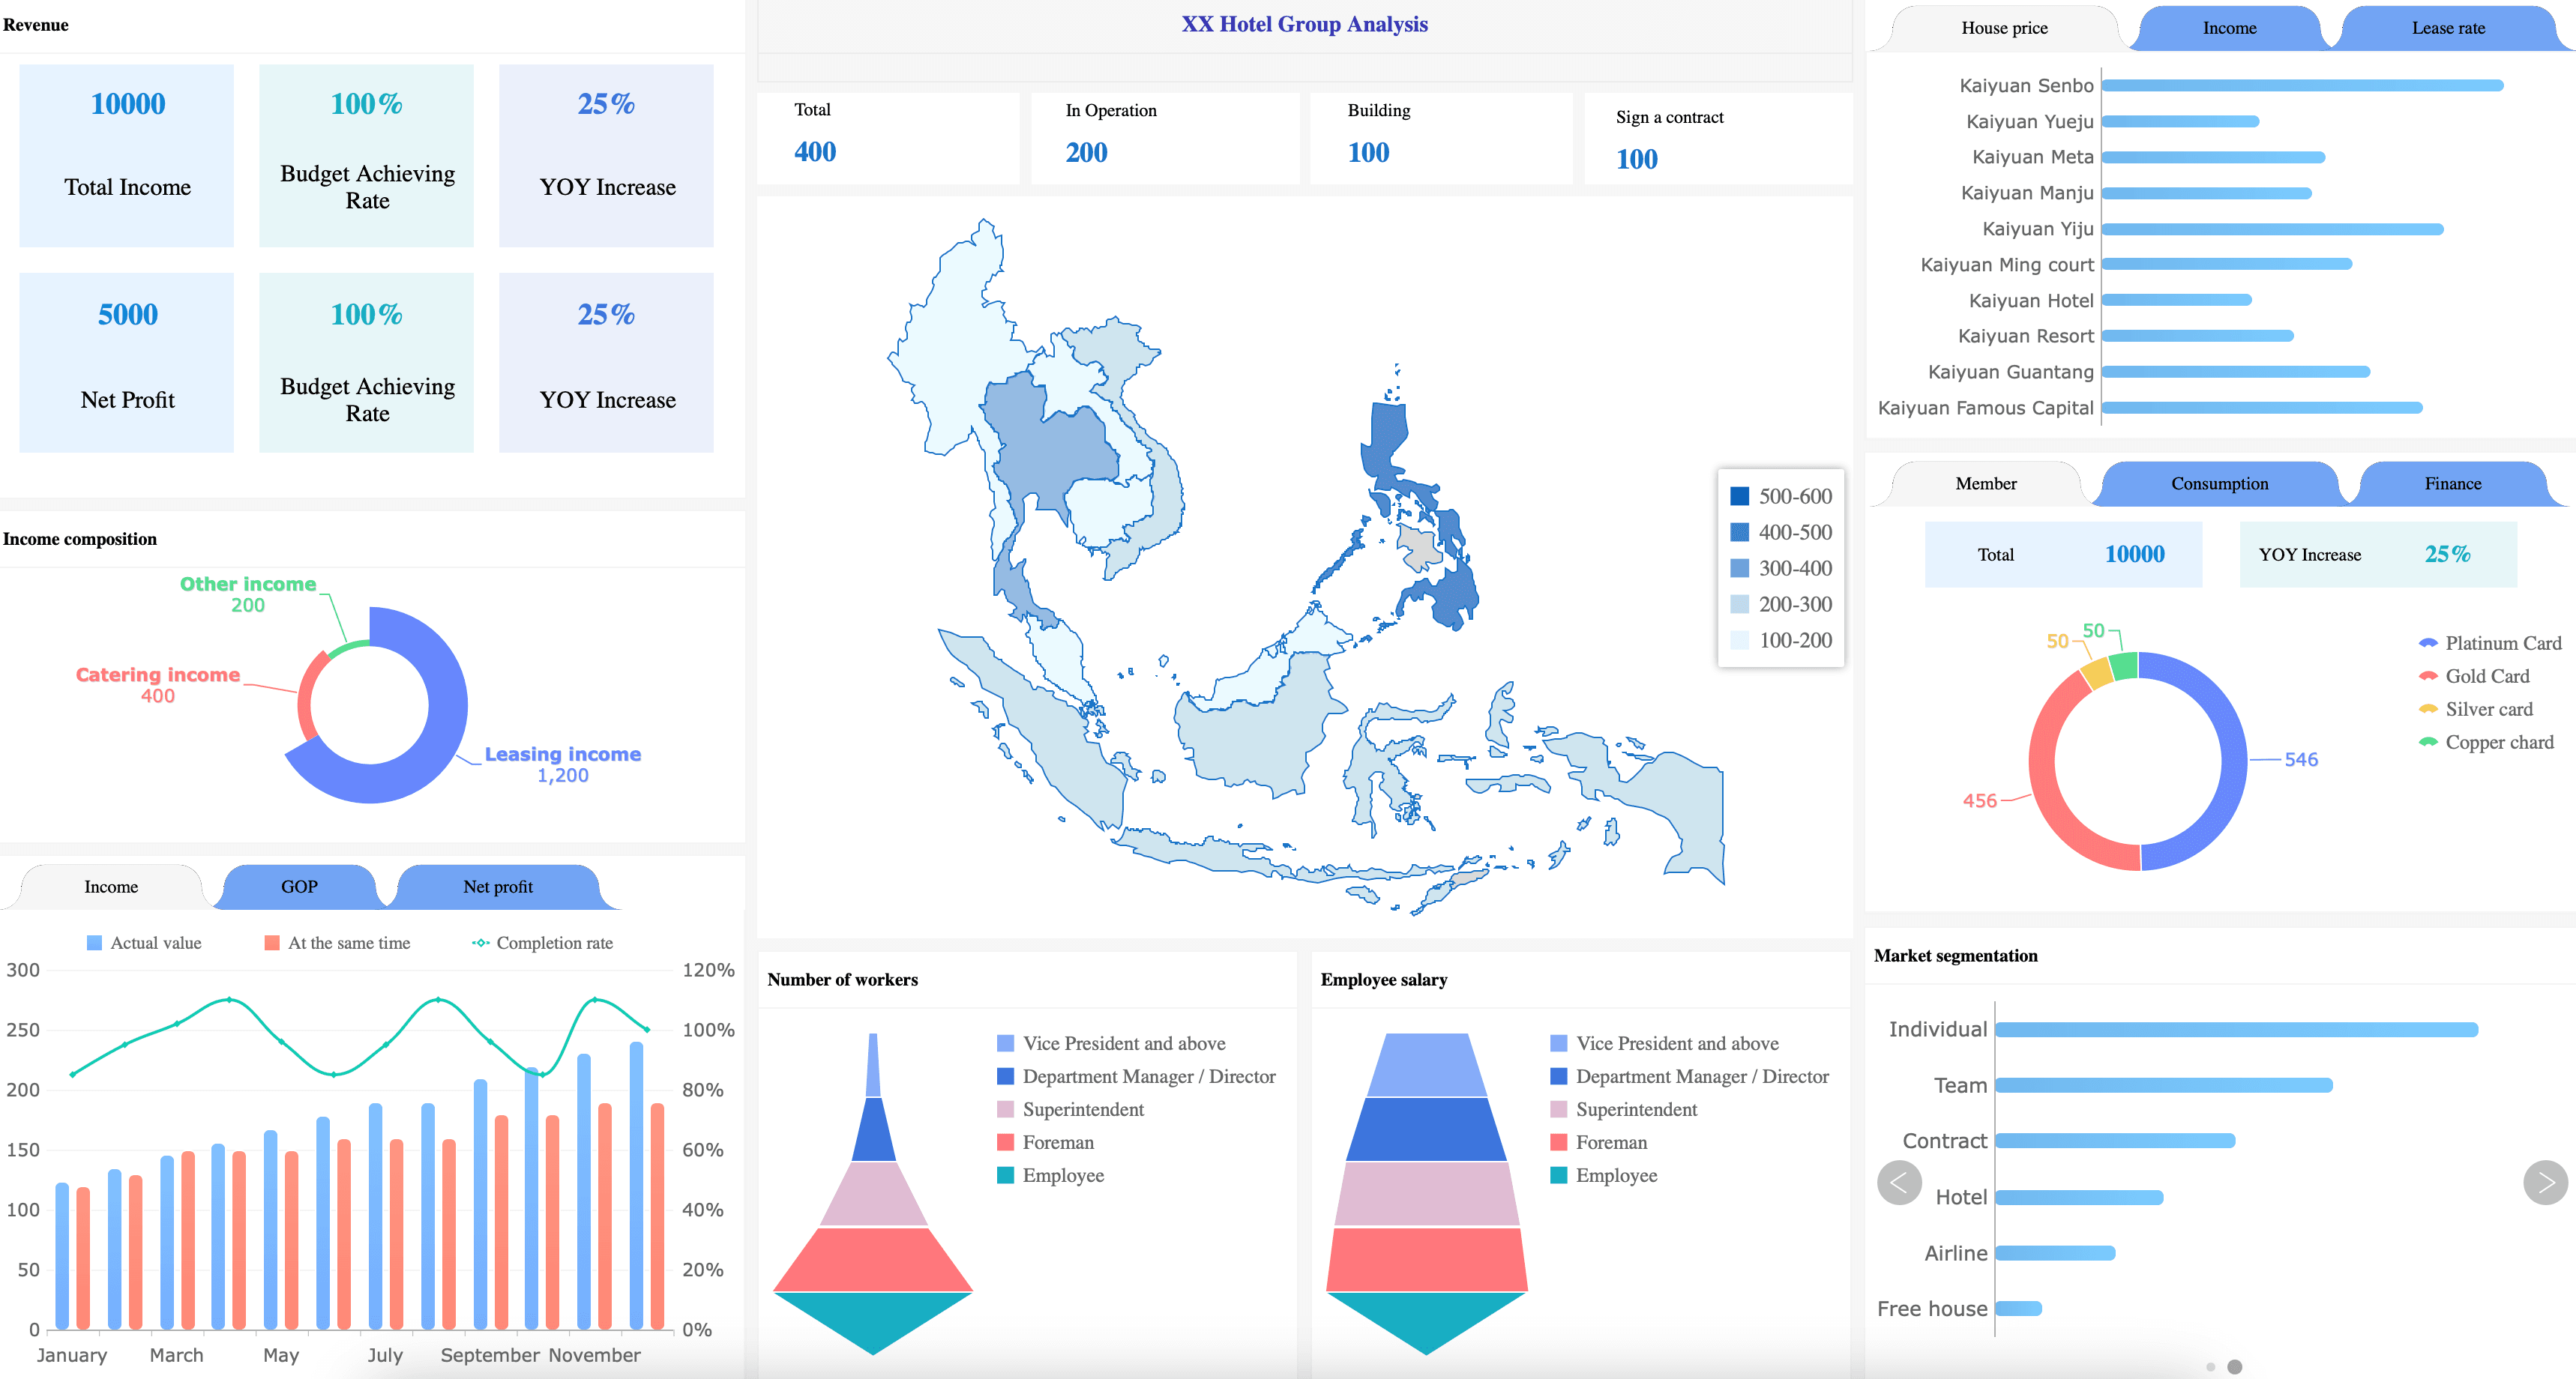
Hotel Data Analytics
For a business report, the lesson is not "add more charts." The lesson is to match each visual to a reporting question:
- Use an executive view when the report must explain overall business health.
- Use a finance view when the report must explain cost, margin, cash, or budget variance.
- Use a sales view when the report must explain revenue movement and pipeline risk.
- Use a marketing view when the report must connect campaign effort to business outcomes.
- Use an operations view when the report must identify bottlenecks, exceptions, and resource pressure.
- Use an HR view when the report must explain workforce movement, retention, or capacity.
Metrics of Business Report
The most common business report mistake is including every available metric. A good metric set is selective. Every number should help the reader understand performance, diagnose a change, or choose an action.
Use the audience to decide what belongs in the report:
Executives
Useful business report metrics:
- Revenue
- Margin
- Cash
- Growth
- Customer retention
- Operational risk
- Strategic initiative progress
Reading goal: Understand business health and decide where to focus.
Finance Leaders
Useful business report metrics:
- Budget variance
- Cash flow
- Gross margin
- Operating expense
- Accounts receivable
- Forecast accuracy
Reading goal: Explain financial performance and protect financial control.
Sales Leaders
Useful business report metrics:
- Pipeline value
- Win rate
- Quota attainment
- Average deal size
- Sales cycle
- Forecast risk
Reading goal: Improve revenue execution and forecast confidence.
Marketing Leaders
Useful business report metrics:
- Spend
- Leads
- Conversion rate
- Channel ROI
- Campaign pipeline
- Customer acquisition cost
Reading goal: Connect marketing work to qualified demand and revenue.
Operations Leaders
Useful business report metrics:
- Throughput
- Capacity
- Cycle time
- Defect rate
- Inventory turnover
- SLA performance
Reading goal: Find bottlenecks and improve delivery reliability.
HR Leaders
Useful business report metrics:
- Headcount
- Hiring progress
- Turnover
- Engagement
- Training completion
- Workforce cost
Reading goal: Understand people capacity and retention risk.
A useful business report usually combines four metric layers:
- Outcome metrics: What changed at the business level?
- Driver metrics: What caused or influenced that change?
- Risk metrics: What could threaten the plan?
- Action metrics: What will show whether the response worked?
This structure also keeps KPI reporting grounded. A KPI is not useful because it looks important. It is useful because it helps a specific audience make a specific decision.
Business Report Structure
A business report should be easy to scan before it becomes detailed. Most readers begin by asking, "What do I need to know?" Structure the report so that answer appears early.
A practical business report structure includes:
- Title and reporting period. State the topic, time range, business unit, region, or project scope.
- Executive summary. Summarize the main finding, business impact, recommendation, and decision needed.
- Business context. Explain why the report exists and what question it answers.
- Data sources and definitions. List the systems, files, metric formulas, refresh dates, and assumptions used.
- Key findings. Present the most important observations with charts, tables, and short explanations.
- Variance analysis. Compare actual vs. target, current vs. previous period, or segment vs. segment.
- Root-cause discussion. Explain the likely drivers behind the result and note what still needs validation.
- Recommendations. Give concrete next steps, owners, dates, and expected outcomes.
- Risks and limitations. Identify missing data, confidence level, external factors, and decision risks.
- Appendix. Put supporting tables, definitions, and detailed calculations where interested readers can find them.
For short weekly updates, you may only need five sections: summary, status, key changes, risks, and next actions. For a board-level report, you may need a full narrative, supporting dashboards, and detailed appendices.
Business Report Writing
Business report writing is not about sounding formal. It is about making the logic easy to follow.
Use these writing habits:
- Start with the answer. Do not make readers search through charts to find the conclusion. Say the key finding first, then show the evidence.
- Use plain business language. Write "revenue fell because renewal volume declined in two regions" instead of "commercial performance was impacted by multidimensional demand softness."
- Explain variance in layers. First state what changed. Then state the size of the change. Then explain the likely driver. Then say what action is recommended.
- Separate facts from interpretation. A fact is "gross margin decreased by 3 points." An interpretation is "the decrease appears to be driven by higher freight cost and discounting."
- Avoid unsupported certainty. If the data is incomplete, say so. A credible report is more useful than an overconfident one.
- Write useful chart captions. A caption should explain the meaning of a visual, not repeat the chart title.
Good business report writing reduces meeting time because readers can see the issue, evidence, and recommendation without asking the analyst to translate every slide.
Business Report Design
Business report design should make the next question obvious. It should not decorate data or fill space with charts.
Use these dashboard design principles when designing the visual layer of a business report:
- Put the main message above the detail. Start with the conclusion, key metrics, and variance. Put supporting charts below.
- Use consistent metric definitions. If revenue appears in three charts, it should mean the same thing in all three.
- Show target and trend together. A current number without a target is hard to judge. A target without a trend hides direction.
- Choose charts by comparison type. Use line charts for trends, bars for category comparison, tables for precise values, and scatter plots for relationships.
- Use color for meaning. Reserve strong colors for status, risk, exceptions, and priority. Too many colors weaken the signal.
- Keep labels readable. A report that looks good on a design canvas may fail in a meeting room. Test it on the screen where readers will use it.
- Add annotations for context. A sudden spike, policy change, campaign launch, or data gap should be explained near the visual.
When a business report becomes recurring, consider pairing the report with a KPI dashboard. The dashboard can handle ongoing monitoring, while the report can focus on interpretation, decisions, and accountability.
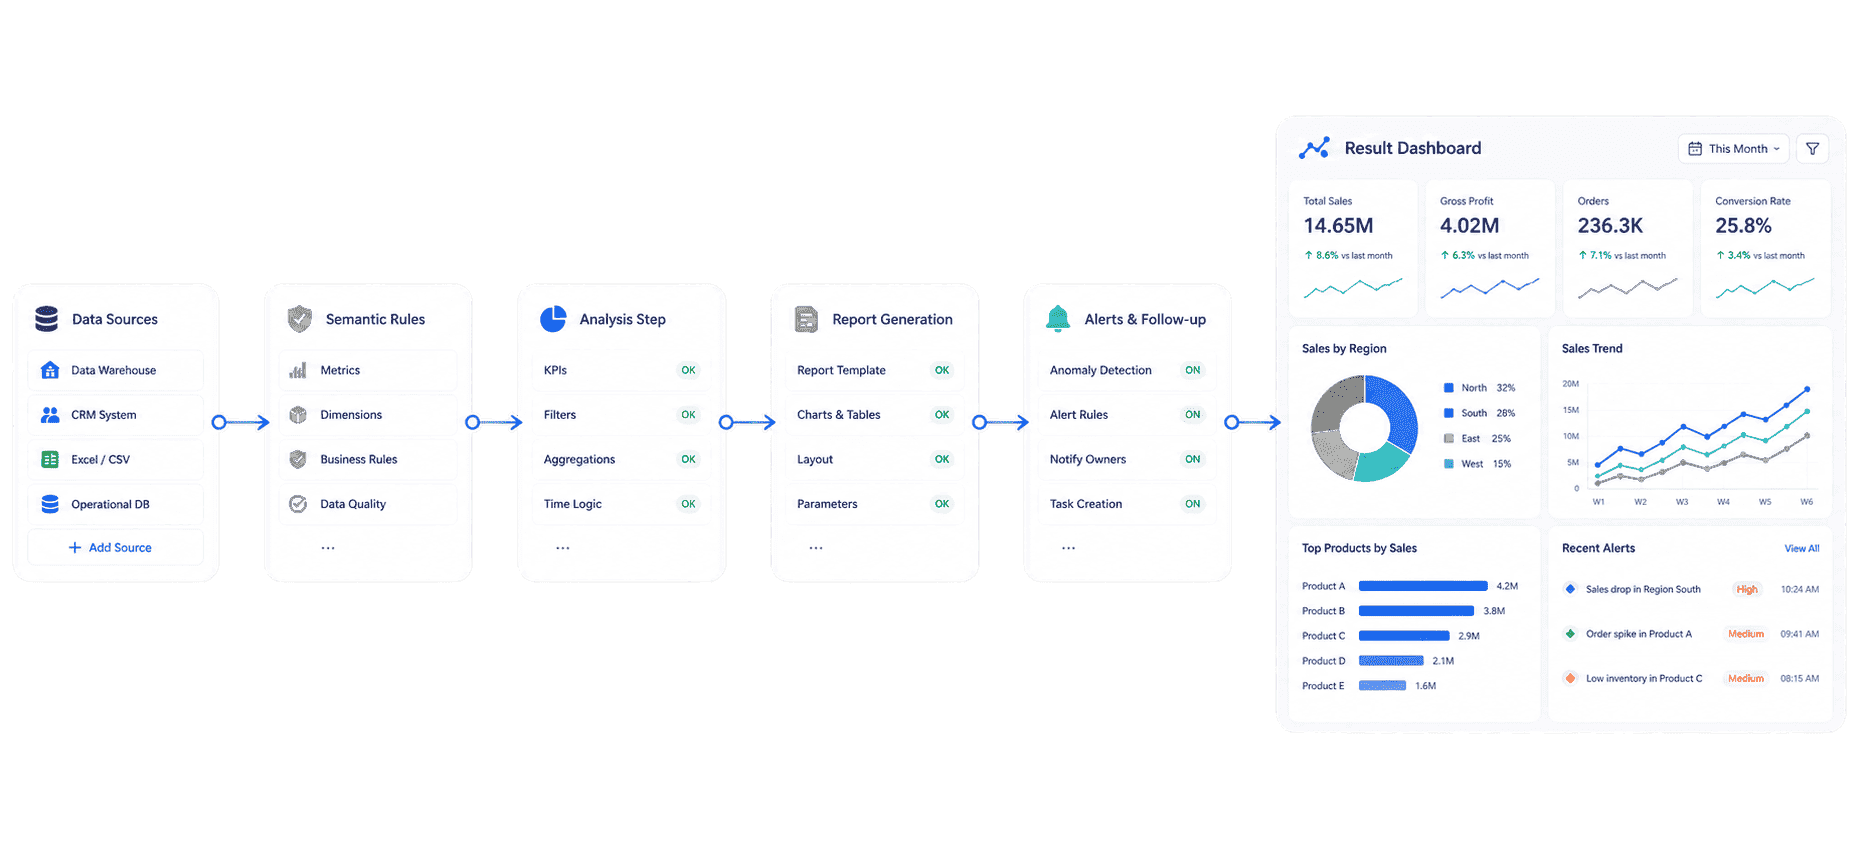
Business Report Workflow
A business report workflow should reduce repeated manual work without removing human judgment. Automation can prepare the data and visuals. People still need to frame the question, interpret the result, and decide what action is reasonable.
Use this workflow:
- Define the report decision. Write the decision or review question before collecting data.
- Choose the audience. A CFO, sales manager, operations director, and project sponsor need different levels of detail.
- Map data sources. Identify CRM, ERP, finance, HR, marketing, supply chain, spreadsheets, and external data sources.
- Standardize definitions. Document formulas for revenue, margin, active customer, qualified lead, churn, SLA, and other key metrics.
- Build the first version. Start with a small, trusted report instead of a large report that nobody believes.
- Review with real users. Watch what readers ask, ignore, misunderstand, or use to make decisions.
- Automate stable parts. Data refresh, calculation, chart updates, permissions, and scheduled delivery can often be automated.
- Keep a report inventory. Track owner, audience, purpose, data source, update cadence, and last review date.
- Retire reports that no longer drive decisions. Reporting bloat wastes attention and makes important reports harder to find.
This is where reporting tools, business reporting tools, and ad hoc reporting can help. The goal is not to produce more reports. The goal is to make the reports that matter easier to trust, update, and use.
Business Report With FineBI + Dora
FineBI + Dora can be introduced as a learning layer around business reporting rather than a hard-selling replacement for every reporting habit.
FineBI can support the structured reporting layer:
- Connect data from business systems and spreadsheets.
- Build governed datasets and reusable metric definitions.
- Create visual report pages, dashboards, filters, and drill-down paths.
- Manage permissions for executives, departments, regions, and analysts.
- Keep recurring reports easier to refresh and distribute.
Dora can support the question layer. As a data agent, dora can help users ask follow-up questions, explore variance, compare segments, and turn a static report into a guided learning process.
 Dora's Workflow
A practical learning path could look like this:
- Week 1: Build the business report question map. List the recurring decisions your reports are supposed to support.
- Week 2: Create a metric dictionary. Define the formulas, owners, targets, refresh cadence, and allowed filters for the most important KPIs.
- Week 3: Prototype the visual layer in FineBI. Turn the report outline into a dashboard or report page with summary, trend, variance, and detail views.
- Week 4: Use dora to explore follow-up questions. Ask why a metric changed, which segment contributed most, and what data should be checked next.
- Week 5: Turn learning into reporting standards. Document useful prompts, chart patterns, metric definitions, and review habits so the next report is easier to build.
The point is not to make the business report more complex. The point is to help readers learn faster from the data they already collect.
If your team is exploring AI-assisted analytics more broadly, related learning paths include enterprise AI agents, AI assistant for business, and AI agent workflow.
Business Report Hub
This business report guide can work as a spoke inside a broader report learning hub. Use the hub to explain the reporting category, then connect readers to more specific report pages and templates based on their job.
The same hub can also introduce future or supporting spokes such as status report, ESG report, marketing report, regulatory reporting, sustainability reporting, CRM reporting, and supply chain reporting. This structure helps readers move from the broad question "what is a report?" to a specific reporting problem such as finance, sales, compliance, or operations.
For dashboard-connected reporting, pair this business report page with the dashboard hub, dashboard examples, dashboard design, KPI dashboard, sales dashboard, marketing dashboard, and HR dashboard guides.
FAQs
A business report is a structured document that presents business information, analysis, findings, and recommendations for a specific audience. It helps readers understand performance, diagnose issues, compare results, and decide what to do next.
A business report should include a clear purpose, reporting period, executive summary, business context, data sources, key findings, supporting charts or tables, analysis, recommendations, risks, and next actions. Short reports may use a lighter structure, but they should still make the decision and evidence clear.
A dashboard is usually used for monitoring metrics through visual and interactive views. A business report is used for explanation, interpretation, and decision records. Many teams use dashboards to track what is happening and business reports to explain why it matters.
Common business report types include executive reports, financial reports, sales reports, marketing reports, operational reports, status reports, expense reports, ESG reports, compliance reports, analytical reports, and summary reports. The right type depends on the audience and decision.
Start with the decision question, define the audience, collect trusted data, summarize the main finding early, explain the evidence clearly, include charts only when they support the message, and end with recommended actions. Good business report writing is specific, plain, and evidence-based.
The cadence should match the decision rhythm. Daily reports support operational action. Weekly reports support team management. Monthly reports support performance reviews. Quarterly reports support strategy, finance, and board discussions. Annual reports support long-term accountability.
Yes. Data extraction, metric calculation, chart refresh, permissions, and scheduled delivery can often be automated with BI and reporting tools. Human judgment is still needed to frame the question, interpret the result, explain uncertainty, and recommend action.
