
What is a Financial Report?
Financial Report vs Financial Dashboard
What's the difference between a financial report and a financial dashboard?
- Financial reports provide a comprehensive, period-based record of financial results. They are typically generated on a scheduled basis (monthly, quarterly, annually) and serve compliance, audit, and deep-dive analysis purposes. Reports answer "what happened and why".
- Financial dashboards offer a real-time, interactive view of key financial KPIs. They are designed for continuous monitoring, helping finance leaders spot variances, track budget adherence, and respond to emerging trends before they escalate. Dashboards answer "what is happening right now".
More resources:
- Dive deeper on the questions, "What is a Report?" & "What is a Sales Report?"
- Download interactive financial report templates
Don't just collect data. Visualize what matters.
Get a deeper exploration to master:
- End-to-end report design from data connection to automated scheduling
- Advanced layout techniques for pixel-perfect, print-ready enterprise reports
- Built-in formulas, parameters, and drill-downs to build interactive reports without code

Why Are Financial Reports Important?
Well-designed financial reporting is foundational to organizational accountability and strategic agility. Here are the biggest reasons why you need effective financial reports:
- Ensure regulatory compliance: Standardized reports meet GAAP, IFRS, and tax filing requirements, reducing audit risk and avoiding penalties.
- Enable data-driven decisions: Consolidated financial views give executives a single source of truth for budgeting, capital allocation, and investment evaluation.
- Improve cross-functional alignment: When finance, operations, and leadership work from the same numbers, variance discussions shift from data reconciliation to action planning.
Types of Financial Reports
Financial reports serve different audiences and decision horizons. Understanding the distinctions ensures each stakeholder gets the right level of detail.
- Statutory Financial Reports: These externally-facing documents (income statement, balance sheet, cash flow statement) comply with accounting standards and are used by regulators, auditors, and investors to assess organizational health.
- Management Financial Reports: Internally-focused reports tailored to department heads and executives. They include budget-vs-actual analyses, cost center breakdowns, and margin reviews designed to support operational decisions.
- Ad-Hoc Financial Reports: On-demand analyses created to answer specific business questions — such as profitability by product line, ROI on a new initiative, or scenario modeling for a potential acquisition.
How to Build a Financial Report
- Define the audience and purpose. A board-level summary requires different granularity than a departmental cost review. Work with stakeholders upfront to identify the decisions the report must support and the time horizons it must cover.
- Select meaningful metrics. Apply the SMART framework: every metric should be Specific, Measurable, Attainable, Relevant, and Time-bound. Examples include "gross margin by business unit per quarter" or "operating expense variance vs. budget YTD." Resist including data points that don't tie to a decision.
- Automate and iterate. Connect your reporting tool directly to source systems to eliminate manual data entry and reduce errors. Review report usage regularly — retire unused sections, refine visualizations based on feedback, and adapt the structure as business priorities evolve.
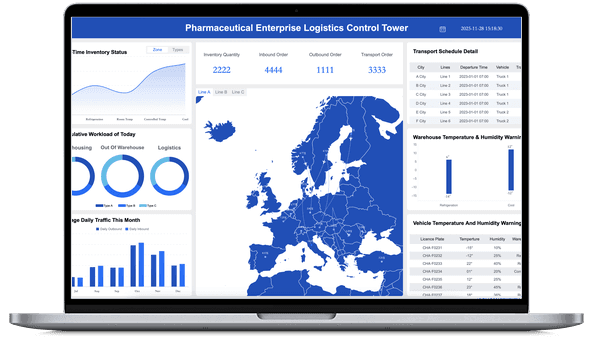
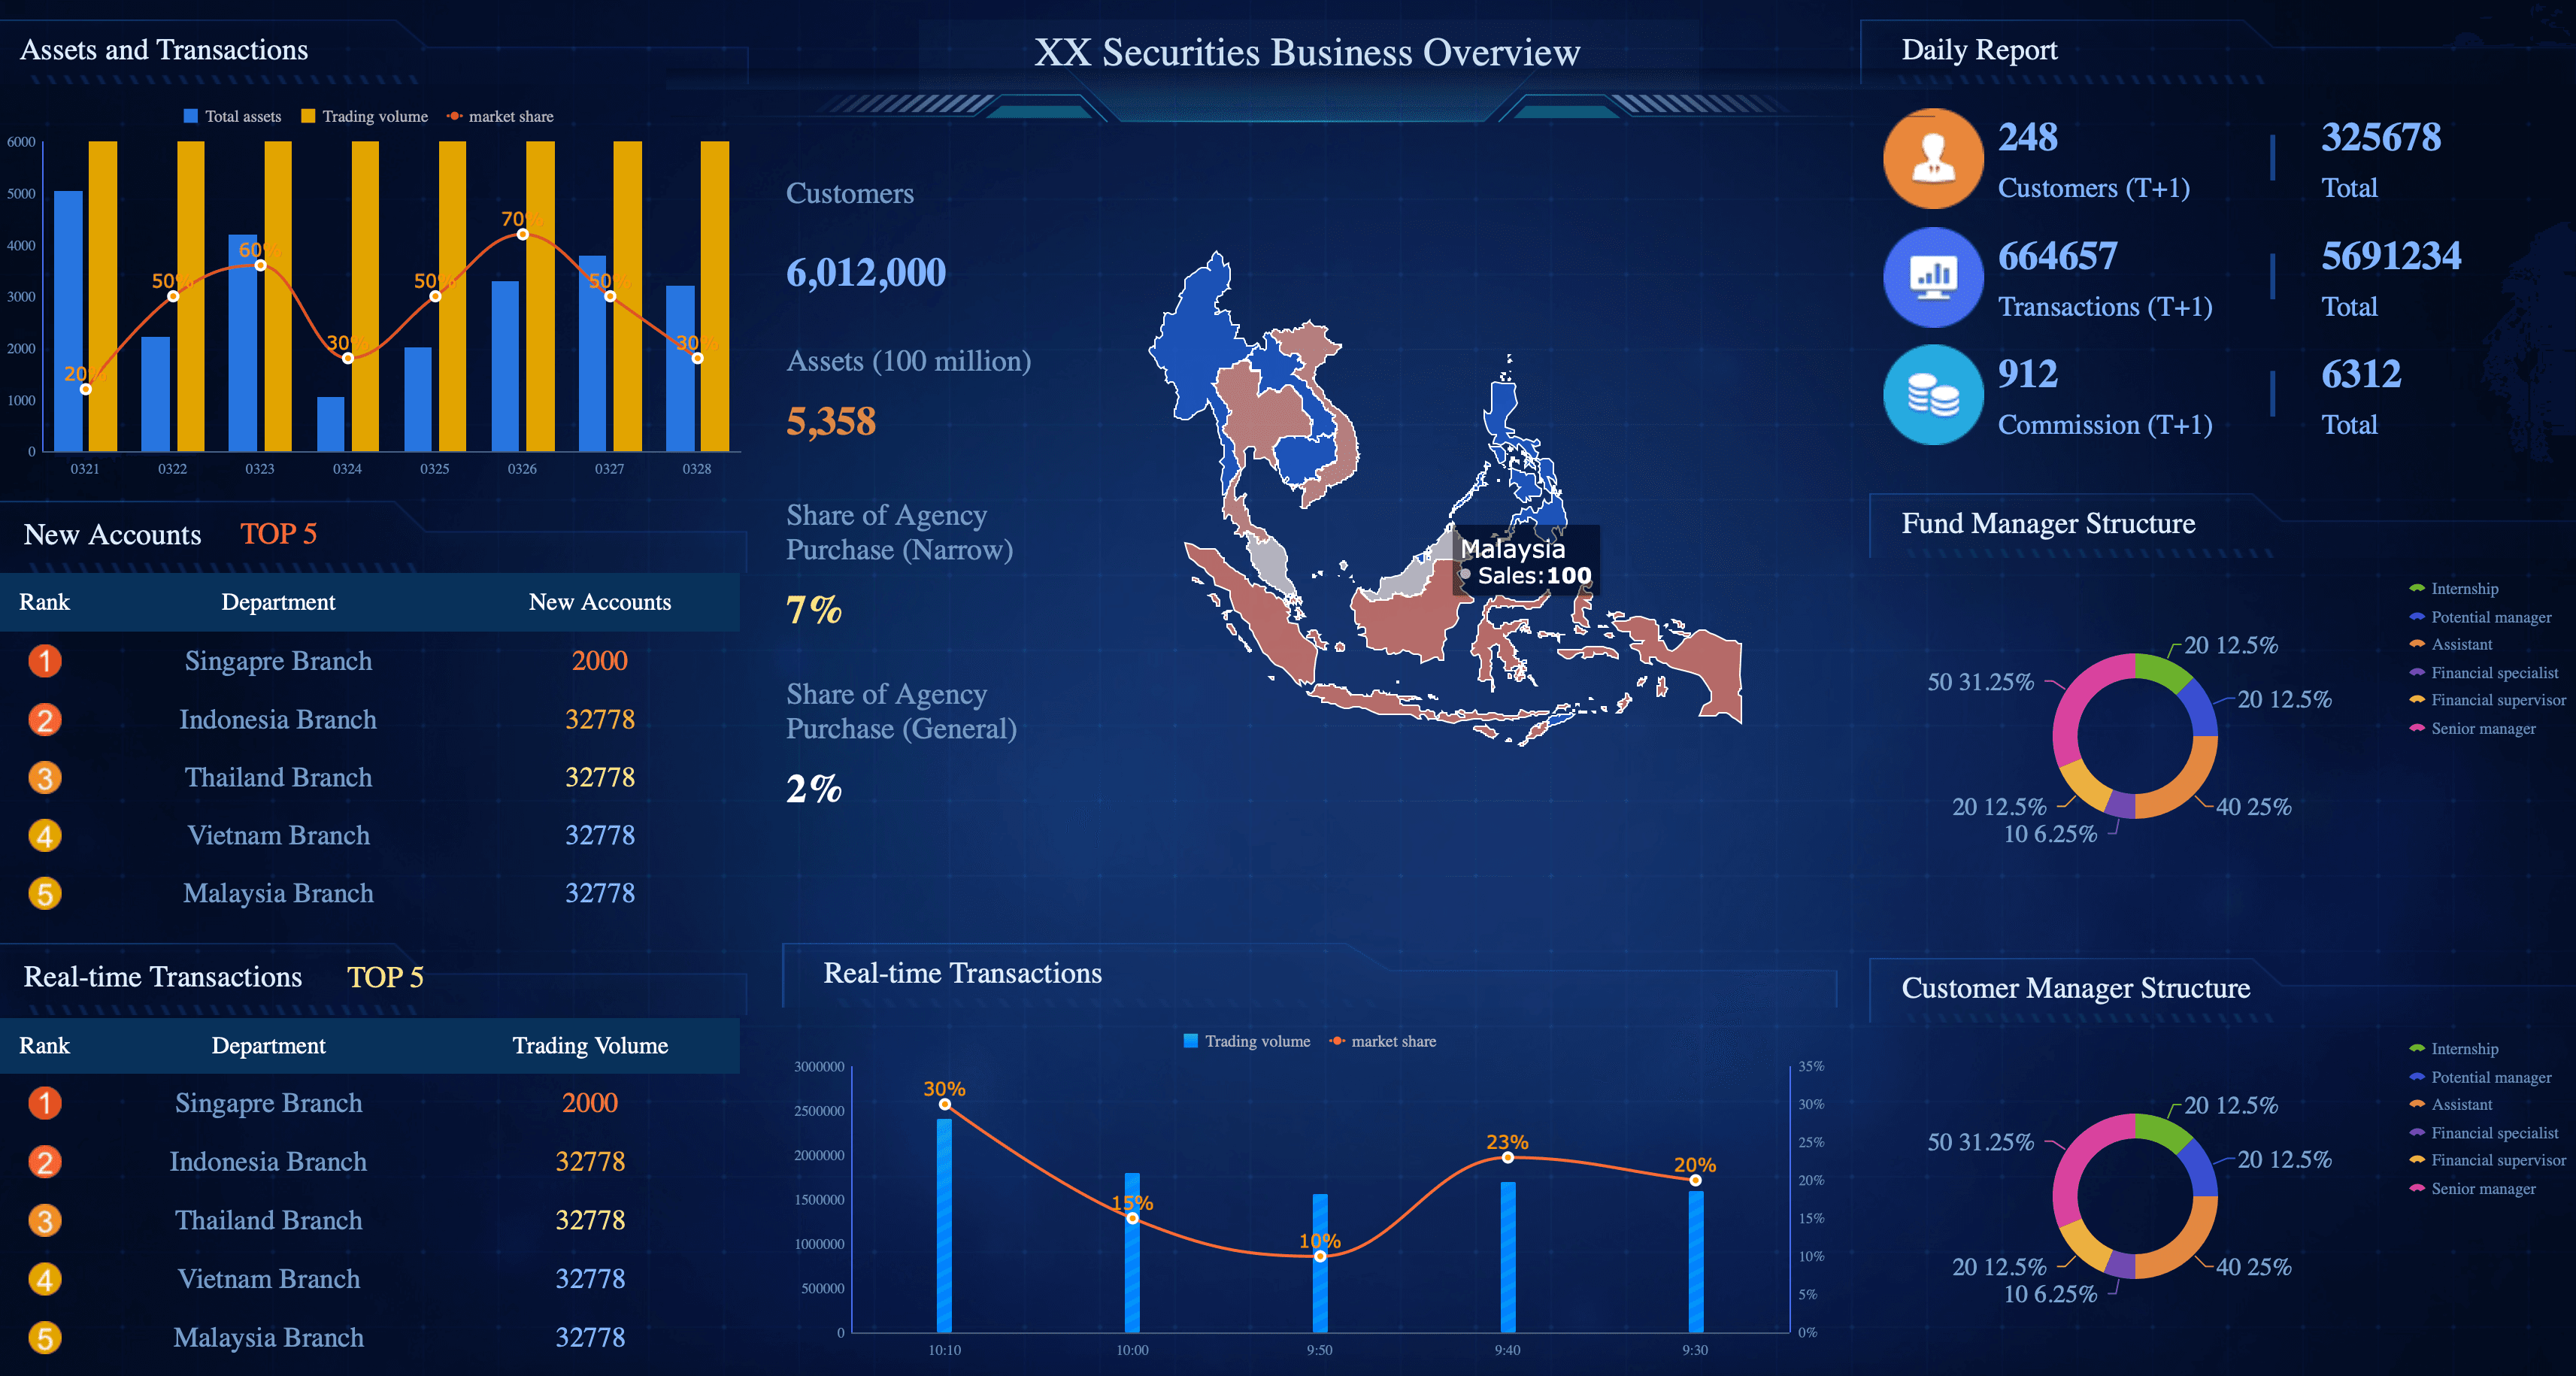
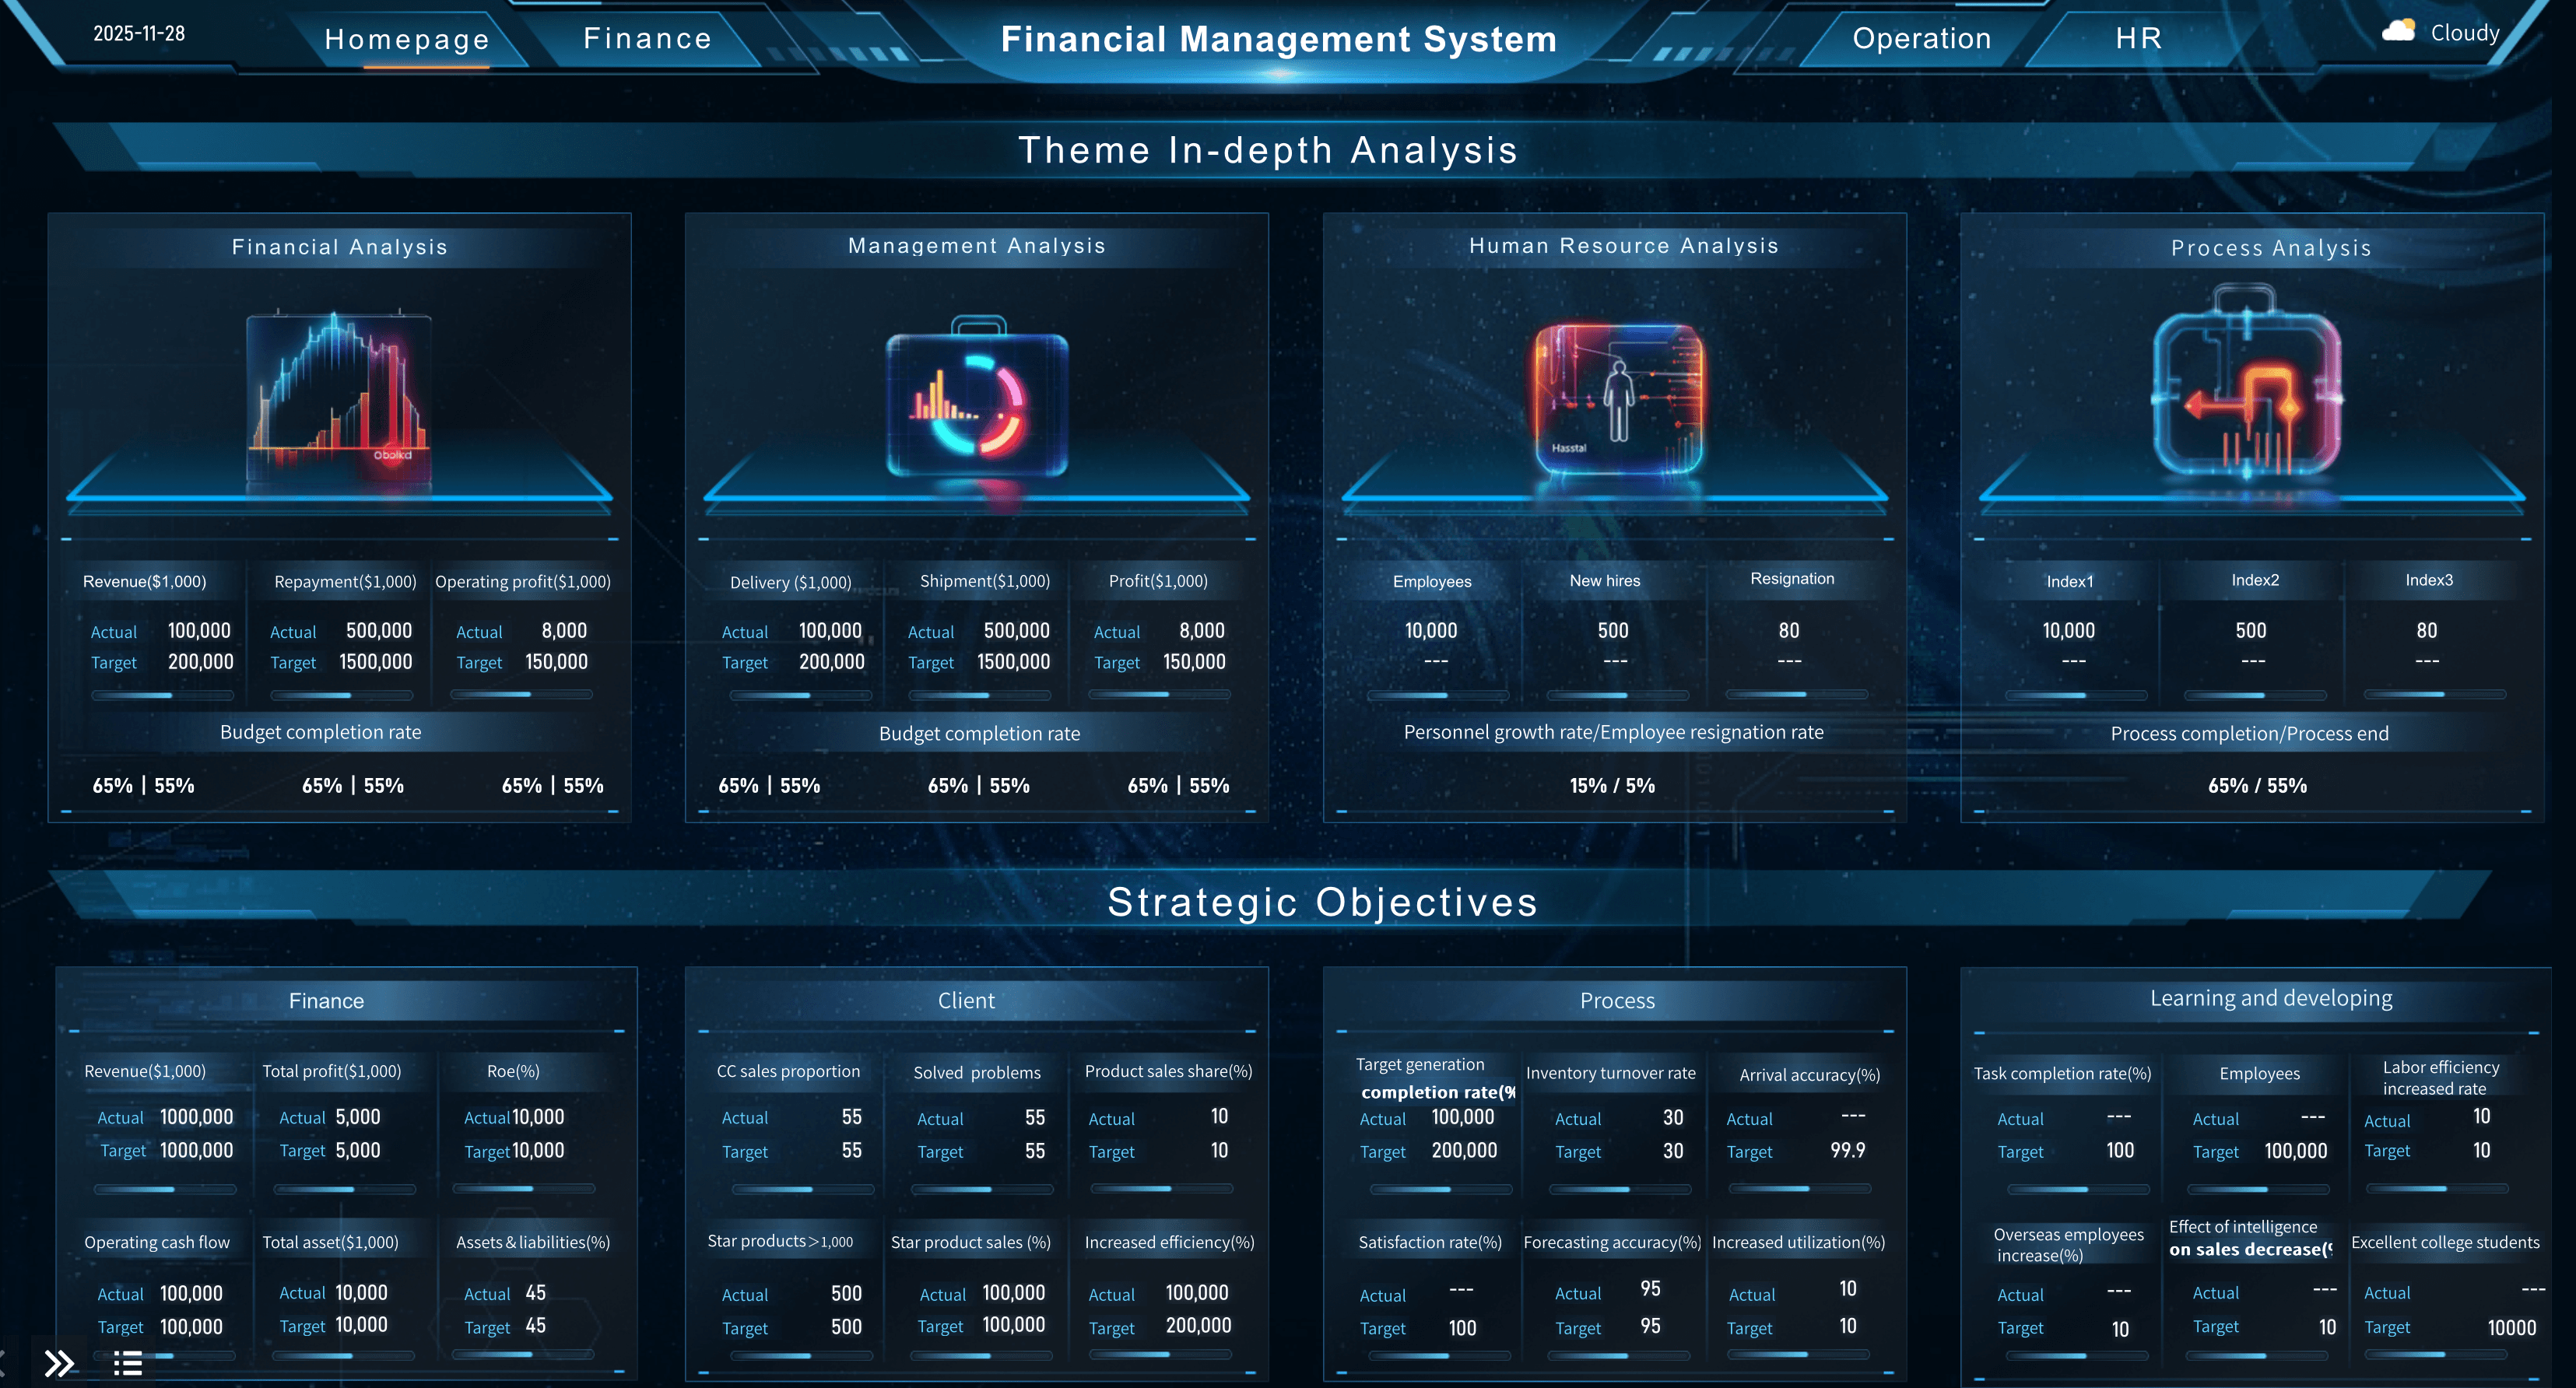
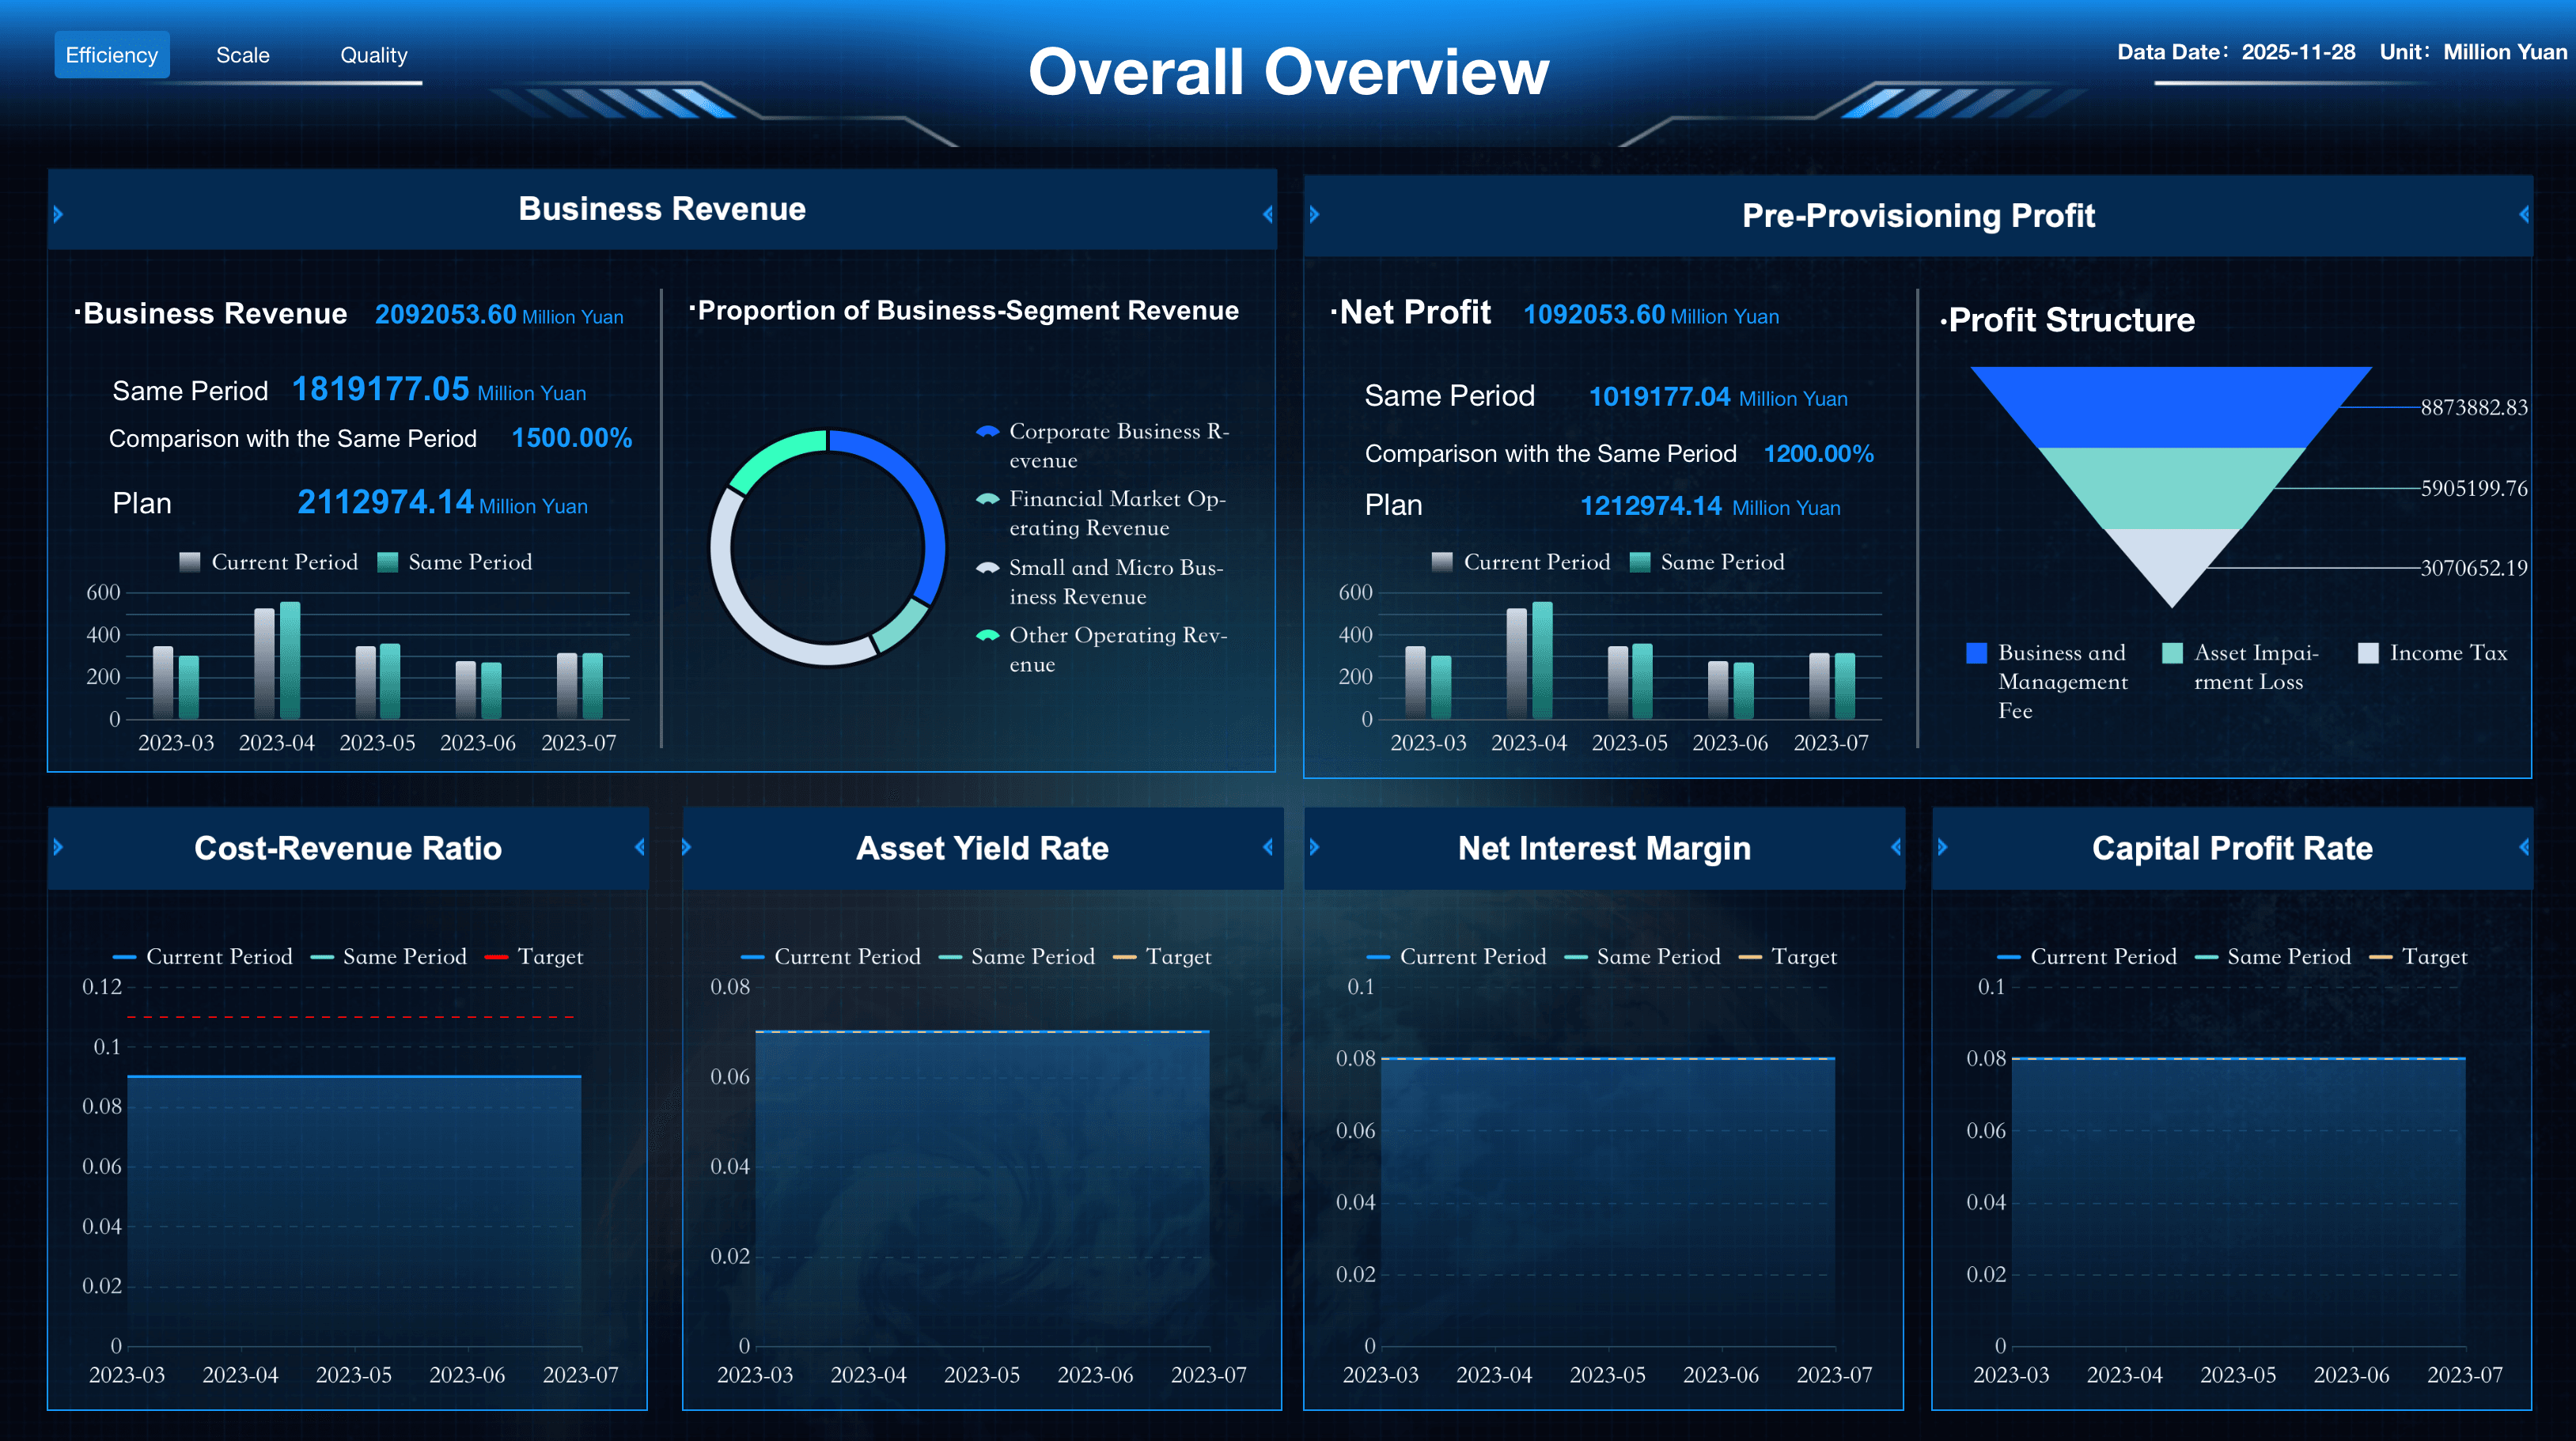
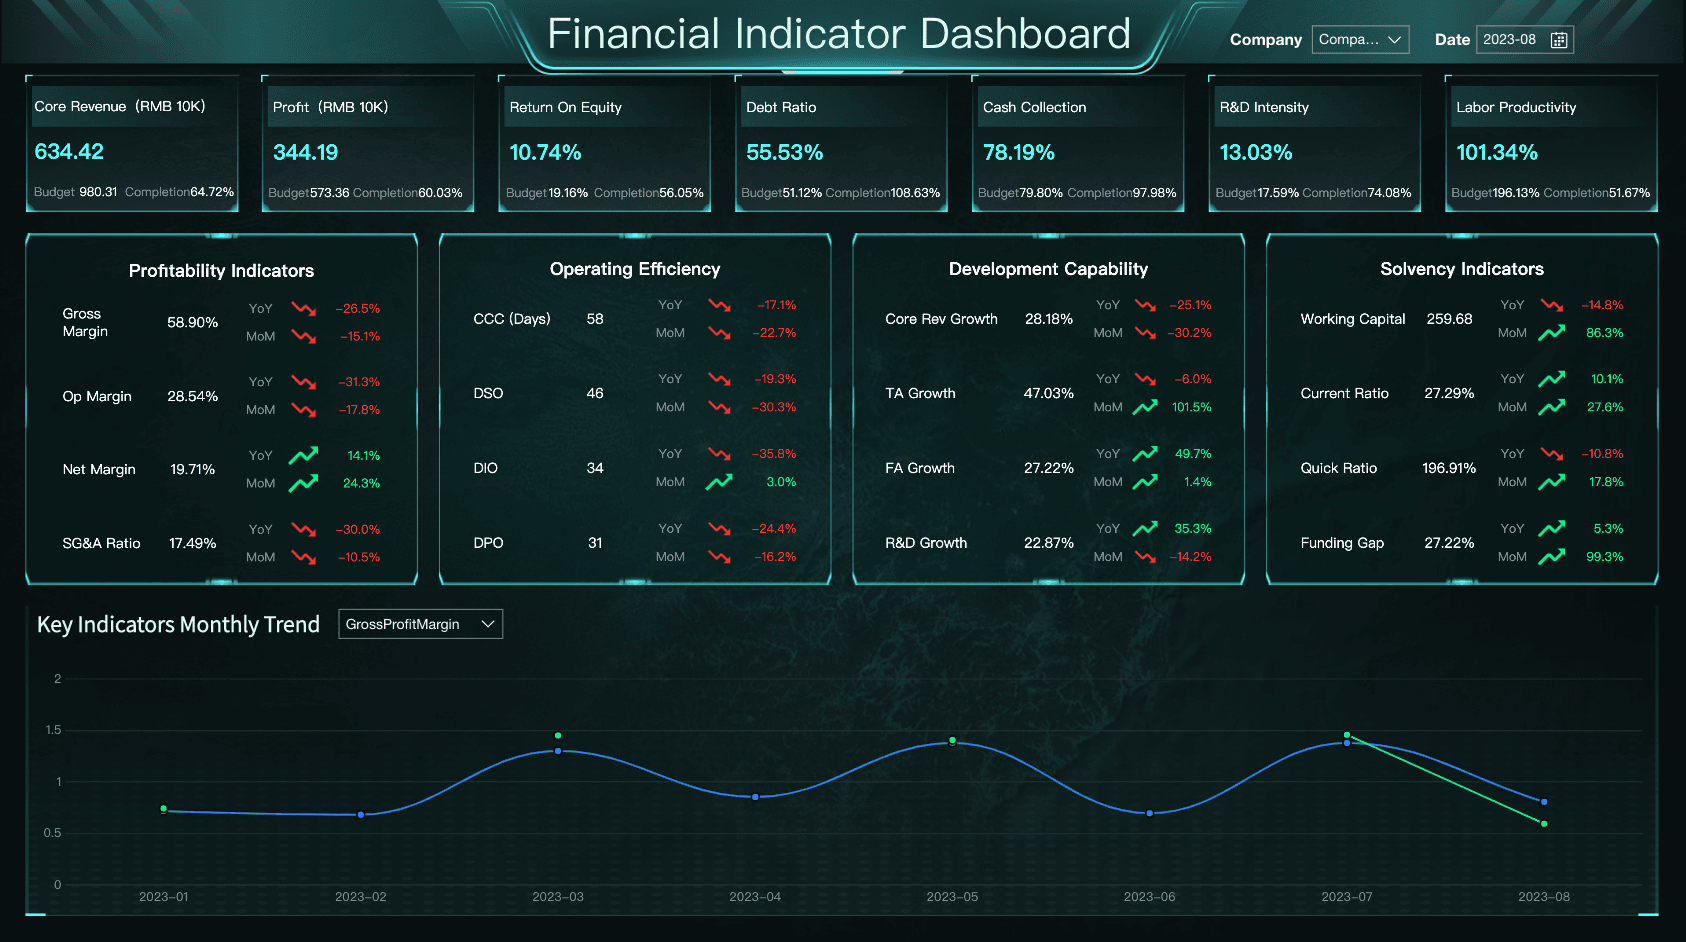
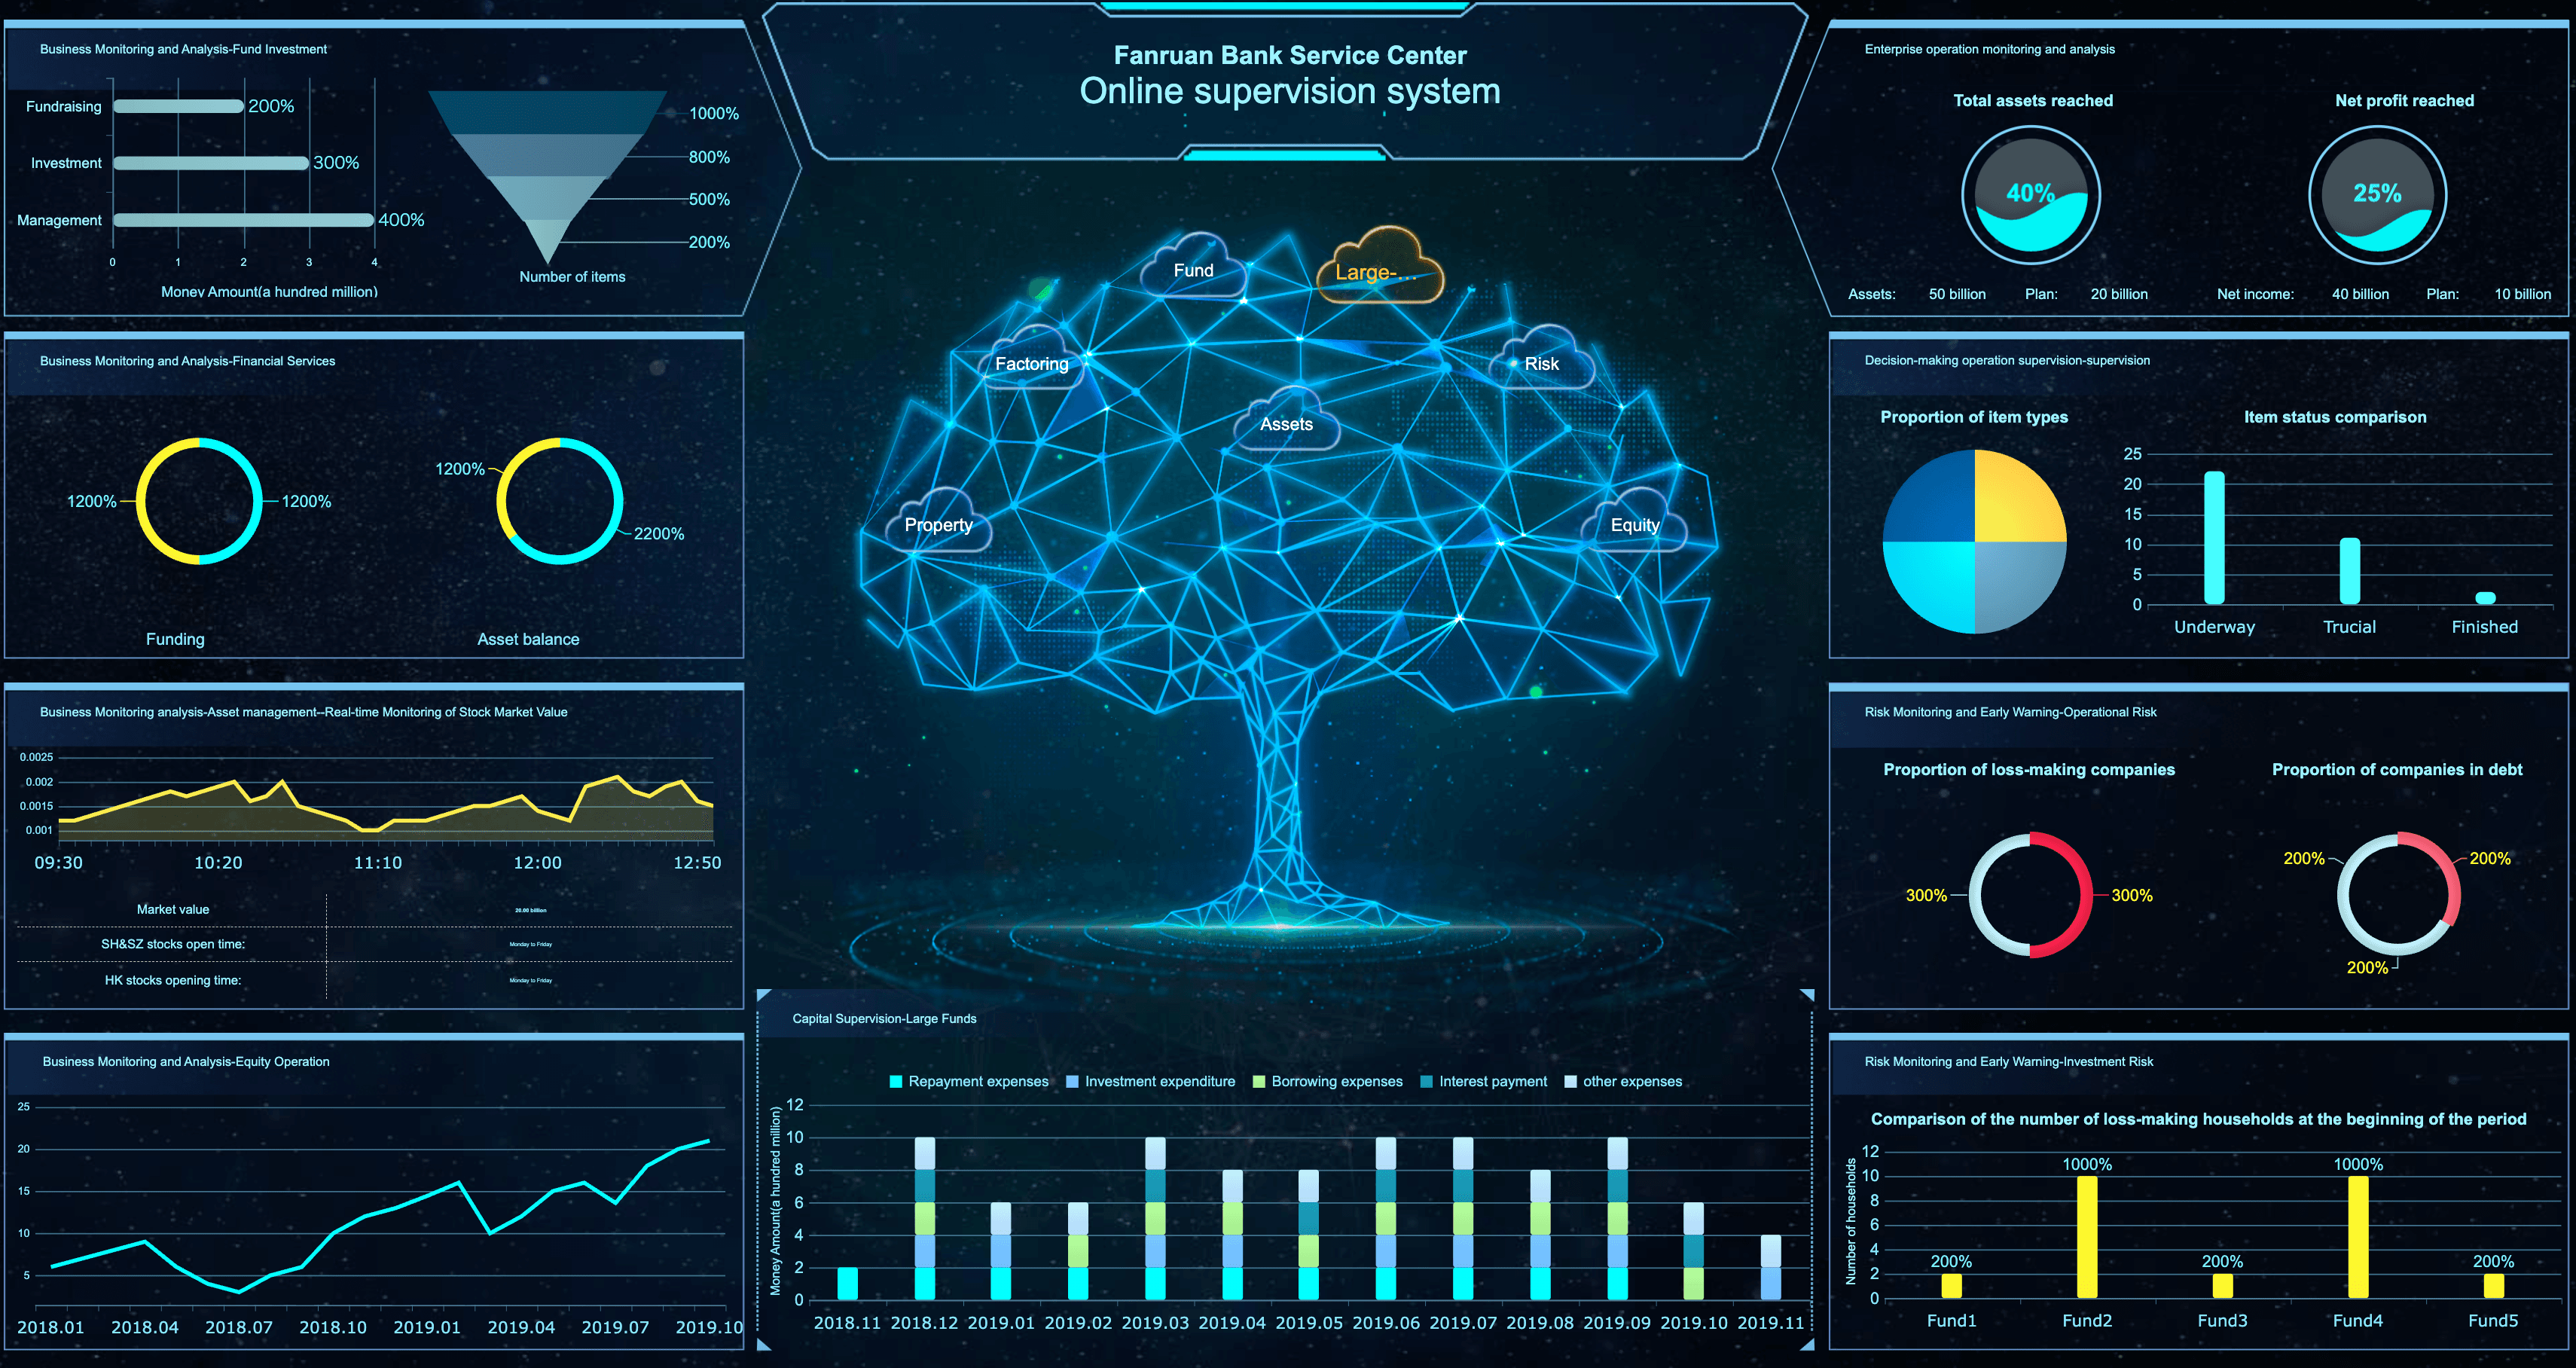
Financial Report Examples
Finance teams need reports that translate complex data into clarity. Below are the essential financial report examples:

FAQs
A financial report is a structured document that presents an organization's financial performance, position, and cash flows for a defined period. It typically includes an income statement, balance sheet, and cash flow statement, along with supporting schedules and narrative commentary. Financial reports serve both external stakeholders (investors, regulators, auditors) and internal users (executives, department heads) who need accurate, standardized data to assess organizational health and make informed decisions.
Core metrics vary by report type, but commonly include revenue, gross profit, operating income, net income, EBITDA, current ratio, debt-to-equity ratio, and free cash flow. For management reporting, budget variance, cost-per-unit, customer acquisition cost, and working capital days are equally critical. The right metric set depends on your industry and audience — always anchor selections to the specific decisions the report is meant to support.
A financial report is a periodic, structured document designed for historical analysis, compliance, and audit. A financial dashboard is a live, interactive interface designed for real-time monitoring and rapid response. Reports provide depth and context; dashboards provide speed and interactivity. Most organizations need both — reports for formal record-keeping and strategic review, dashboards for day-to-day financial management.
External users include investors, lenders, auditors, and tax authorities who rely on statutory reports for compliance and valuation. Internal users span CFOs and controllers (consolidated performance), department managers (budget adherence and cost control), and executives (strategic planning and capital allocation). Each group requires a different level of granularity, which is why layered reporting architectures — from executive summaries to detailed transaction-level schedules — are standard practice.
Start by clarifying the audience and the decisions the report must enable. Select only metrics that directly serve those decisions. Use consistent formatting and clear labeling so readers can navigate without guidance. Automate data collection from source systems to ensure accuracy and timeliness. Finally, establish a review cadence — gather user feedback quarterly and refine the report structure to match evolving business needs rather than letting it become a static artifact.
