
What Is a Marketing Dashboard?
Marketing Dashboard vs. Marketing Report
What's the difference between a marketing dashboard and a marketing report?
- Marketing dashboards represent how your marketing is performing against strategic objectives. By objectives, we mean specific business outcomes — such as quarterly pipeline contribution, target cost per acquisition, or brand awareness lift over a defined period.
- Marketing reports support your dashboards by detailing the tactical execution behind those outcomes. Reports measure individual campaign results, channel-level click-through rates, content engagement metrics, or weekly ad spend breakdowns.
Think of it this way: the dashboard tells you whether you're winning; the report tells you why.
More resources:
- Dive deeper on the question, "What is a dashboard?"
- Download interactive marketing dashboard templates
Don't just collect data. Visualize what matters.
Download the Dashboard Guide to learn:
- 10 essential steps to build effective dashboards
- How to choose the right charts and avoid visual clutter
- 15 top-notch dashboard templates for 2026

Why Are Marketing Dashboards Important?
Great dashboard design is how modern marketing teams move from gut-feel decisions to data-driven growth. Here are the biggest reasons why you need an effective marketing dashboard:
- Prove marketing ROI: Connect spend to revenue with unified attribution views. Show executives exactly which channels, campaigns, and content drive pipeline — and which don't.
- Optimize budget allocation in real time: Spot underperforming channels before they drain your budget. Shift spend toward what's working while there's still time to impact quarterly results.
- Align marketing with sales: Shared visibility into lead-to-revenue metrics ensures marketing and sales operate from the same playbook, reducing friction and accelerating deal velocity.
- Accelerate decision cycles: Replace weekly manual reporting with always-on dashboards. Your team spends less time pulling data and more time acting on insights.
- Hold teams accountable: Track campaign owners, channel managers, and agency partners against clear, visible targets. Transparency drives performance.
Types of Marketing Dashboards
Marketing dashboards serve different audiences and time horizons. Choosing the right type ensures each stakeholder sees what matters most.
- Strategic Marketing Dashboards: Executive-level views that monitor long-term marketing contribution to revenue, brand equity trends, and annual plan progress. CMOs and VPs use these to report to the board and guide resource allocation across quarters.
- Operational Marketing Dashboards: Real-time monitoring of active campaigns, daily lead volume, ad spend pacing, and channel performance. Marketing managers use these to catch issues early, rebalance budgets mid-flight, and keep teams on track against monthly targets.
- Analytical Marketing Dashboards: Deep-dive interfaces for exploring historical trends, multi-touch attribution models, cohort behavior, and segment-level conversion patterns. Analysts and growth marketers use these to uncover hidden opportunities and inform future strategy.
- Channel-Specific Dashboards: Focused views for individual marketing channels — paid search, social media, email, SEO, content marketing, or events. Channel owners use these to optimize tactics within their domain while staying connected to overall marketing goals.
How to Build a Marketing Dashboard
- Define the audience and the decision. Start with who will use the dashboard and what decision they need to make. A CMO needs revenue attribution; a paid media manager needs daily ROAS. Design backward from the decision, not forward from available data.
- Select metrics that map to business outcomes. Every metric on the dashboard should trace directly to a strategic goal. Apply the SMART framework: Specific, Measurable, Attainable, Realistic, and Time-bound. Examples include "cost per qualified lead by channel per month" or "marketing-sourced pipeline vs. target by quarter."
- Unify your data sources. Marketing data lives in dozens of platforms. Connect your dashboard to a centralized data layer — whether a warehouse, integration platform, or BI tool — so metrics are consistent, current, and trustworthy.
- Design for clarity, not comprehensiveness. Resist the urge to show everything. Prioritize the 5–8 metrics that matter most. Use familiar chart types (line for trends, bar for comparisons, funnel for conversion), and place the most critical KPIs above the fold.
- Iterate based on usage. Track which visualizations your team actually uses. Remove what's ignored, refine what's unclear, and add new metrics as your strategy evolves. A dashboard that doesn't change is a dashboard that's dying.
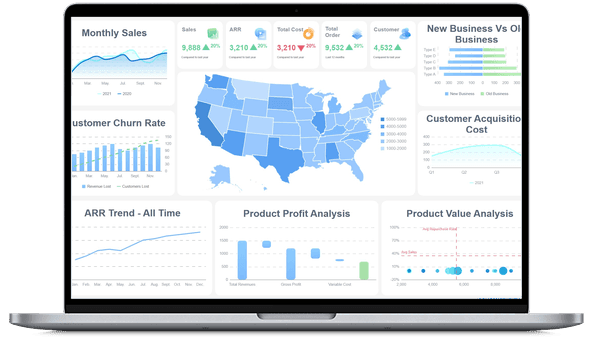
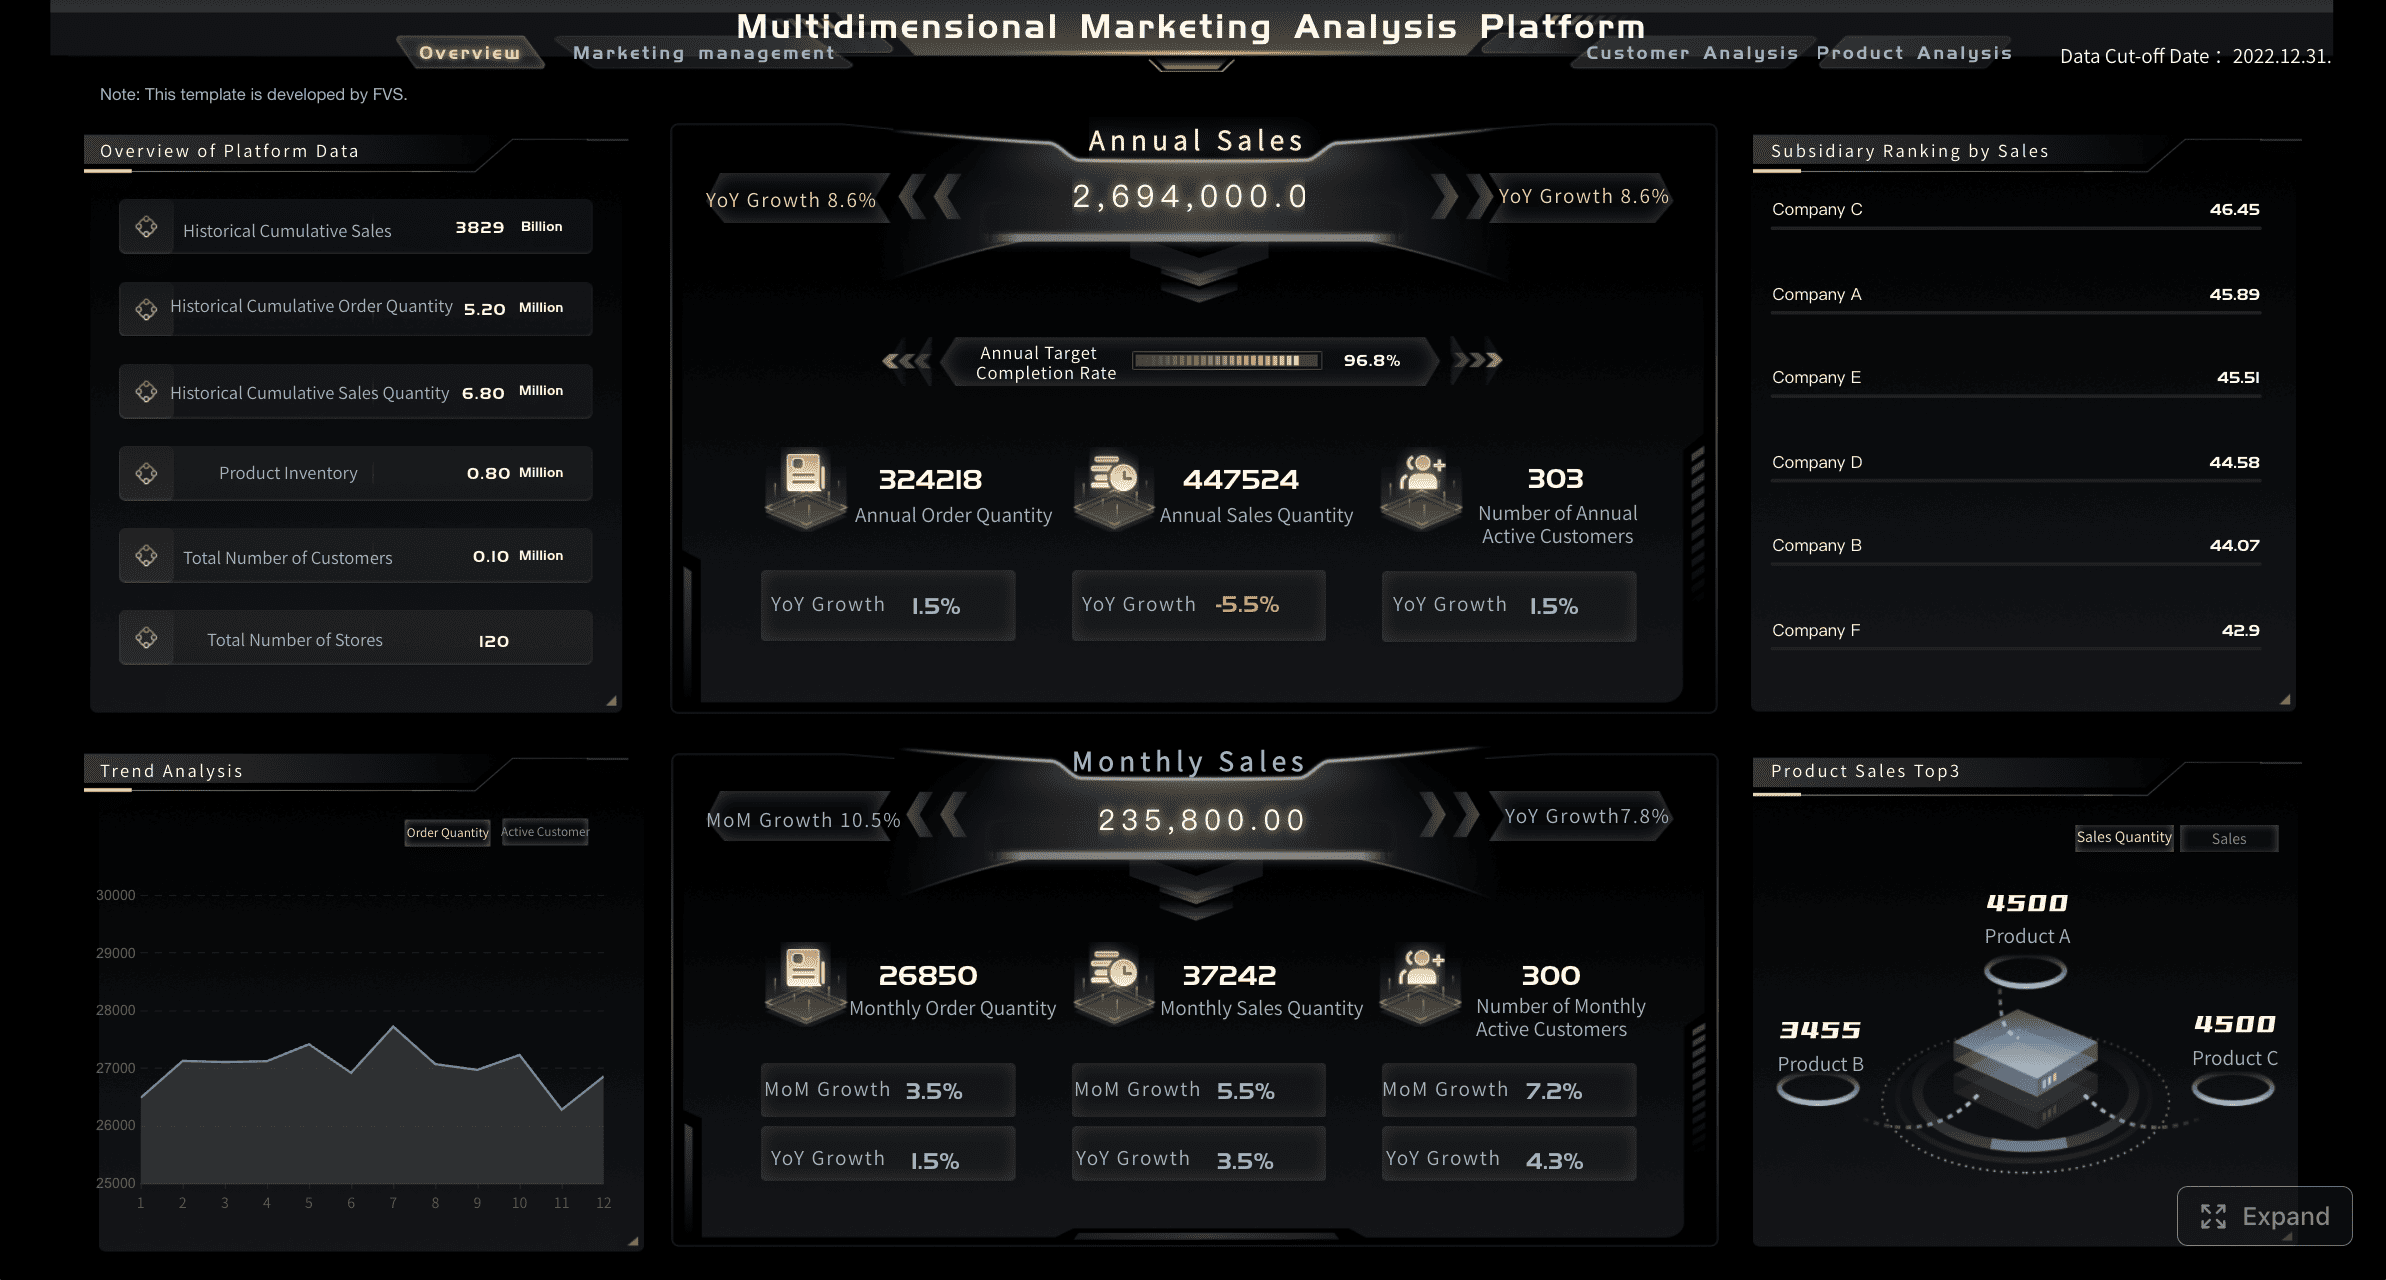
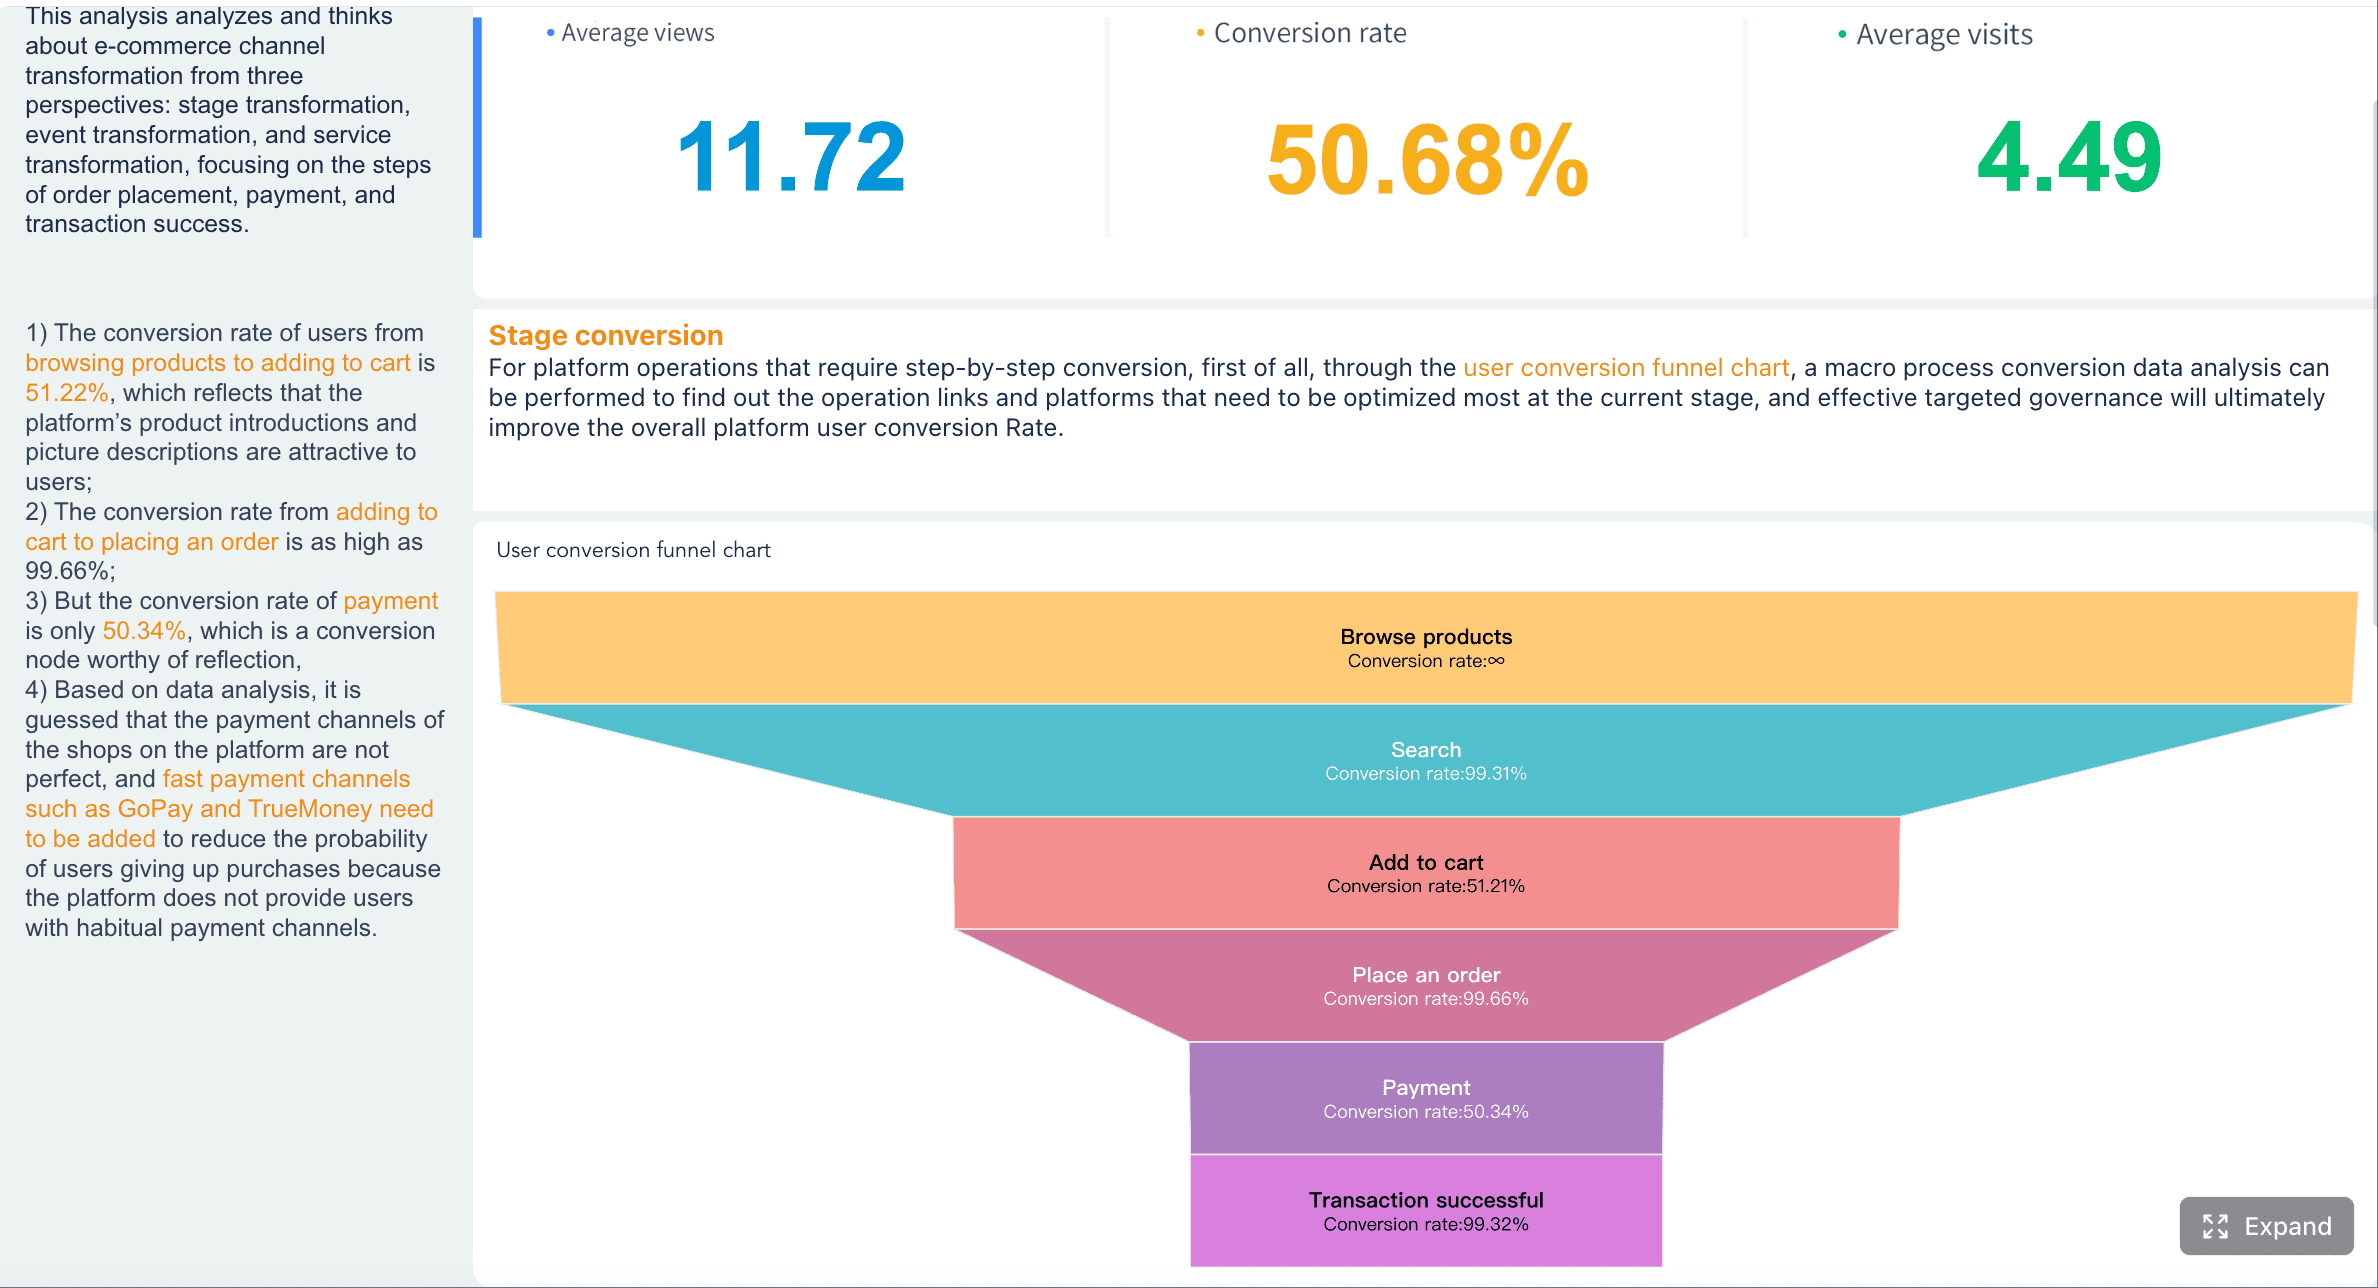
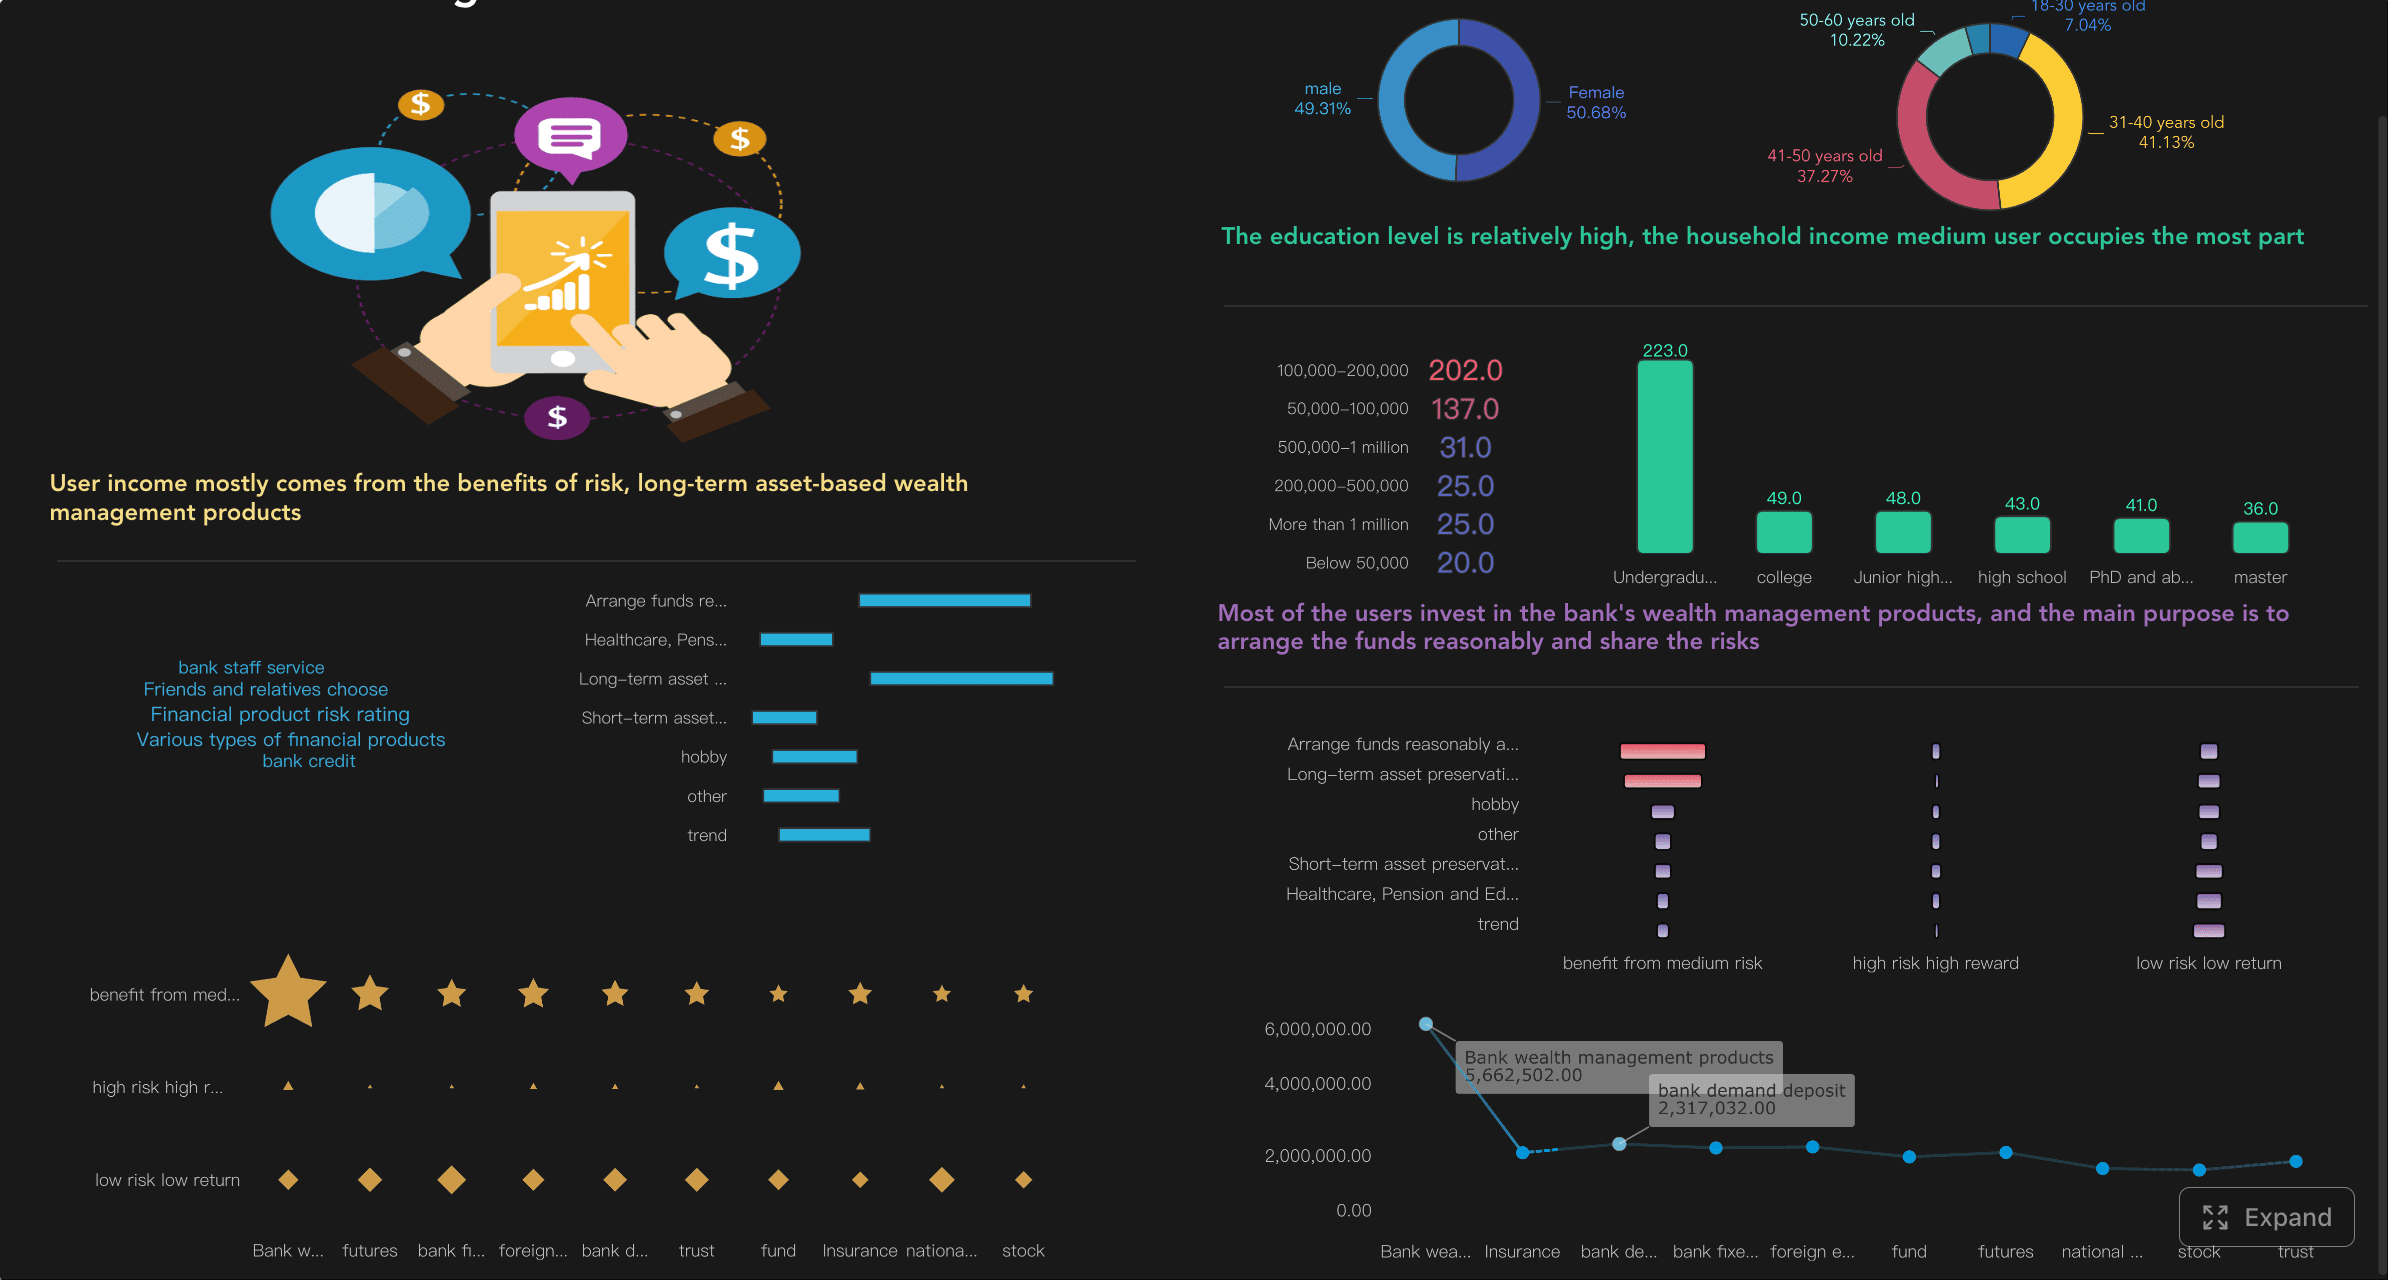
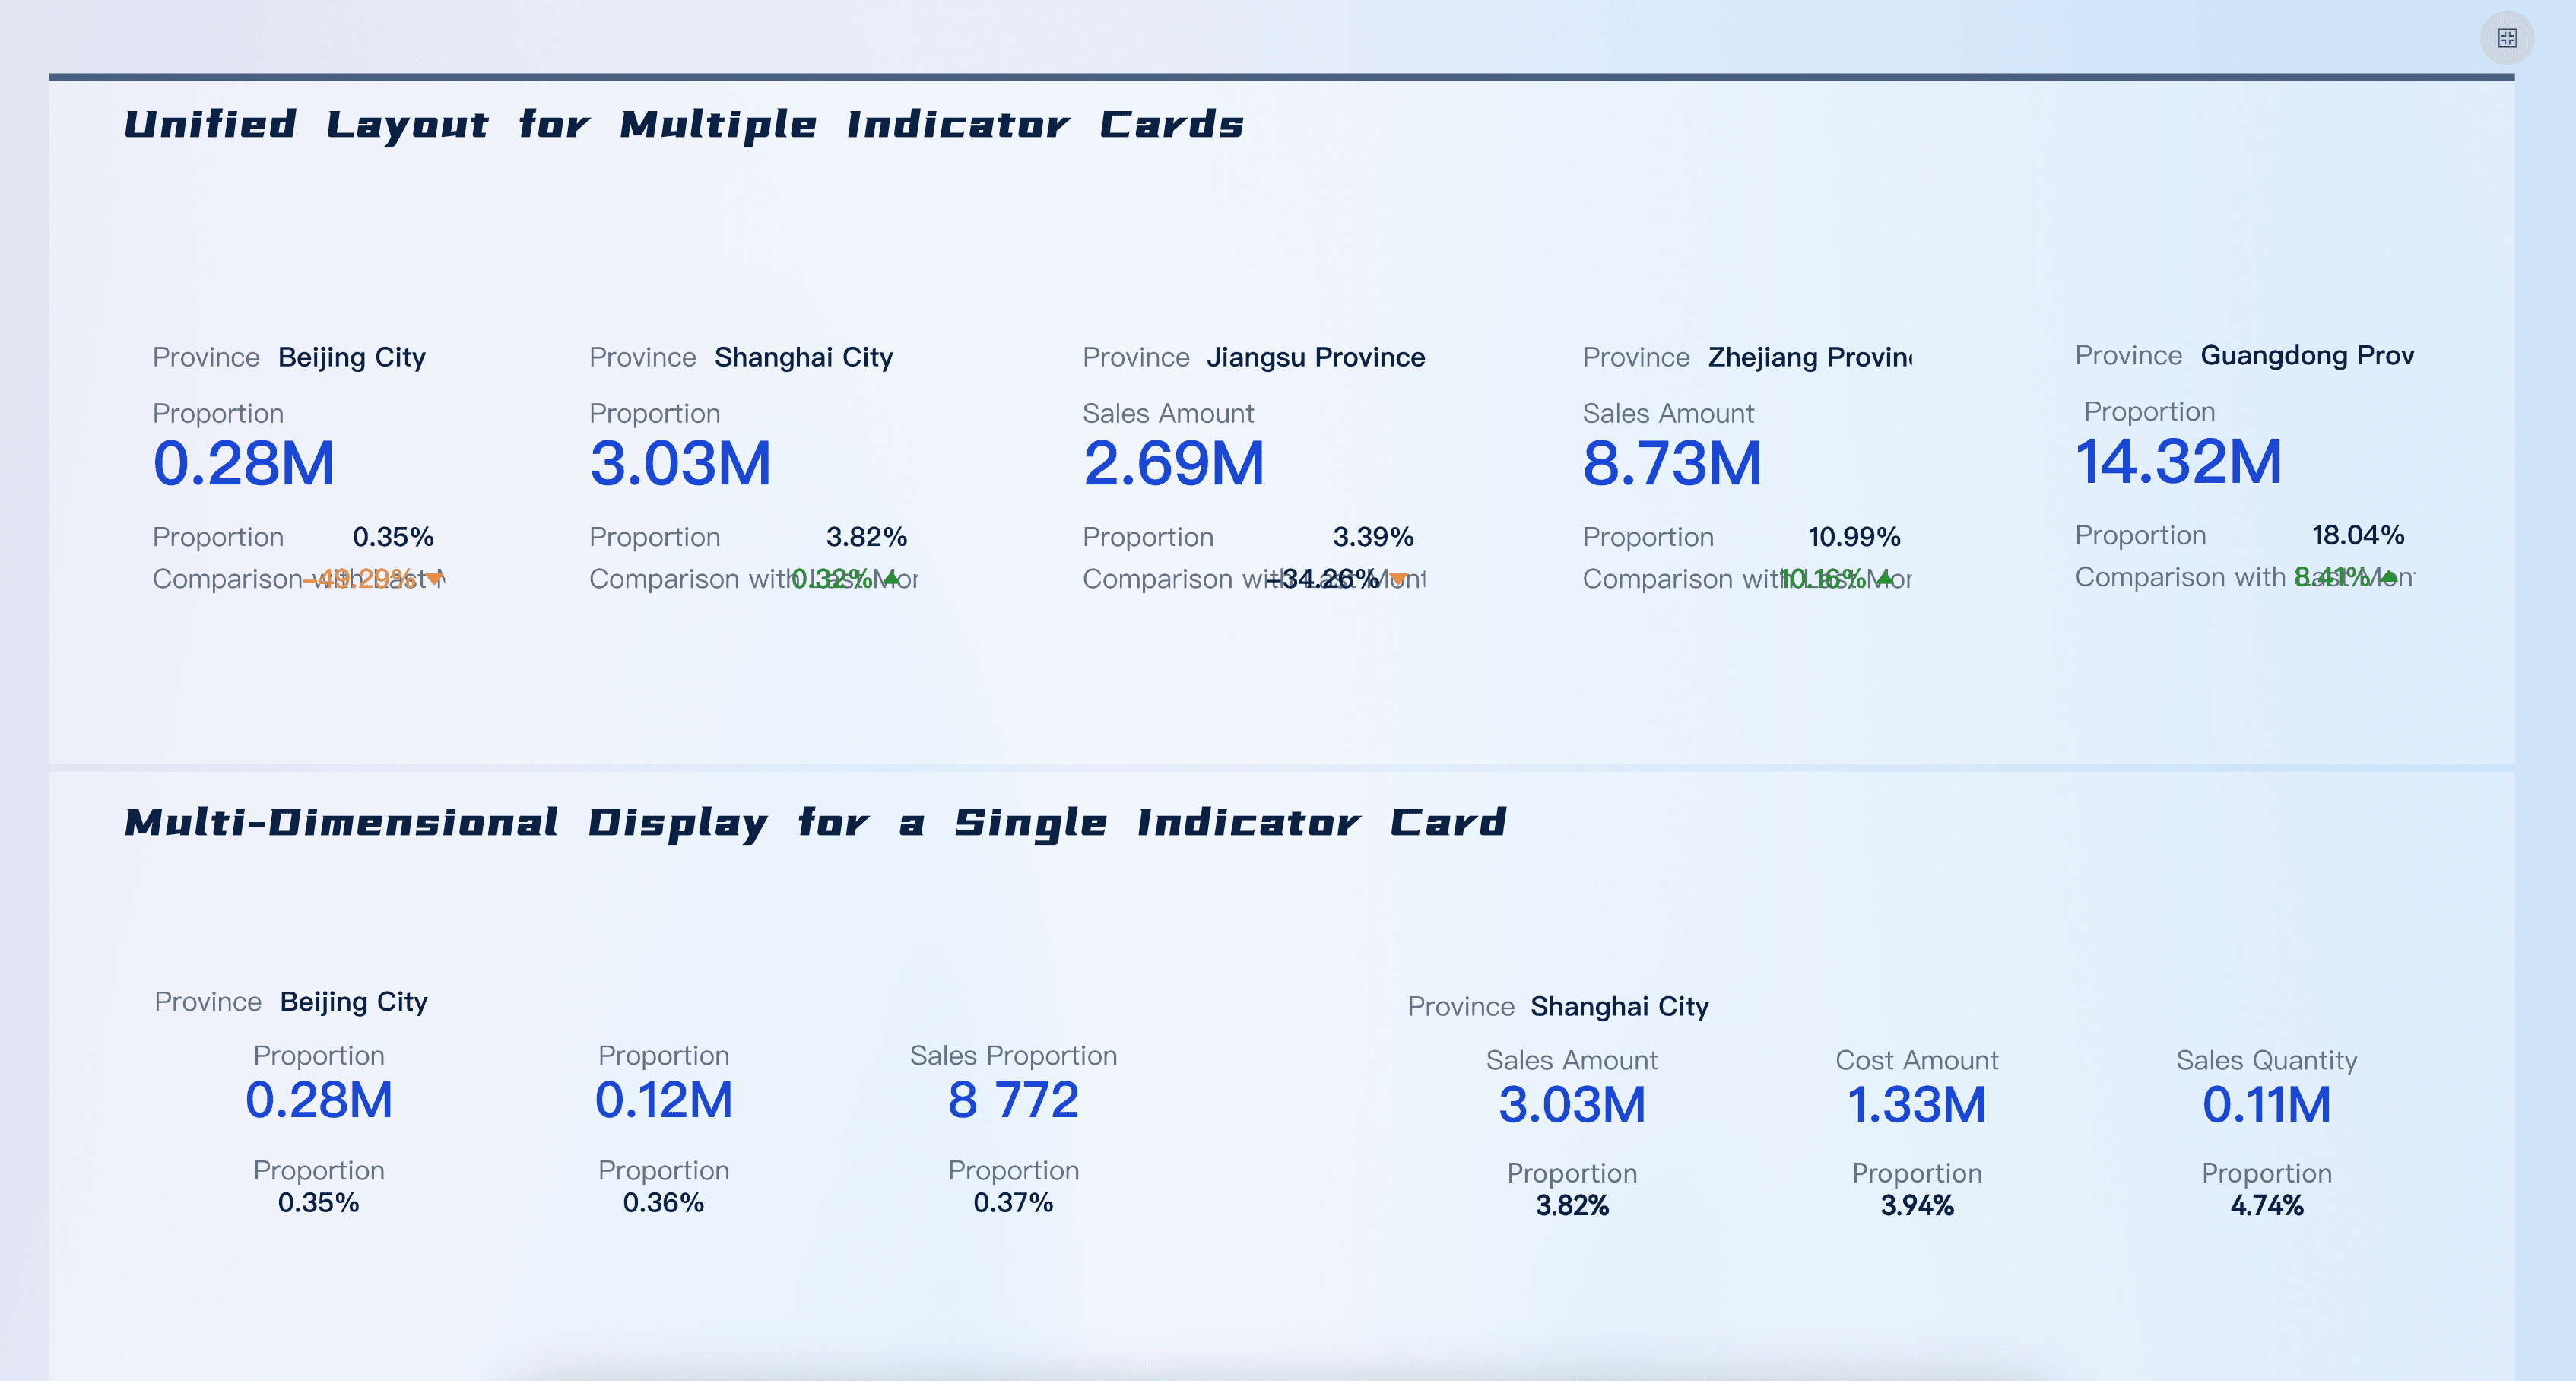
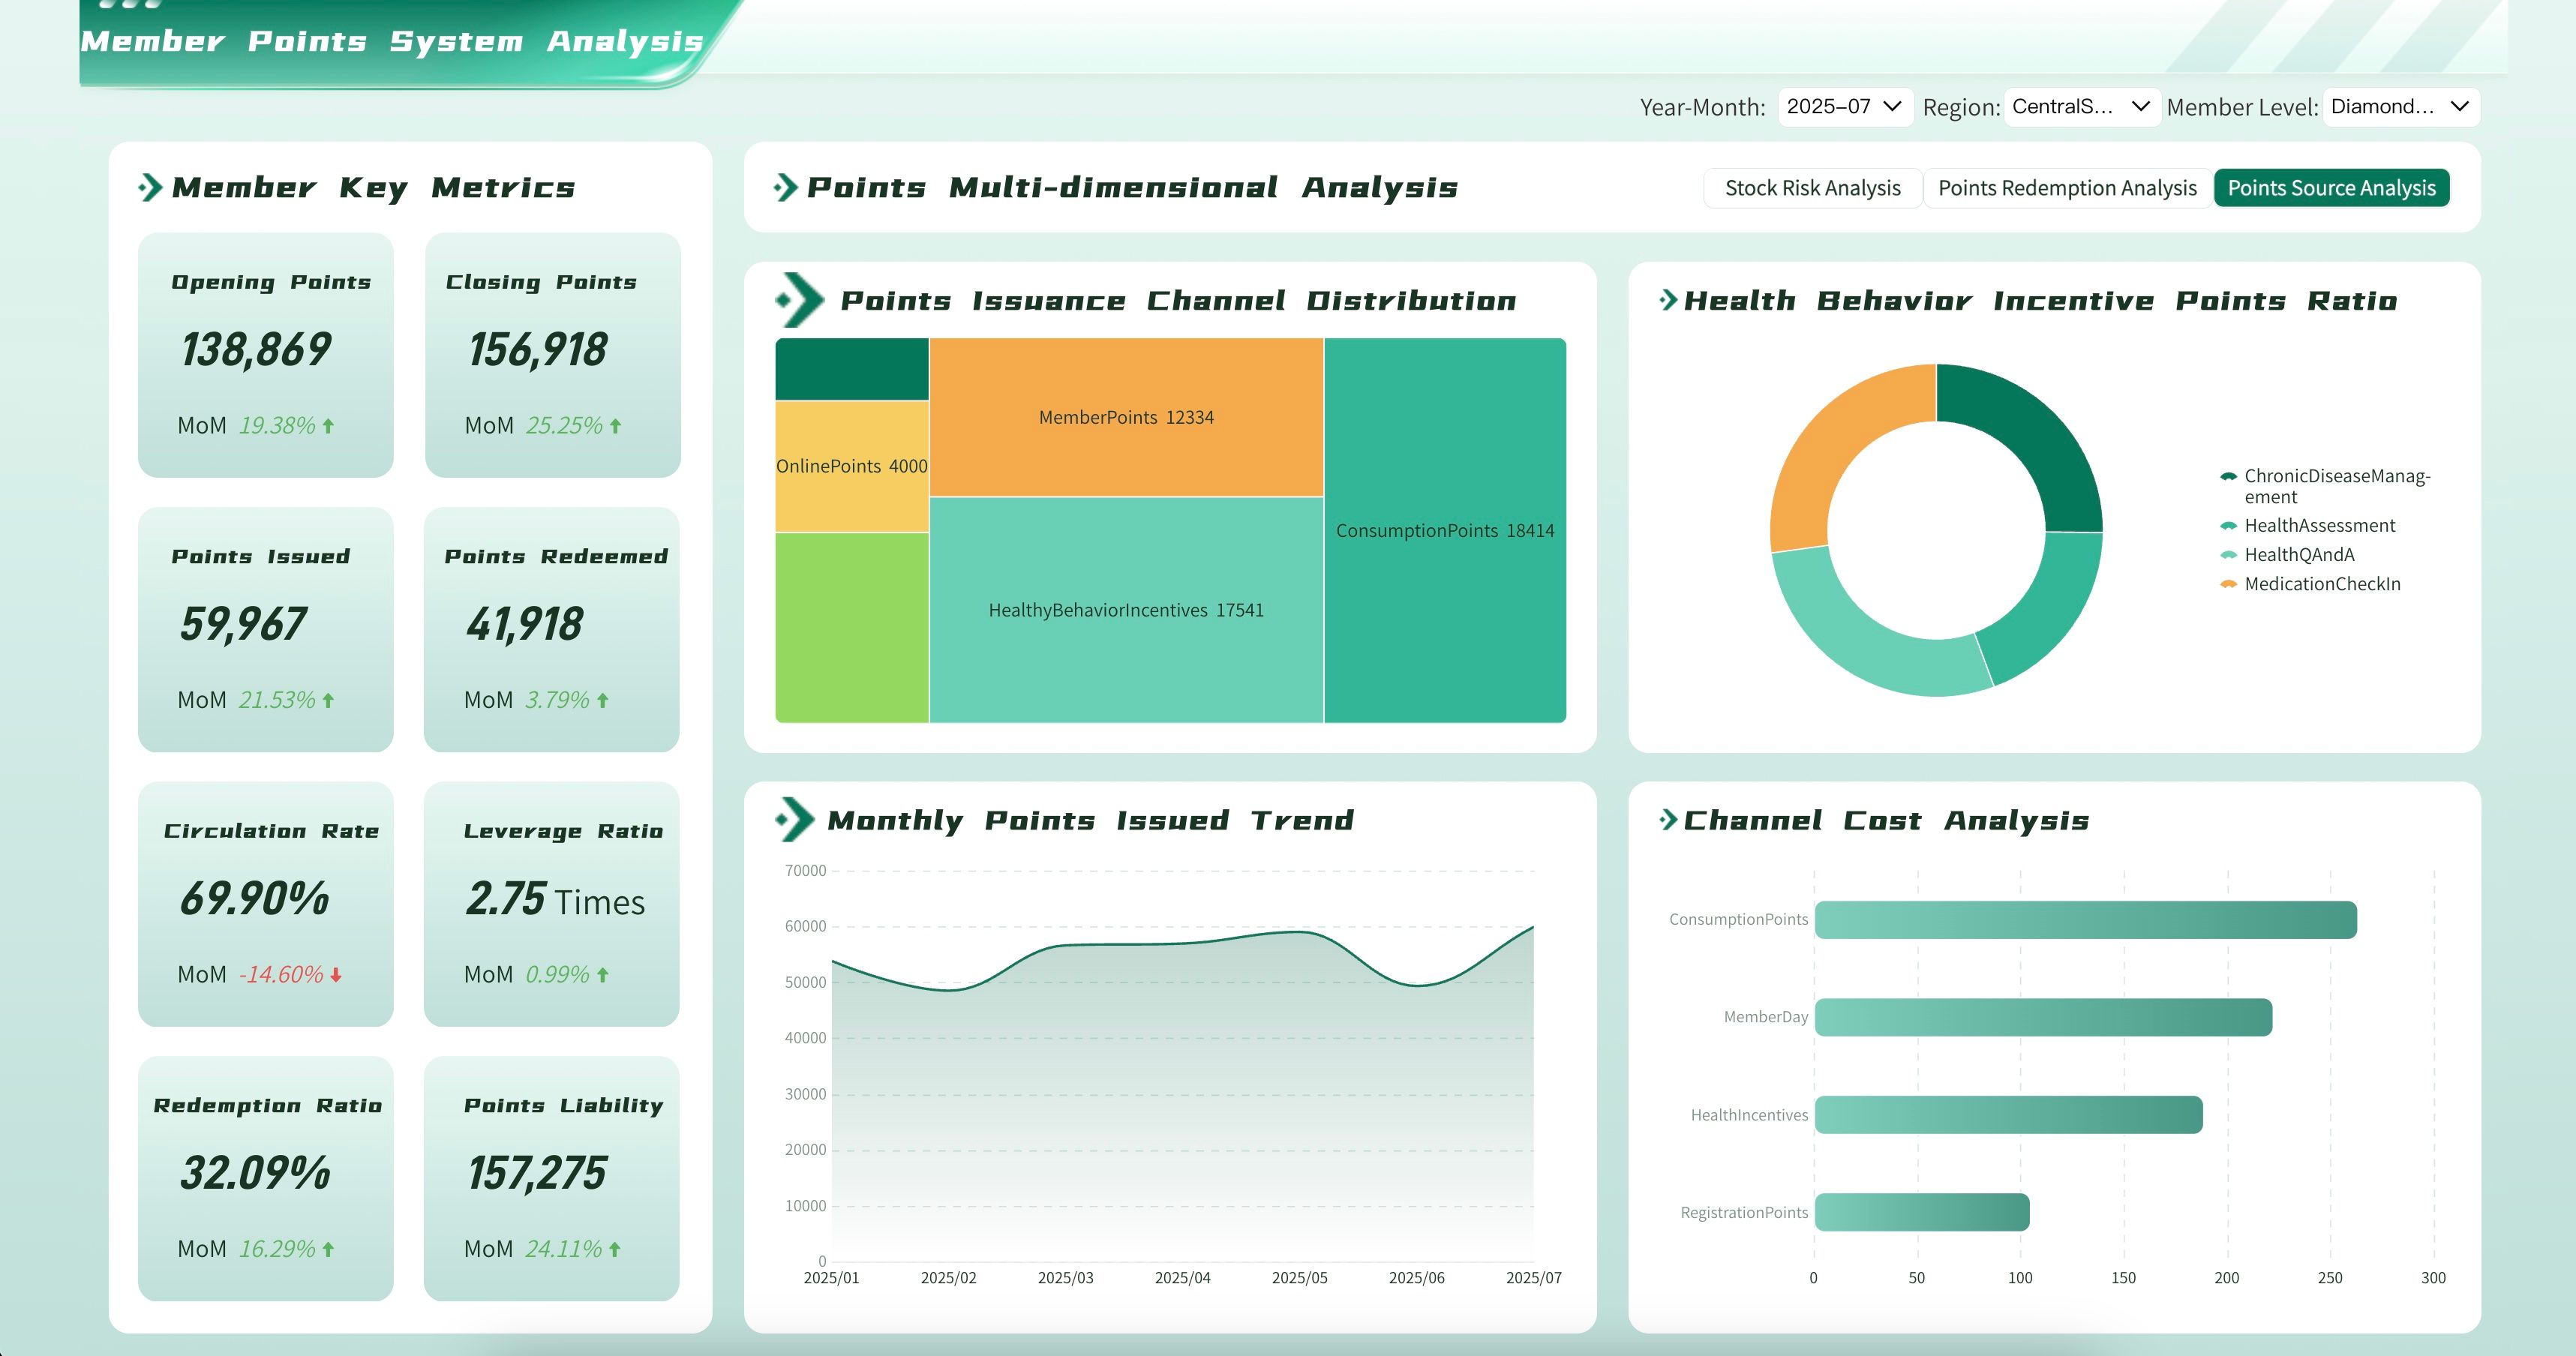
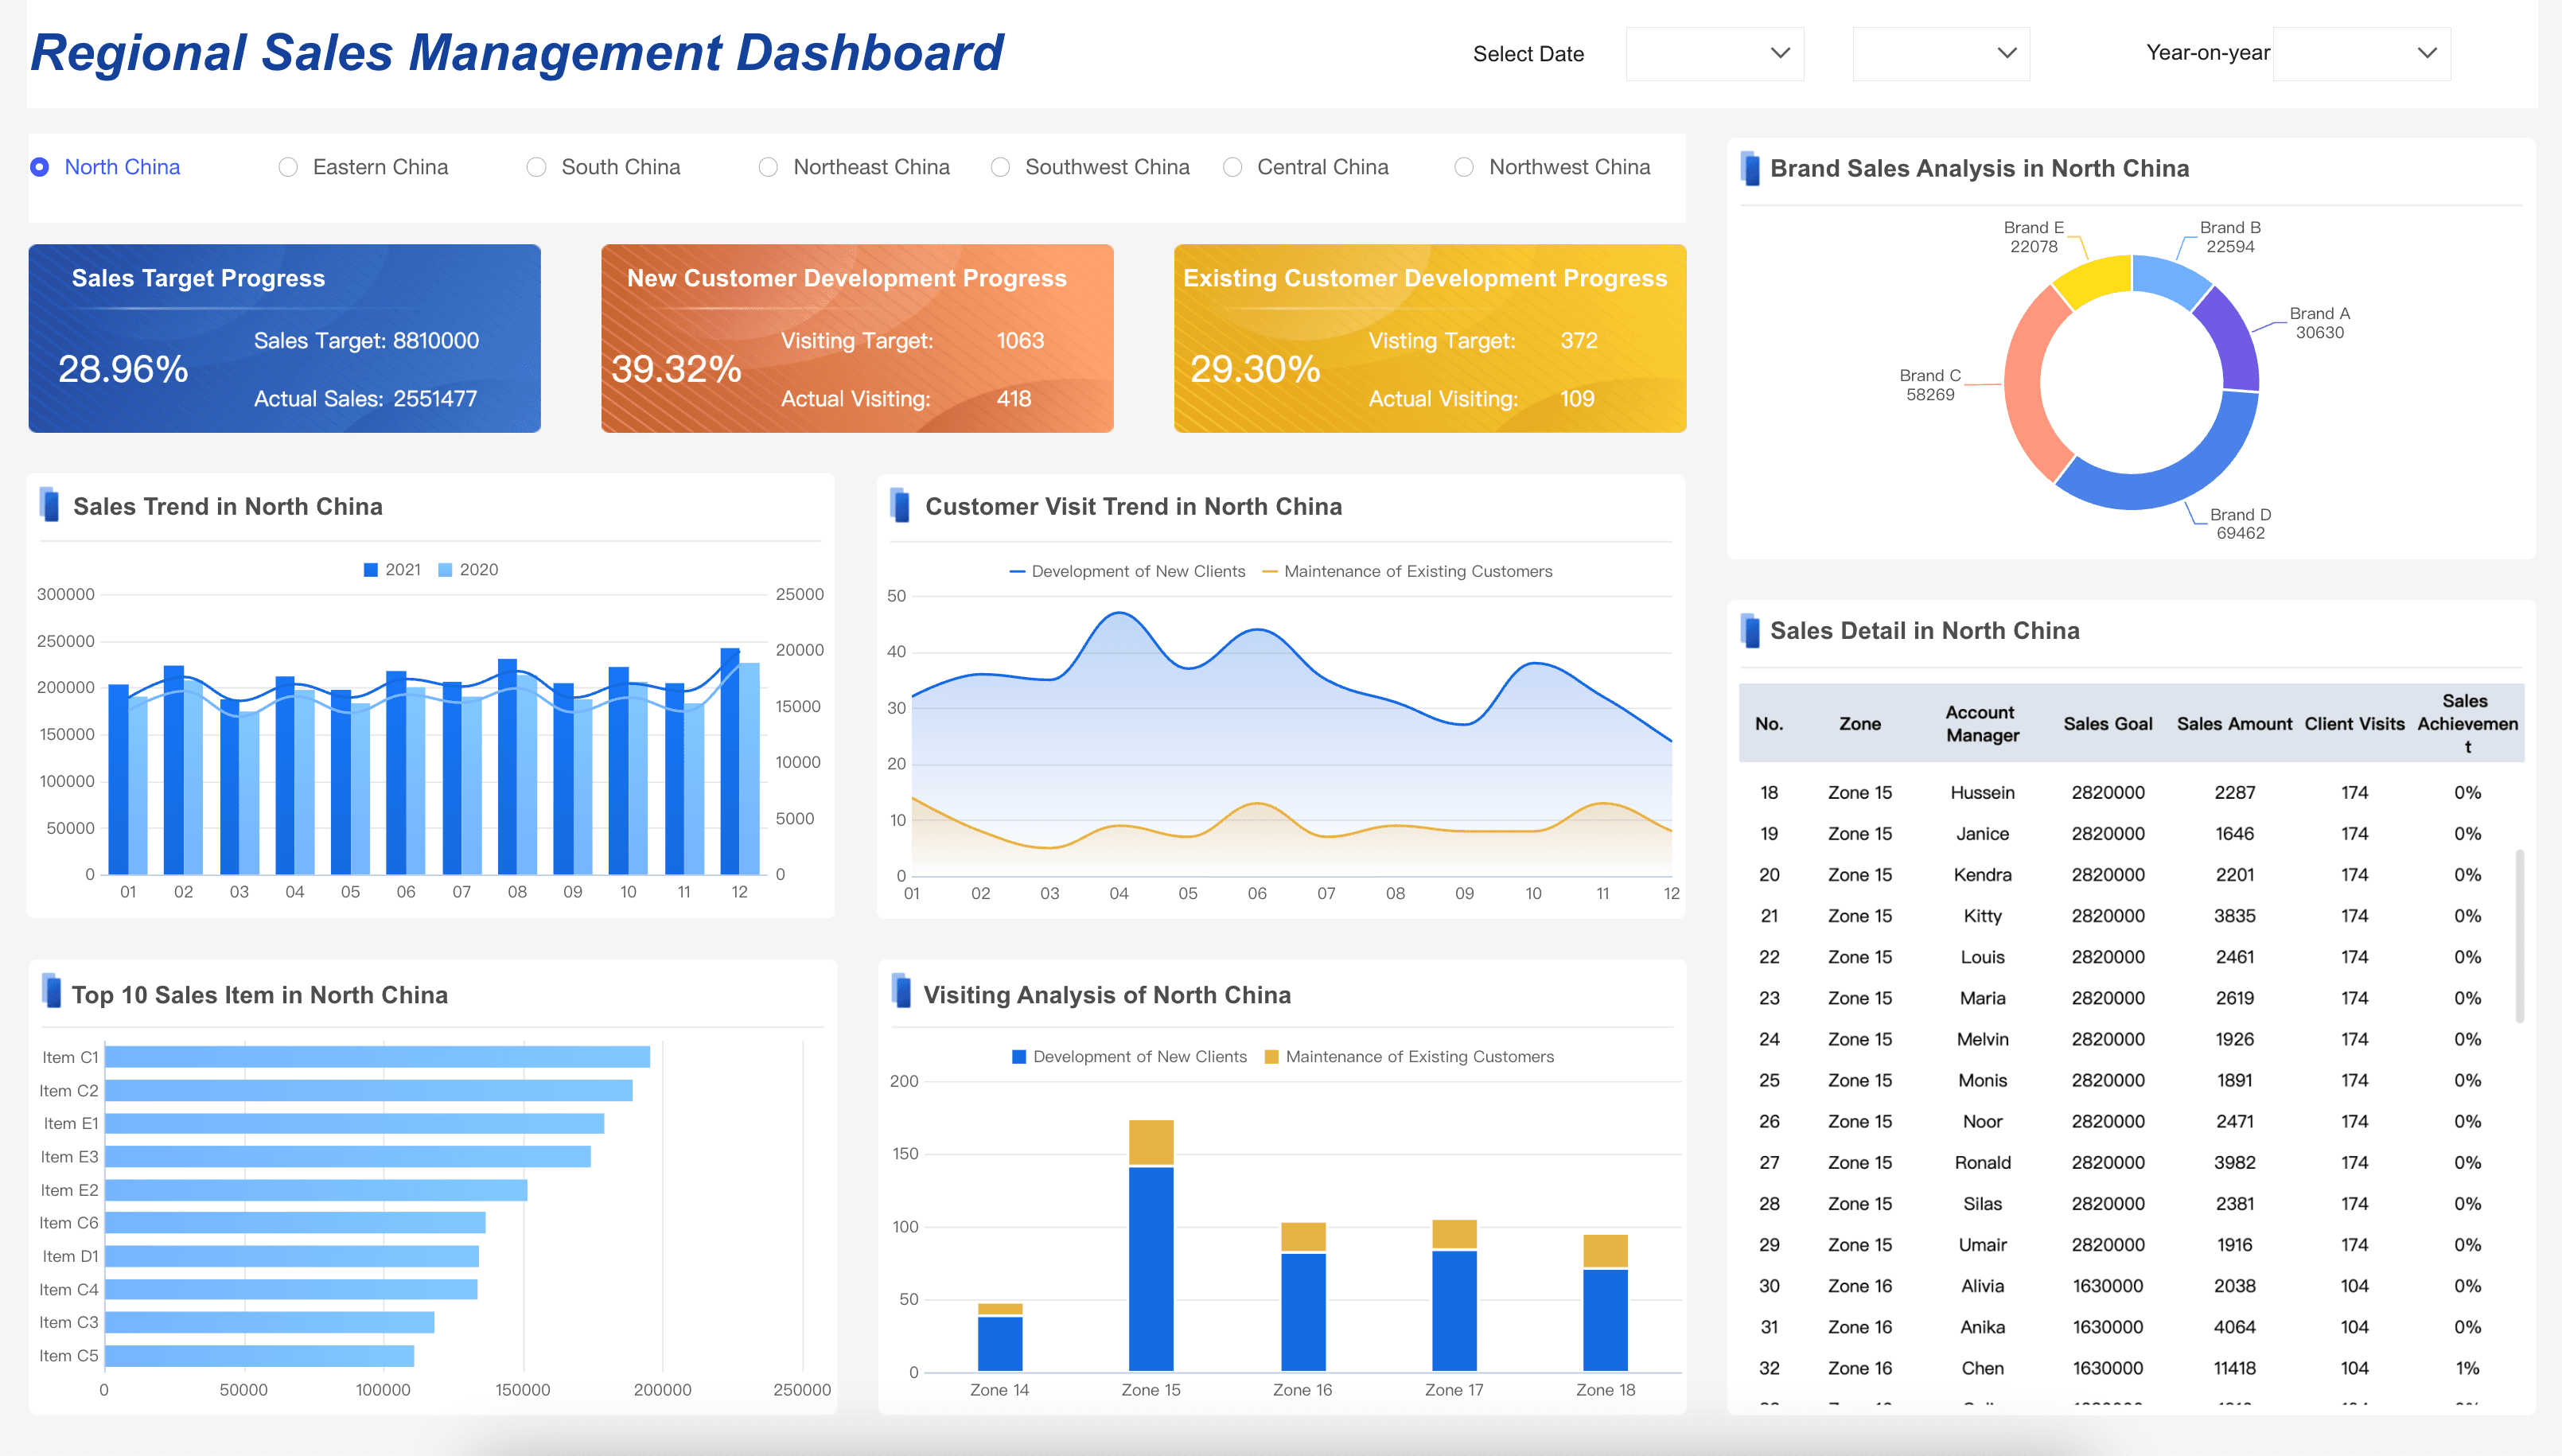
Marketing Dashboard Examples
Marketing leaders need to track the KPIs that connect effort to revenue. Below are the essential marketing dashboard examples:
FAQs
A marketing dashboard is a visual reporting tool that consolidates your most important marketing metrics and KPIs into a single, real-time interface. It gives marketing leaders, managers, and specialists an instant overview of campaign performance, channel ROI, lead generation, budget utilization, and progress against strategic goals — eliminating the need to manually pull data from multiple platforms. By centralizing this information, a marketing dashboard helps teams make faster decisions, justify spend, and align marketing activity with business outcomes.
The most valuable marketing dashboard metrics typically include marketing-sourced revenue, return on marketing investment (ROMI), cost per acquisition (CPA), lead-to-customer conversion rate, pipeline value by source, and channel-level ROAS. Engagement metrics such as website traffic, email open rates, and social impressions are useful for top-of-funnel visibility. The right mix depends on your business model — a B2B SaaS company will prioritize pipeline and attribution metrics, while a DTC e-commerce brand will focus on ROAS, CAC, and lifetime value. Always tie your metric selection back to the specific decisions your team needs to make.
A marketing dashboard is a live, interactive view designed for continuous monitoring — marketing leaders check it daily or even hourly to track real-time performance and respond quickly to changes. A marketing report is a structured, historical document produced on a scheduled basis, such as weekly or monthly, to provide deeper analysis of trends, campaign post-mortems, and forecasts. Think of the dashboard as your day-to-day command center and the report as your periodic deep dive.
Marketing dashboards are valuable at every level of a marketing organization. CMOs and VPs use strategic dashboards to monitor overall marketing contribution to revenue and report to executive leadership. Marketing managers rely on operational dashboards to track campaign pacing, manage budgets, and coach team members. Channel specialists use focused dashboards to optimize paid media, SEO, email, or content performance. Sales and finance stakeholders also benefit from shared marketing dashboards that provide transparency into lead quality, pipeline contribution, and spend efficiency. The key is to tailor the view and metrics to the specific decisions each user needs to make.
Start by identifying the audience and defining the specific marketing questions the dashboard needs to answer. Then select only the metrics that directly reflect progress toward marketing and business goals — resist the temptation to include every available data point. Choose clear, familiar visualizations such as line charts for trends, bar charts for comparisons, and funnels for conversion flows, and make sure the layout puts the most critical KPIs front and center. Connect your dashboard to automated, reliable data sources so it stays current without manual updates, and revisit the design regularly as your marketing strategy evolves.
Yes. FineReport supports complex data integration from multiple marketing platforms (ad networks, CRM, GA4, email tools, etc.) and enables pixel-perfect, real-time dashboards with drill-down capabilities. FineBI adds self-service analytics, allowing marketing analysts to explore data independently without IT dependency. Both tools support automated refresh, role-based access, and mobile viewing — making them suitable for strategic, operational, and analytical marketing dashboards alike.
