
What is Customer Analytics?
Customer Analytics vs. Customer Reporting
Customer analytics and customer reporting are related, but they are not the same job.
Customer reporting usually has a fixed audience, cadence, and structure. A weekly customer service report may summarize ticket volume, response time, resolution rate, satisfaction, and open escalations. A monthly customer growth report may cover new customers, repeat purchase, retention, churn, customer lifetime value, and expansion revenue.
Customer analytics is broader. It includes the investigation behind the report. It asks why a segment stopped buying, whether a support delay affected renewal, which acquisition channels bring loyal customers, whether product usage predicts retention, and whether a revenue change came from customer volume, order value, frequency, pricing, lifecycle mix, or churn.
The two should work together. Use reporting to create a shared customer performance story. Use analytics to test that story, find the drivers, and make the next report more useful. For example, CRM reporting can standardize pipeline and customer communication updates, while customer analytics helps teams investigate whether changes came from lead quality, onboarding friction, service response, account health, product usage, or renewal timing.
Customer analytics also differs from a general analytics dashboard. A dashboard can monitor any business area. Customer analytics focuses specifically on customer identity, behavior, value, experience, lifecycle movement, and relationship health.
Why Customer Analytics Matters
Most companies do not lack customer data. They lack connected data, shared definitions, and a clear path from customer signal to business action.
Without customer analytics, each team sees a partial version of the customer. Marketing sees campaigns and traffic. Sales sees opportunities and accounts. Support sees tickets. Product sees usage. Finance sees revenue and invoices. Customer success sees health scores and renewals. Ecommerce sees orders and baskets. Customer analytics connects these views so teams can discuss the same customer reality.
Strong customer analytics helps teams:
- Understand customer segments: Compare customers by lifecycle stage, region, product, account size, purchase frequency, channel, industry, behavior, value, or risk.
- Improve acquisition quality: See which channels and campaigns bring customers who retain, repeat, expand, or generate healthy margin.
- Diagnose conversion problems: Find where prospects or customers drop off across visit, signup, trial, quote, purchase, onboarding, renewal, or support journeys.
- Increase retention and loyalty: Use cohort views, RFM logic, usage patterns, service history, and loyalty activity to identify repeat-purchase drivers and churn risks.
- Improve customer experience: Connect support response, complaint themes, survey scores, product usage, and service-level changes to customer outcomes.
- Support personalization responsibly: Use segment insight to tailor offers, education, outreach, and service without relying on disconnected assumptions.
- Reduce manual reporting work: Replace repeated exports with governed data connections, reusable dashboards, scheduled reports, and consistent definitions.
- Create better operating meetings: Give teams a shared view of what changed, why it matters, who owns the next step, and what will be reviewed next.
The practical value is not "more customer data." The value is fewer unresolved questions in customer growth meetings: what changed, which customers are affected, why it may have happened, and what action is worth testing.
Don't just collect customer data. Visualize what matters.
Download the KPI Dashboard Guide to strengthen your customer analytics foundation:
- 10 essential steps to turn customer goals into measurable KPI views
- How to choose the right charts for segments, cohorts, funnels, and customer value
- How to avoid visual clutter when customer data comes from many systems
- 15 top-notch dashboard templates for 2026

Types of Customer Analytics
Customer analytics is often described in four levels. Most teams need all four, but they do not need to build every level at once. Start with the customer decision that repeats most often, then add deeper analysis as the data foundation becomes trusted.
Descriptive customer analytics
Descriptive analytics explains what happened. It is the foundation for customer dashboards, service reports, retention summaries, ecommerce reviews, and executive customer updates.
Common examples include:
- New customers, active customers, returning customers, and lost customers
- Customer acquisition, activation, conversion, repeat purchase, renewal, and churn
- Average order value, purchase frequency, customer lifetime value, and revenue by customer segment
- Support ticket volume, response time, resolution time, backlog, SLA attainment, CSAT, and NPS
- Web visits, product usage, app events, feature adoption, session frequency, and engagement
- Loyalty enrollment, point activity, redemption rate, member tier movement, and referral activity
- Customer profile fields such as industry, company size, region, channel, product, plan, or lifecycle stage
Descriptive analytics is useful when the question is, "What changed?" It becomes more useful when users can drill from a top-level metric to the customer segment, cohort, product, channel, region, account owner, journey stage, or support reason behind the number.
Diagnostic customer analytics
Diagnostic analytics explains why something happened. It connects top-level customer KPIs to the drivers behind them.
Use diagnostic analytics when you need to know:
- Why did repeat purchase fall in one customer segment?
- Why did high-value customers contact support more often this month?
- Why did conversion rise but customer lifetime value fall?
- Why did churn increase after onboarding or implementation?
- Why did one region's customer satisfaction score decline?
- Why did a loyalty campaign attract signups but not repeat purchases?
Good diagnostic analysis needs context. A churn chart alone may not explain whether the issue came from pricing, onboarding, product fit, service delay, account handoff, competitor pressure, data quality, or a definition change.
Predictive customer analytics
Predictive analytics estimates what may happen next. In customer analytics, it can support churn prediction, next-best-action scoring, lead quality scoring, upsell propensity, service risk detection, customer lifetime value forecasting, and demand planning.
Examples include:
- Estimating which customers are likely to churn or downgrade
- Predicting which customers are likely to buy again, renew, expand, or refer
- Forecasting customer lifetime value by acquisition source or segment
- Flagging support cases that may breach SLA or affect satisfaction
- Identifying accounts that may need onboarding help based on usage patterns
- Predicting which offer or content may work better for a customer segment
Prediction should stay connected to business review. A score is only useful if users know what data it used, what assumptions apply, who should review it, and what action options are available.
Prescriptive customer analytics
Prescriptive analytics suggests possible next actions. It may recommend sending an education message, assigning a success manager, changing a retention offer, prioritizing a service case, adjusting campaign targeting, reviewing a product issue, or creating a customer recovery workflow.
Prescriptive analytics needs governance because it can influence customer communication, pricing, support priority, and revenue planning. Recommendations should include evidence, assumptions, owner review, permission boundaries, and business context. In most enterprise settings, humans should still approve customer-facing actions.
Metrics of Customer Analytics
Customer analytics metrics should match the decision you need to support. A lifecycle marketer, ecommerce manager, customer success lead, product manager, sales leader, support director, CFO, and CEO do not need the same first screen.
Start with the business question, then choose the smallest metric set that can explain performance.
Acquisition
- Example metrics: New customers, cost per acquisition, source, campaign, channel, lead-to-customer rate
- What it helps answer: Where do customers come from, and which sources produce better customers?
Activation
- Example metrics: Signup completion, first purchase, onboarding completion, first value action, time to value
- What it helps answer: Are new customers reaching the first meaningful milestone?
Behavior
- Example metrics: Visit frequency, product usage, feature adoption, purchase category, basket mix, channel preference
- What it helps answer: What do customers actually do after acquisition?
Conversion
- Example metrics: Visit-to-lead, lead-to-customer, cart conversion, quote-to-order, trial-to-paid, renewal conversion
- What it helps answer: Where does the customer journey slow down?
Engagement
- Example metrics: Session frequency, email clicks, app events, content views, community activity, loyalty activity
- What it helps answer: Which customers are active, inactive, or changing behavior?
Value
- Example metrics: Revenue per customer, average order value, gross margin, customer lifetime value, expansion revenue
- What it helps answer: Which customers create long-term value?
Retention
- Example metrics: Repeat purchase rate, renewal rate, retention rate, churn rate, cohort retention, reactivation rate
- What it helps answer: Are customers staying, returning, or leaving?
Experience
- Example metrics: CSAT, NPS, CES, complaint rate, sentiment, service rating, survey response
- What it helps answer: How do customers feel about the relationship?
Support
- Example metrics: Ticket volume, first response time, resolution time, backlog, escalation rate, SLA attainment
- What it helps answer: Where does service quality need attention?
Loyalty
- Example metrics: Member enrollment, tier movement, points earned, redemption rate, referral rate
- What it helps answer: Are loyalty programs changing behavior?
Data Quality
- Example metrics: Match rate, duplicate profiles, missing source, stale data, consent status, attribution coverage
- What it helps answer: Can stakeholders trust the analysis?
Most customer analytics systems work better with three metric layers:
- Outcome metrics: Revenue, retention, churn, customer lifetime value, loyalty, satisfaction, renewal, repeat purchase, or expansion.
- Driver metrics: Acquisition source, conversion rate, engagement, product usage, support quality, onboarding progress, purchase frequency, and offer response.
- Diagnostic fields: Customer ID, account, segment, cohort, channel, campaign, region, product, plan, tier, owner, journey stage, issue type, and lifecycle status.
Avoid reporting every available field. If a metric does not explain performance, diagnose a problem, or support a decision, move it to a drill-down view or appendix. A focused data analytics dashboard is easier to trust than a crowded screen that treats every customer metric as equally important.
Data Sources
Customer analytics depends on connected data. Many projects fail because the visual layer looks complete while the data layer remains fragmented, duplicated, or unclear.
Common customer analytics data sources include:
CRM
- Example data: Leads, contacts, accounts, opportunities, owners, stages, activities
- Common analytics use: Customer profile, pipeline, sales handoff, account relationship
Ecommerce or POS
- Example data: Orders, products, basket, discounts, returns, purchase date, store
- Common analytics use: Purchase behavior, repeat buying, basket analysis, customer value
Web Analytics
- Example data: Sessions, source, landing pages, events, conversions, device
- Common analytics use: Acquisition, content engagement, journey drop-off
Product or App Analytics
- Example data: Usage events, feature adoption, login frequency, workspace activity
- Common analytics use: Activation, engagement, retention, product-led growth
Customer Support
- Example data: Tickets, categories, response time, resolution time, escalations, satisfaction
- Common analytics use: Service quality, friction diagnosis, churn risk
Marketing Automation
- Example data: Email, forms, nurture, campaign membership, scoring, segments
- Common analytics use: Lifecycle engagement, offer response, lead quality
Loyalty Systems
- Example data: Member tier, points, redemptions, referrals, rewards
- Common analytics use: Loyalty behavior, repeat purchase, customer value
Surveys and Feedback
- Example data: NPS, CSAT, CES, text feedback, complaint themes
- Common analytics use: Customer experience and sentiment analysis
Billing and Finance
- Example data: Invoice, payment, contract, plan, revenue, margin, refund
- Common analytics use: Customer value, renewal, profitability, risk
CDP or Data Warehouse
- Example data: Identity graph, unified profiles, consent, segments, events
- Common analytics use: Cross-channel customer view and governed analysis
Spreadsheets
- Example data: Manual targets, account notes, segment rules, campaign calendars
- Common analytics use: Transition-stage analysis and temporary inputs
Before building charts, define the business terms. "Customer," "active customer," "new customer," "retained customer," "churned customer," "repeat purchase," "customer lifetime value," "loyalty member," "account health," and "satisfaction" can mean different things across systems.
This is where customer data integration, business intelligence, and data dashboard concepts become practical. The dashboard is only as useful as the customer identity logic, data model, metric dictionary, refresh rhythm, permission rules, and owner workflow behind it.
Customer analytics also needs privacy and permission awareness. Teams should know which data is appropriate for analysis, which data requires consent, which fields should be restricted, and which customer-facing actions require human review. Good customer analytics helps teams make better decisions without turning customer data into an uncontrolled data dump.
Examples and Templates
Examples make customer analytics easier to understand because they turn a broad topic into specific decision spaces. The demo cards below come from the Gallery demo file and match customer analytics topics such as customer insight, consumer data centers, member segmentation, behavioral analysis, loyalty programs, funnel conversion, campaign attribution, and sales follow-up.
Use these examples as learning prompts. Before copying a layout, ask: Who will use this view? What decision should it support? Which customer definitions must remain consistent across reports?
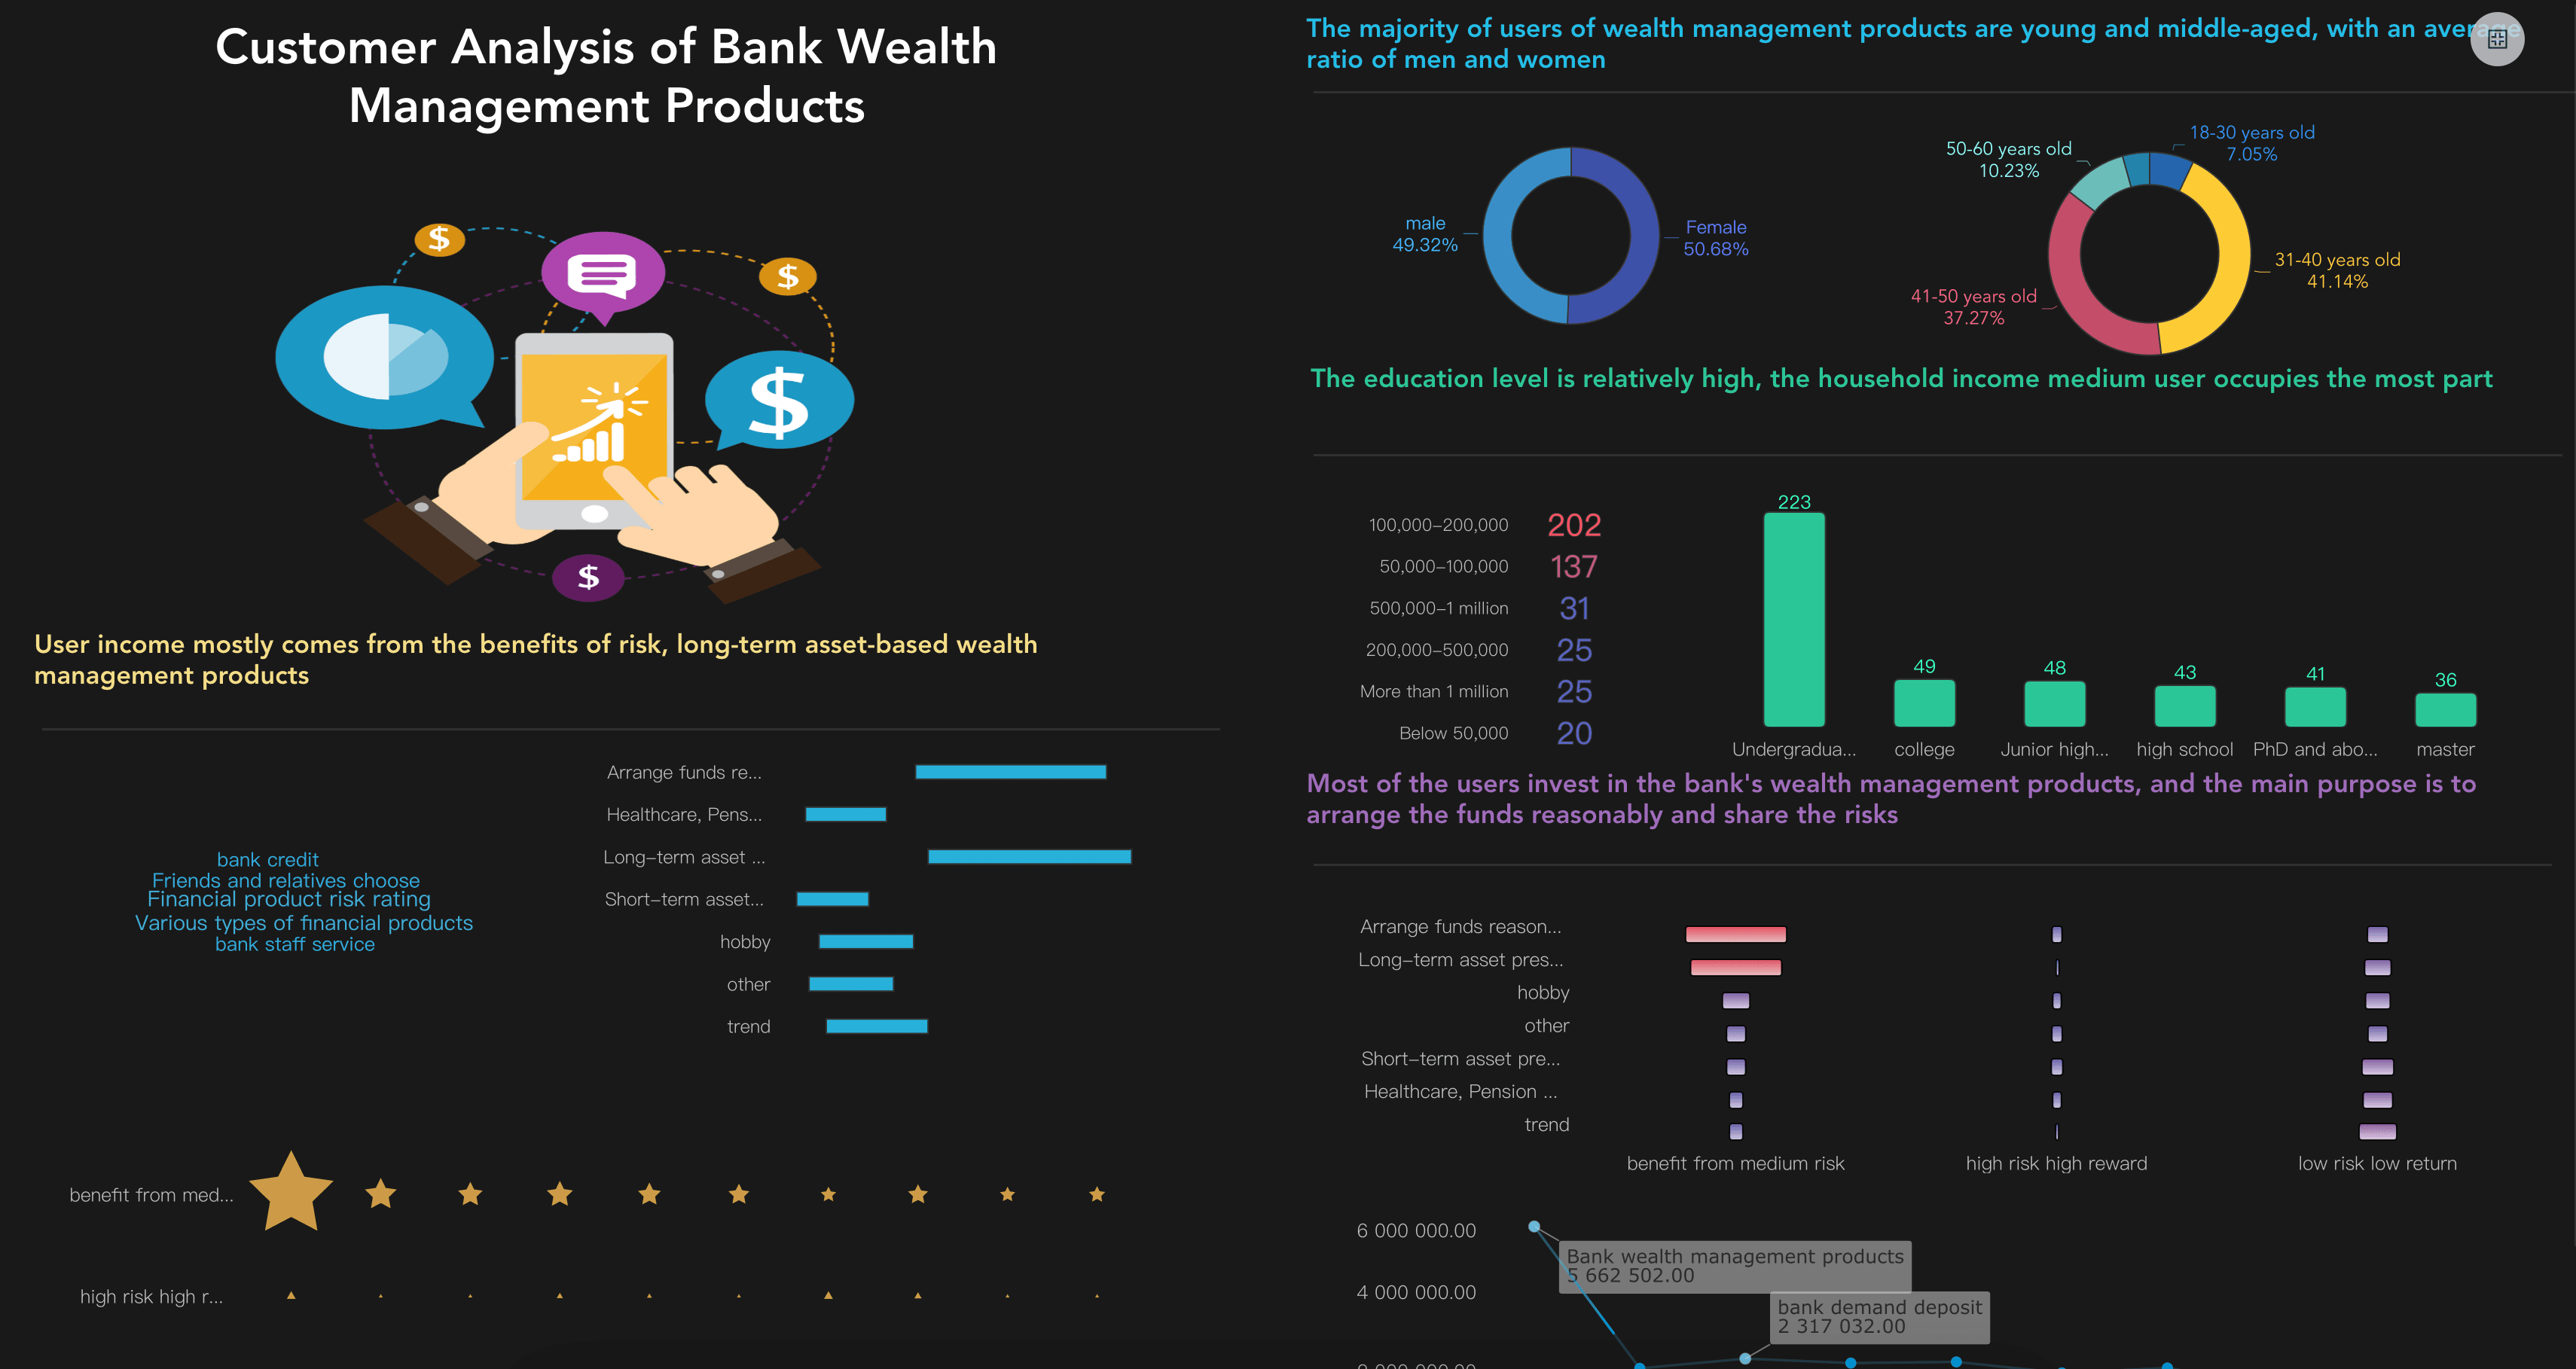
Customer Analytics Dashboard

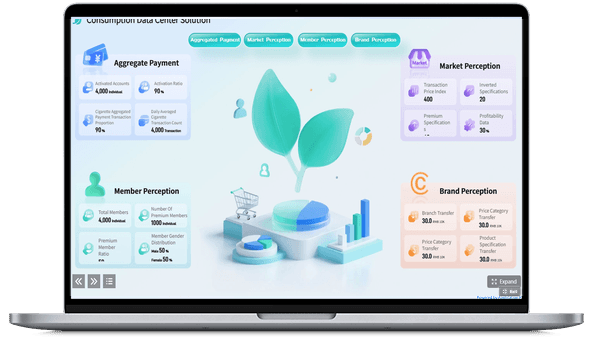
Consumer Data Center Solution
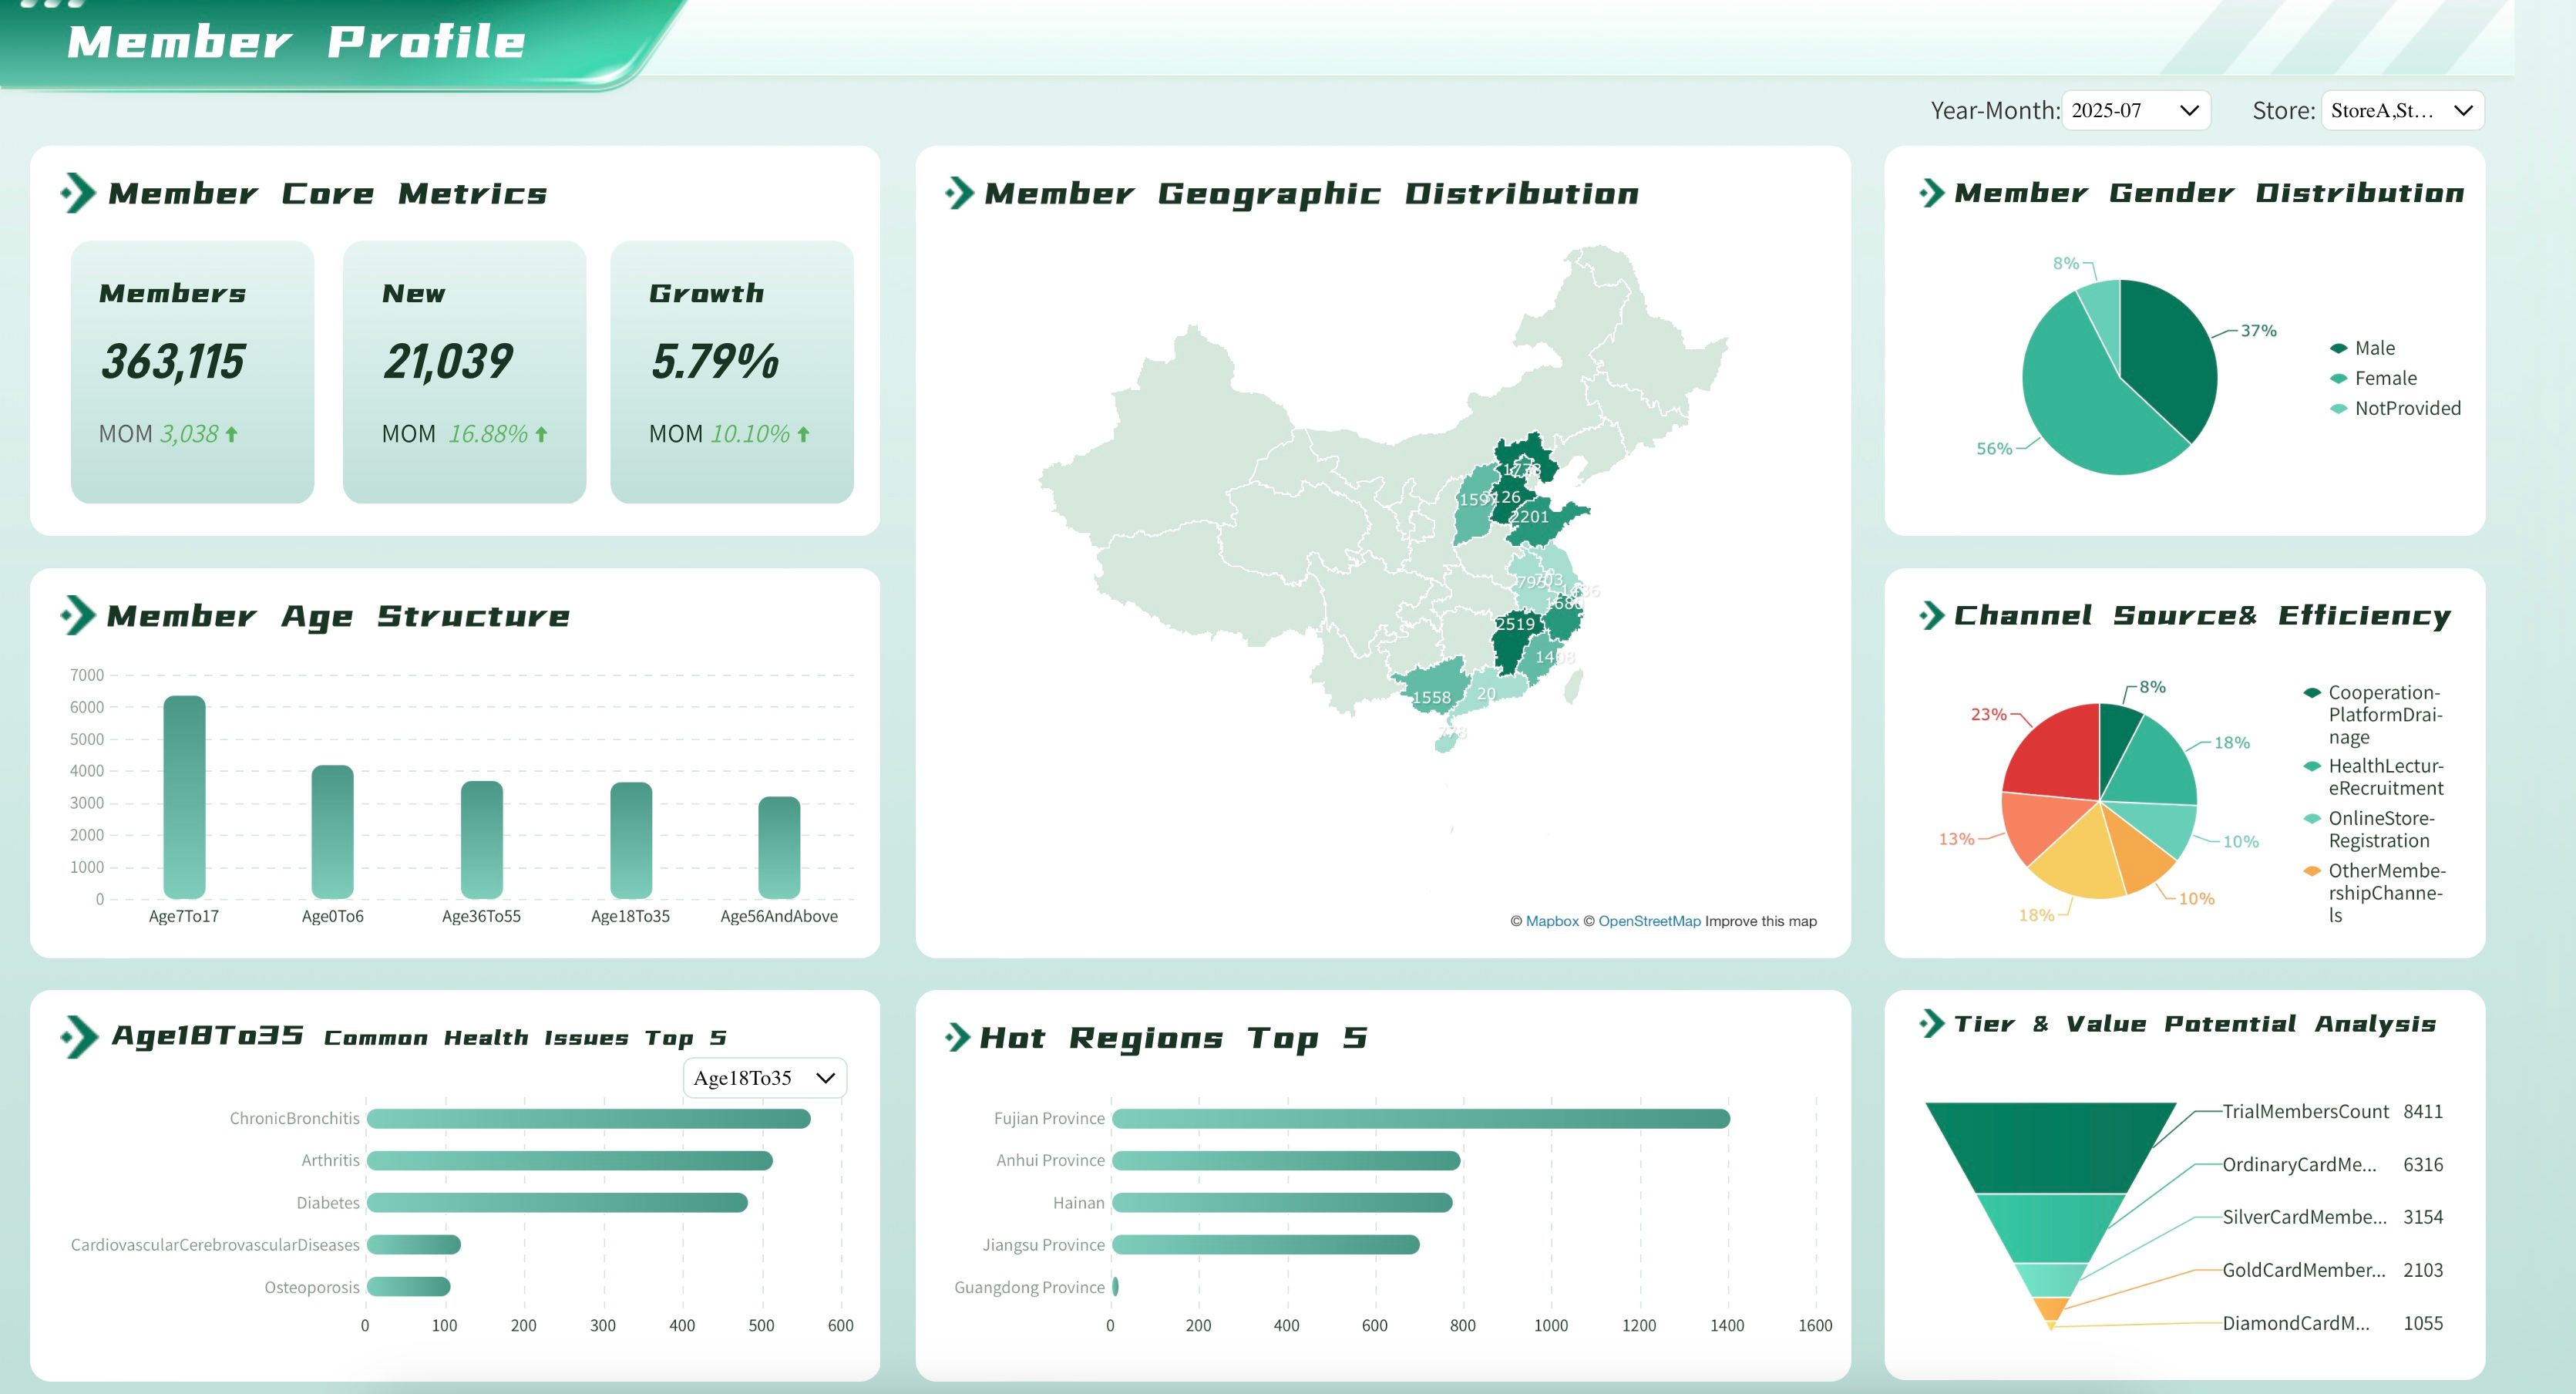
Pharmacy Member Analytics Dashboard
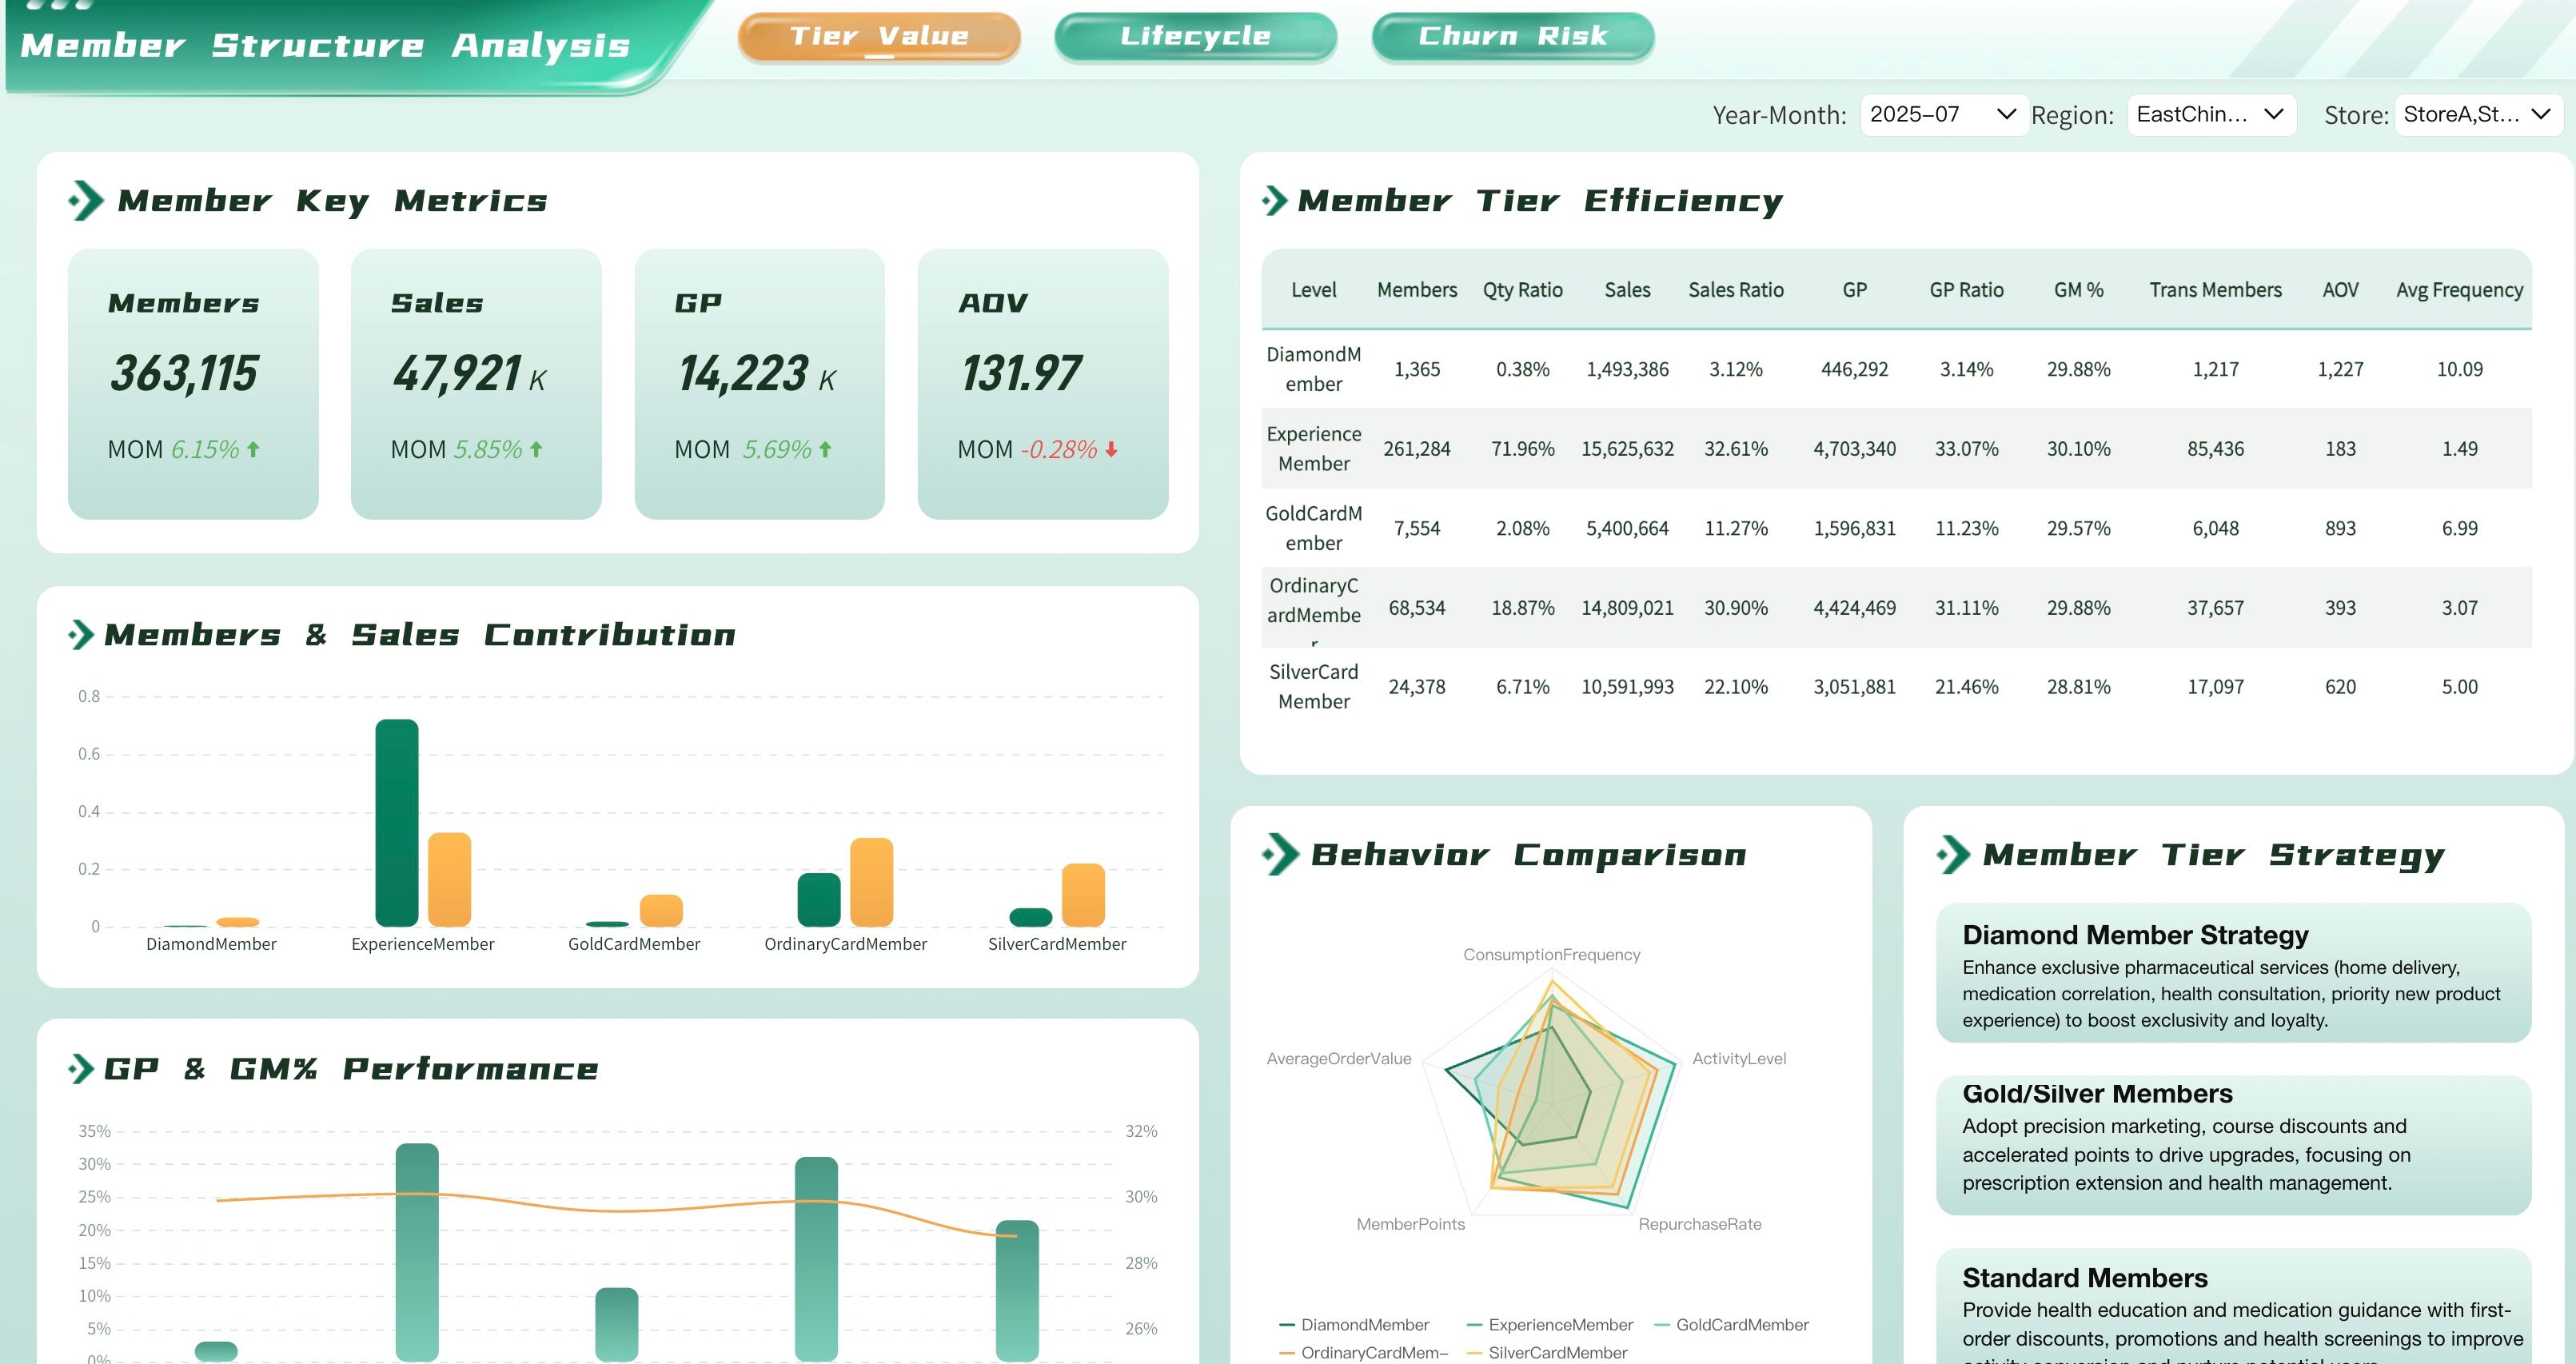
Pharmacy Member Segmentation Analysis Dashboard
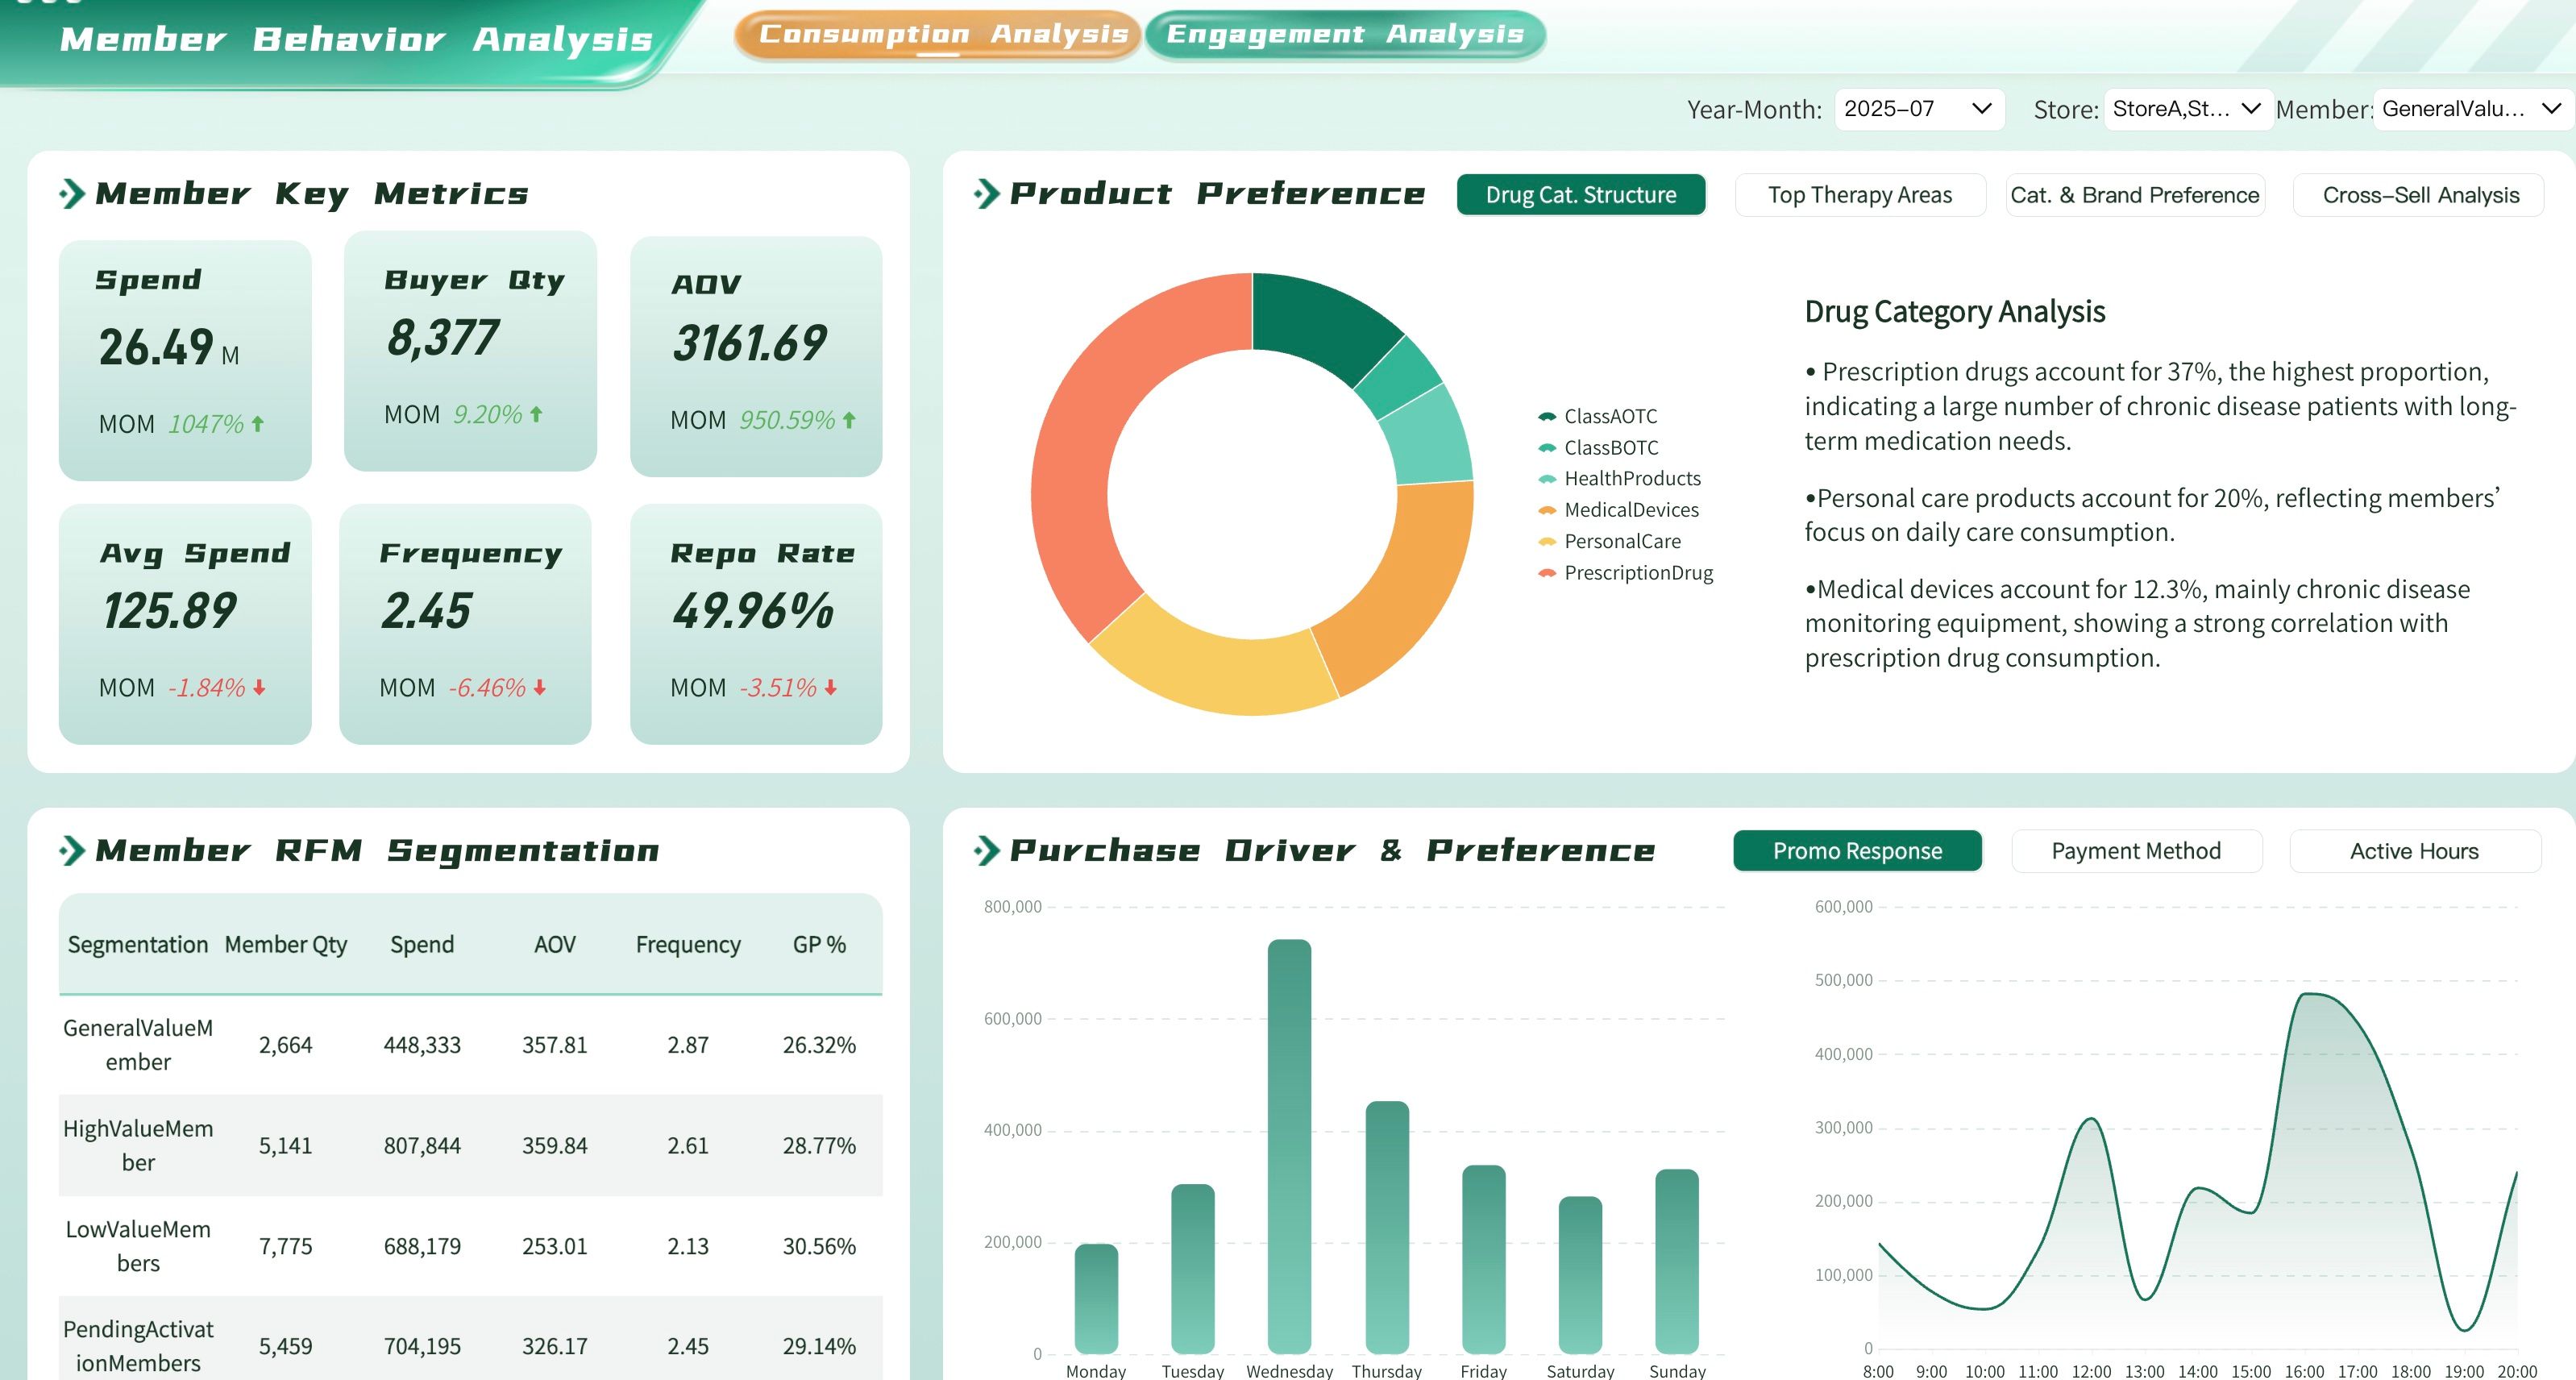
Pharmacy Member Behavioral Insights Dashboard
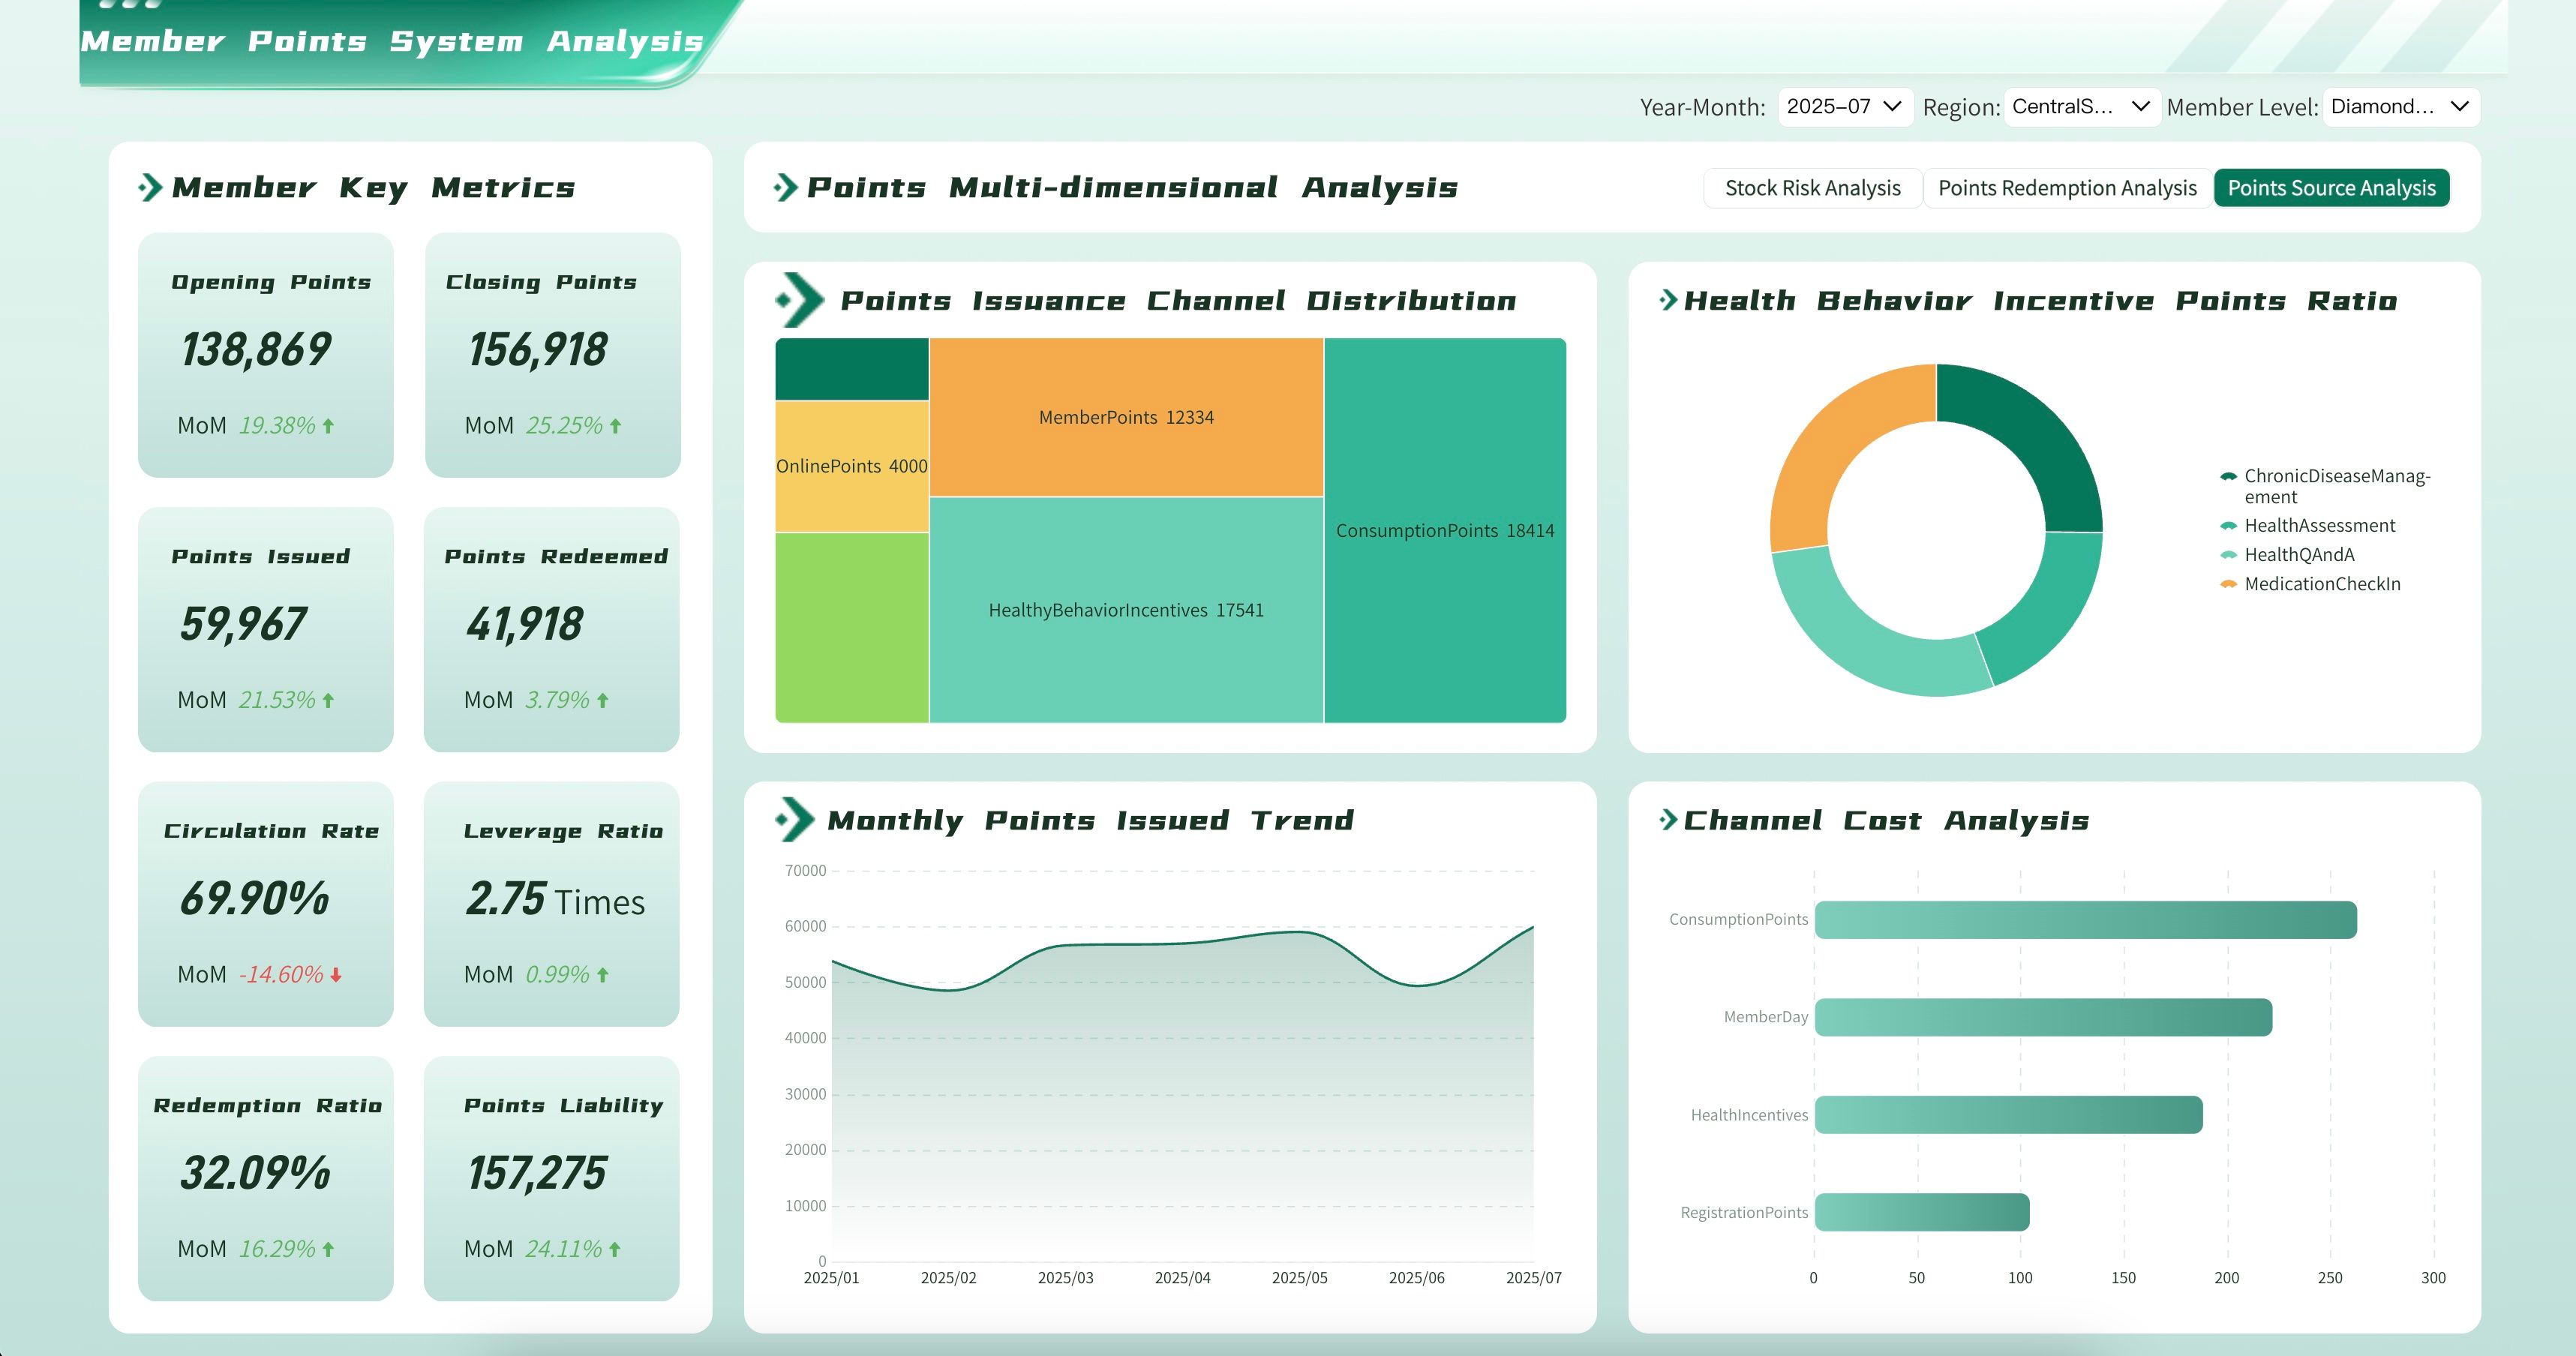
Pharmacy Loyalty Program Analytics Dashboard
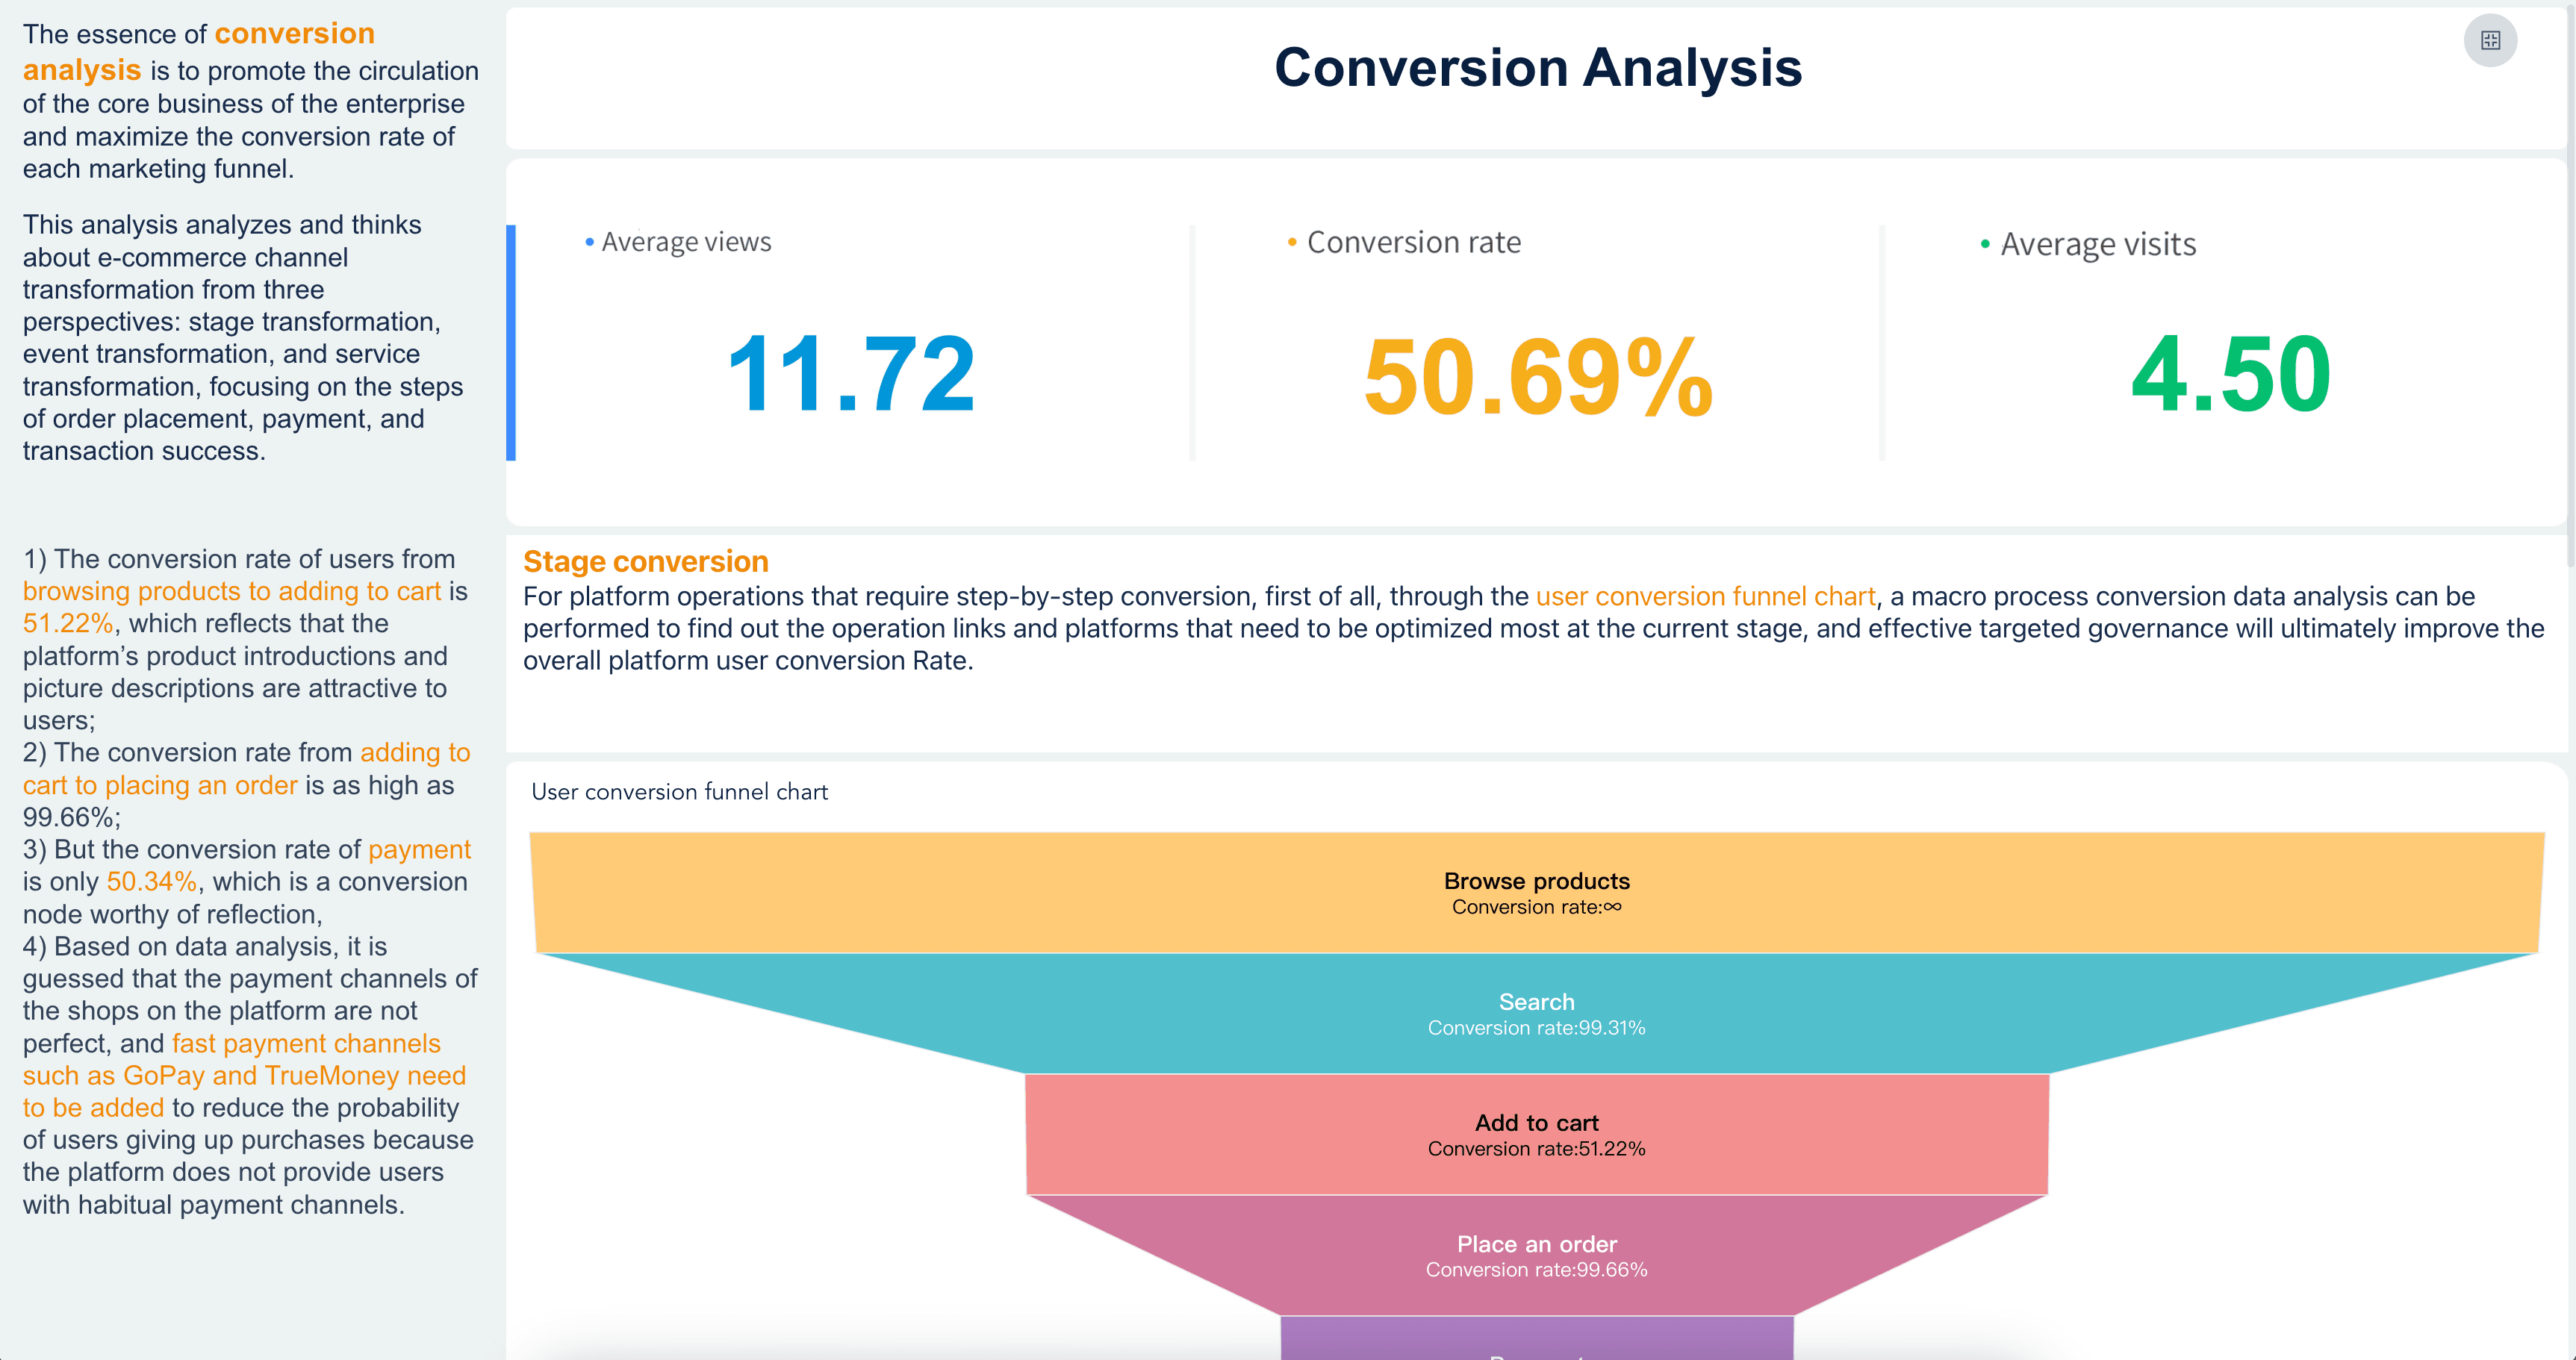
Conversion Analysis
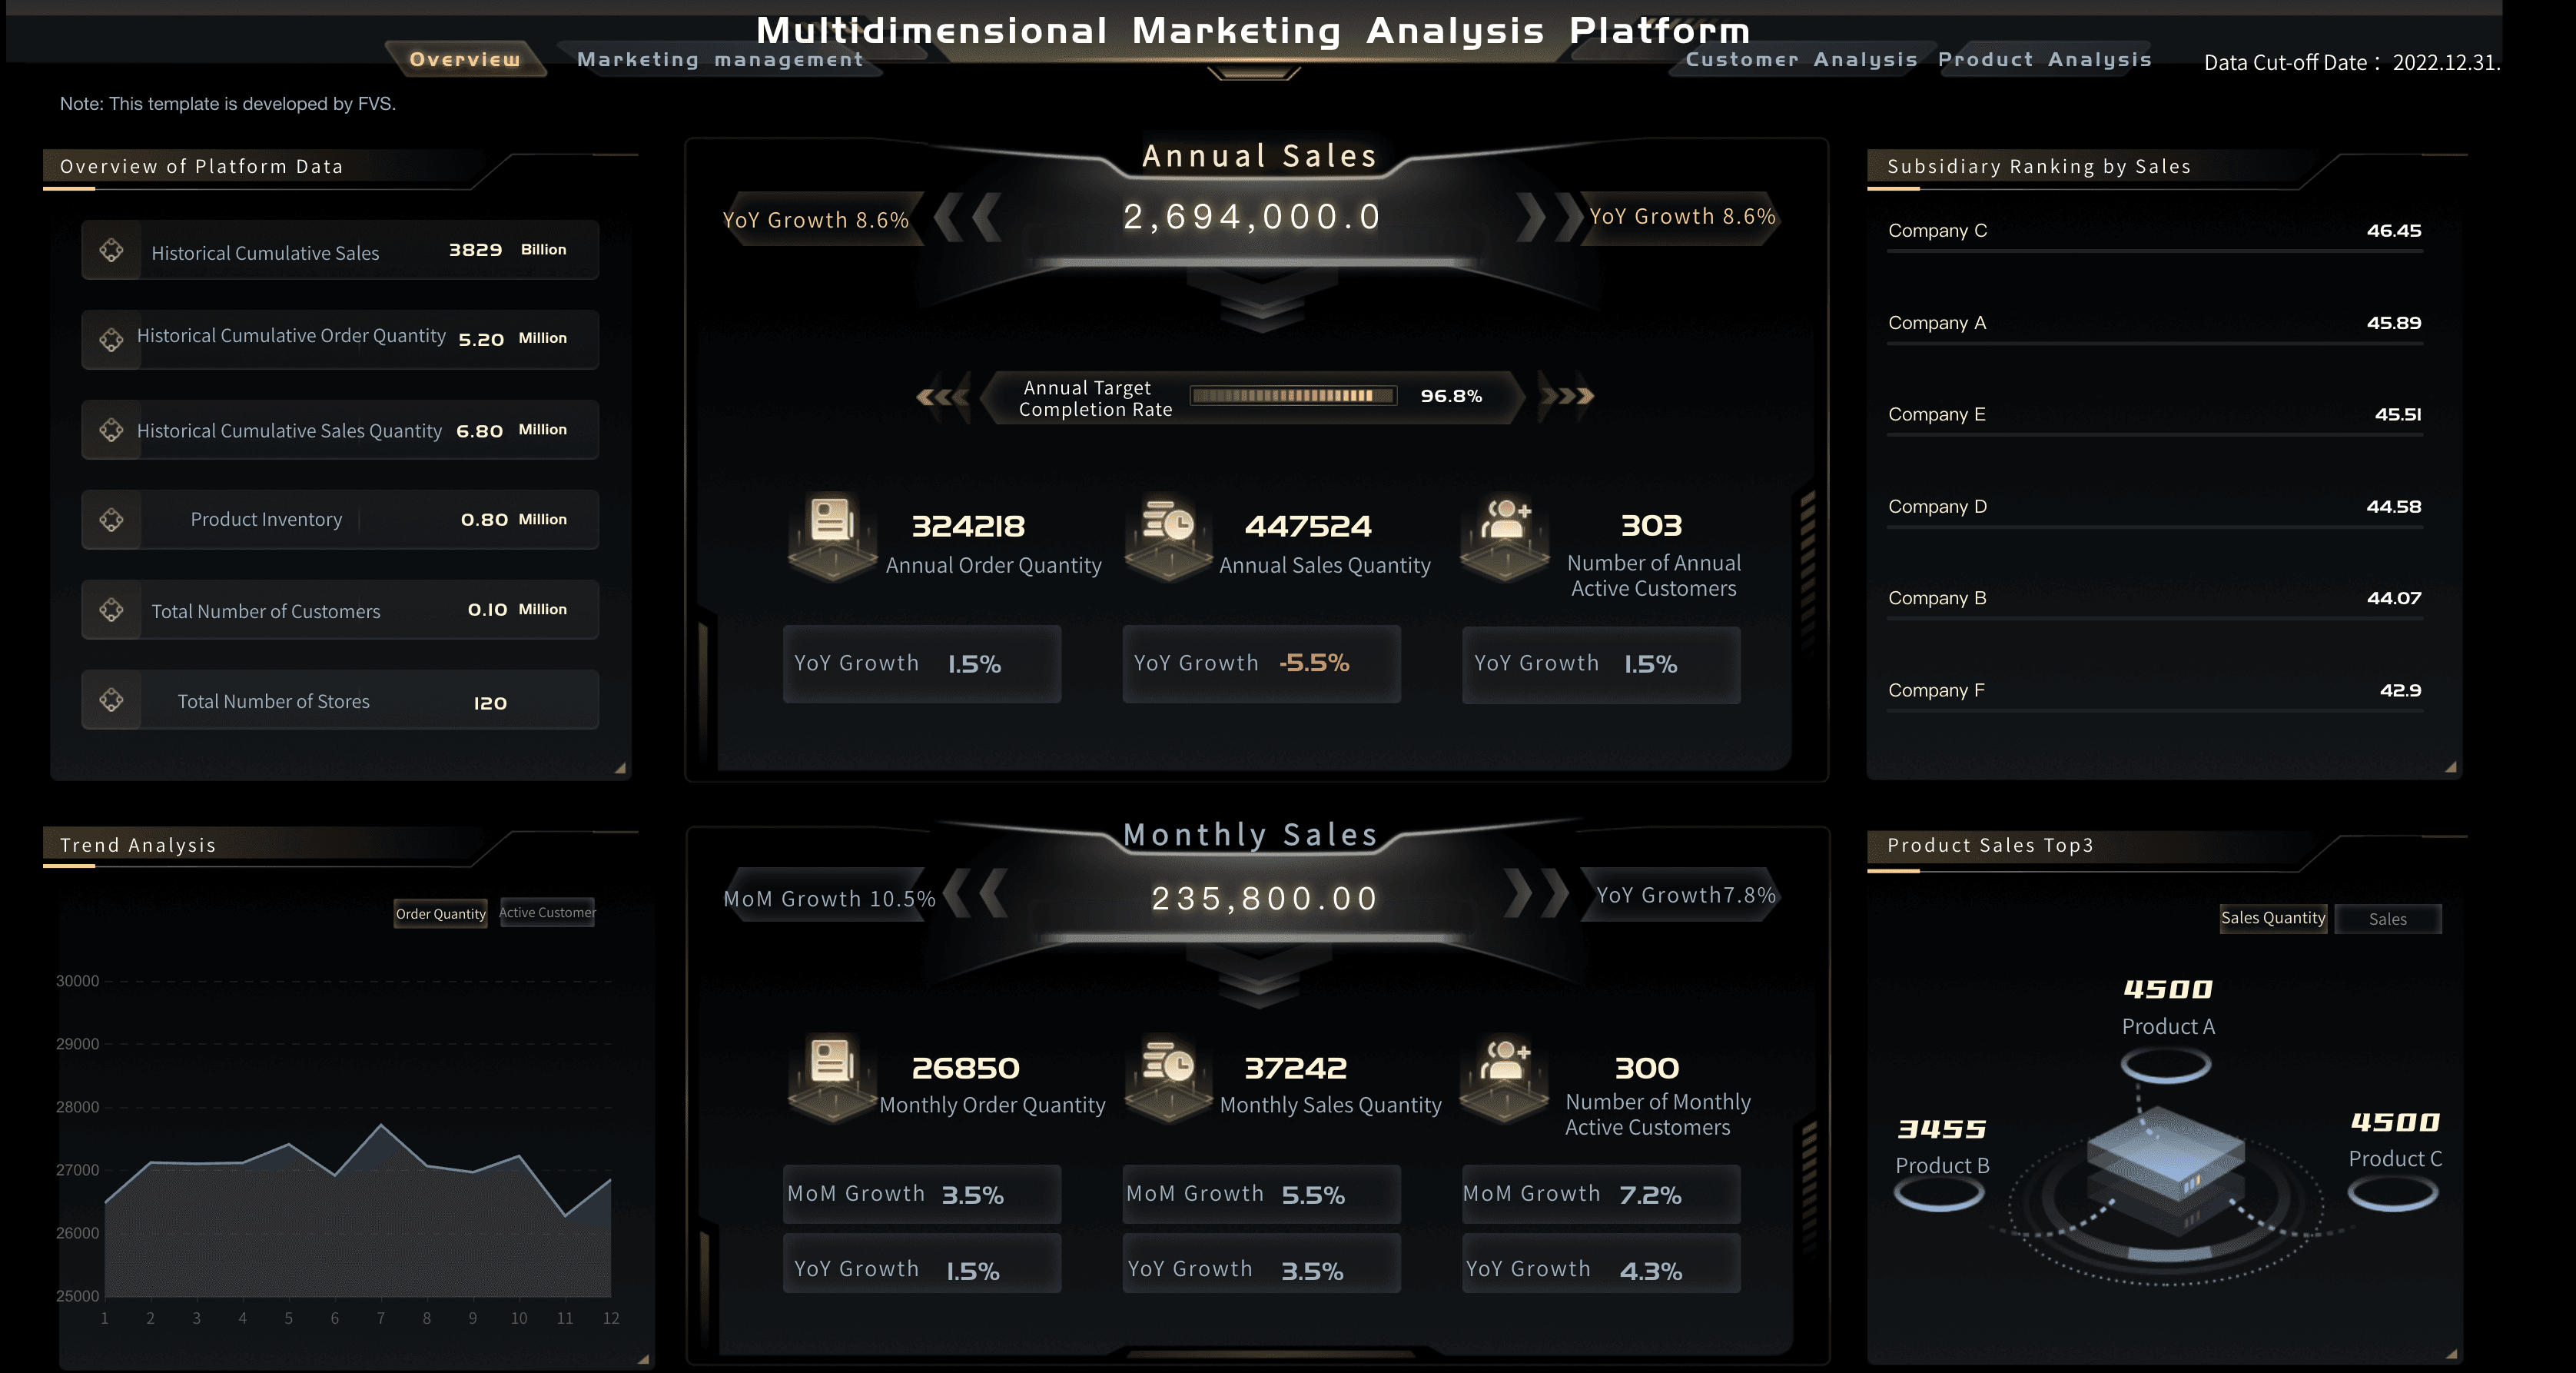
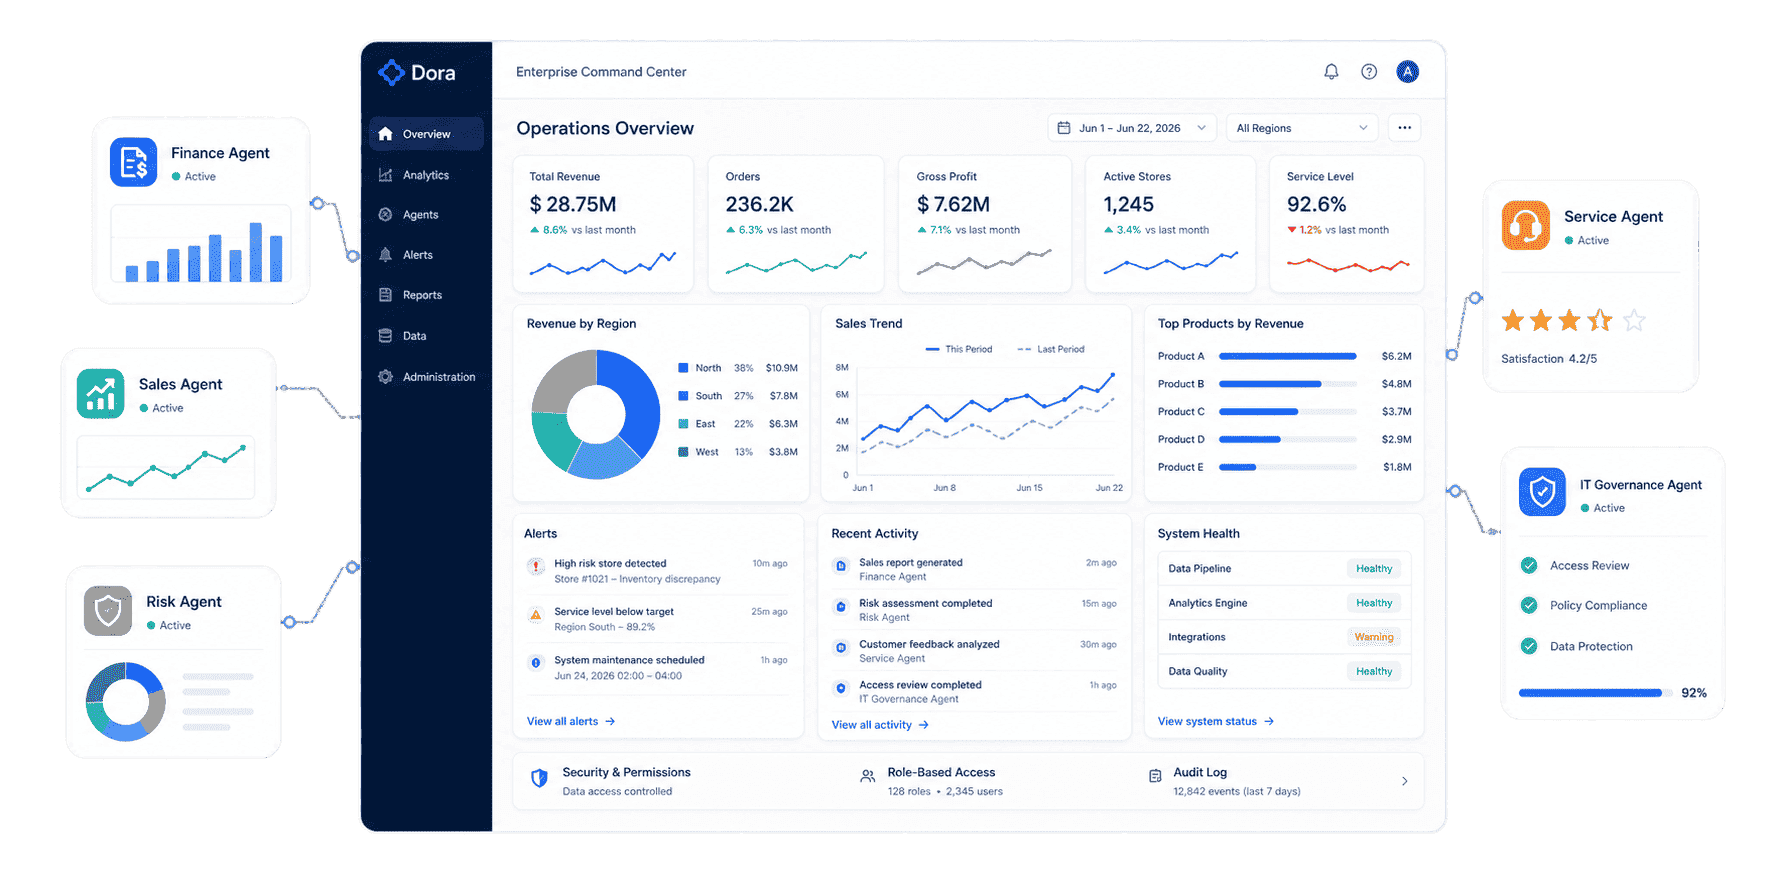
Marketing Analytics Platform
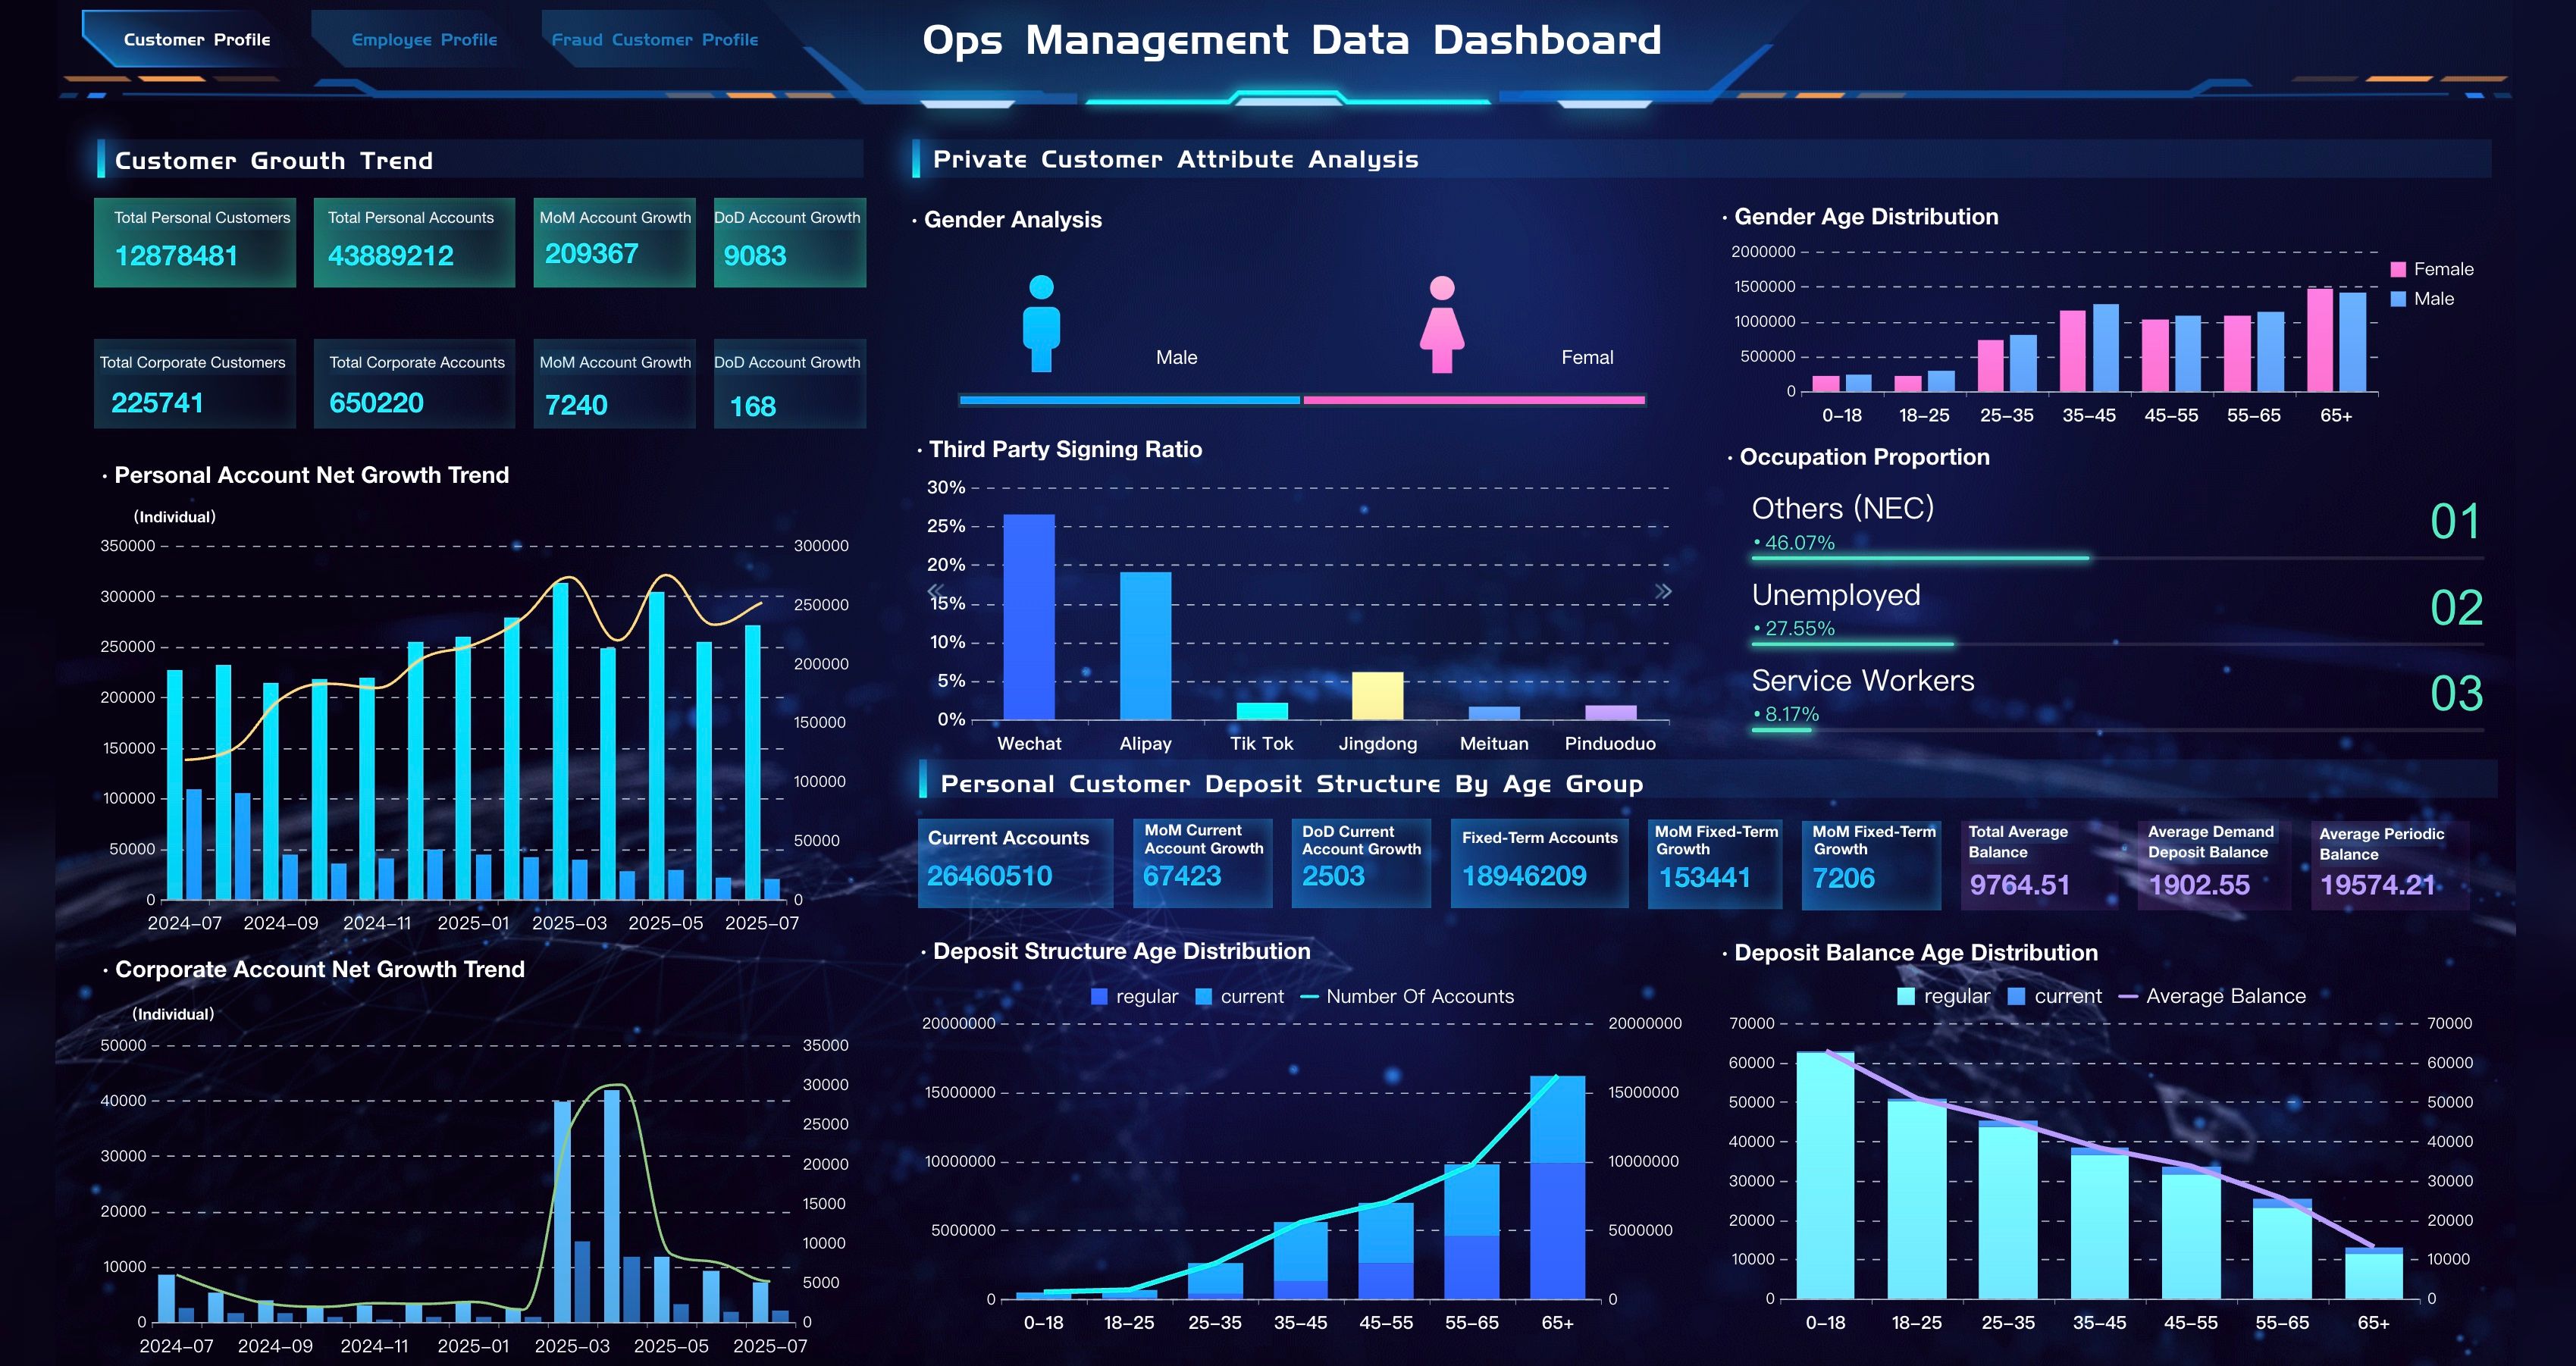
Customer, Employee & Anti-Fraud Analysis Dashboard
Customer Analytics Workflow
Customer analytics becomes useful when the workflow is repeatable. The first version does not need to solve every customer question. It should solve one recurring decision well.
Use this workflow as a practical build path:
- Choose one customer decision. Start with a clear question, such as "Which customer segments are at risk this month?" or "Why did repeat purchase decline among loyalty members?"
- Define the audience. Decide whether the view is for executives, marketing, sales, customer success, support, ecommerce, product, finance, or analysts.
- Map the data sources. List the systems, fields, refresh frequency, owners, identity rules, and known data quality issues.
- Standardize customer definitions. Write formulas for customer, active customer, retained customer, churned customer, repeat purchase, lifetime value, health score, and loyalty member.
- Create the visual structure. Use a small set of charts that match the question: trends for movement, bars for segment comparison, funnels for conversion, cohorts for retention, and tables for details.
- Add commentary. Explain what changed, why it matters, what may have caused it, and what should happen next.
- Review data quality and privacy. Note duplicate profiles, missing source, delayed updates, consent limits, restricted fields, and definition gaps.
- Assign follow-up. Every meaningful recommendation should have an owner, next step, and review date.
- Retire unused sections. If a chart does not change decisions for several cycles, simplify it or move it to a drill-down view.
This workflow also helps teams decide when to use ad hoc analysis, when to create recurring customer reports, and when a governed BI environment is needed. Small teams may start with spreadsheets and CRM exports. Larger teams usually need shared customer identity rules, access control, scheduled refresh, reusable dashboard assets, and governed commentary.
A simple customer analytics maturity path could look like this:
Basic Reporting
- Focus: Count customers, orders, tickets, revenue, and churn
- Typical next step: Standardize definitions and cadence
Connected Dashboards
-Focus: Combine CRM, ecommerce, support, and marketing views -Typical next step: Add drill-down and permission control
Diagnostic Analytics
- Focus: Explain segment, cohort, journey, and value changes
- Typical next step: Add owner workflow and commentary
Predictive Analytics
- Focus: Estimate churn, expansion, value, or service risk
- Typical next step: Add model review and action governance
AI-assisted Analytics
- Focus: Ask questions, generate briefings, push follow-up actions
- Typical next step: Add semantic rules, Skills, and human review
Challenges
Customer analytics often fails for organizational reasons before it fails for technical reasons. The dashboard may look polished, but if people do not trust the definitions, the meeting turns into a debate about data instead of a decision about customer action.
Common challenges include:
- Fragmented customer identity: CRM contacts, ecommerce accounts, support users, app users, loyalty members, and billing customers may not match cleanly.
- Inconsistent definitions: Teams may calculate active customers, churn, retention, repeat purchase, customer lifetime value, or account health differently.
- Attribution gaps: Multi-touch journeys, offline sales, partner activity, long sales cycles, privacy limits, and missing source data can make customer origin hard to explain.
- Data quality issues: Duplicate profiles, stale fields, missing consent, incomplete events, delayed CRM updates, manual spreadsheet edits, and tracking changes can distort analysis.
- Too many metrics: A crowded view makes it hard to see the signal. More charts do not automatically create better decisions.
- Privacy and permission risk: Customer data often includes sensitive fields. Access rules, masking, consent, and auditability matter.
- No owner workflow: Insights fade when the report does not assign owners, deadlines, follow-up questions, or next review dates.
- Overconfident automation: AI-generated summaries can mislead users if they are not grounded in governed metrics, source traceability, permissions, and human review.
The solution is not to add more dashboards. The solution is to improve the operating system around customer analytics: trusted data, clear definitions, useful visual hierarchy, stakeholder-specific views, commentary, permissions, and follow-up ownership.
For example, a customer health dashboard can show risk, but the team still needs to define what "health" means. A churn view can show losses, but the team still needs to separate voluntary churn, failed renewal, payment issues, inactive users, and data cleanup. A loyalty report can show redemptions, but the team still needs to connect them with repeat purchase and margin.
Customer Analytics With FineBI + Dora
After the customer analytics structure is clear, FineBI + Dora can help teams move from manual data work to a more repeatable customer learning workflow.
FineBI can support the self-service BI and dashboard layer of customer analytics: connecting customer data sources, modeling metrics, creating visual analysis views, exploring segments, drilling into customer behavior, building dashboards, and helping business users investigate customer questions without waiting for every report to be rebuilt by IT.
Dora adds the AI action layer above governed BI assets. As a data agent, Dora can help users ask natural-language customer questions, search existing FineBI dashboards, generate charts or structured briefings from configured data assets, summarize changes, push scheduled updates, and follow up with responsible owners. Dora should not replace analysts or make customer decisions alone. It works best when it operates on trusted customer metrics, business terms, permissions, Skills, source traceability, and human review.
For a customer analytics scenario, two useful Dora digital employees could be:
- Customer Insight Analyst: Answers follow-up questions about segments, behavior, conversion, retention, churn, customer value, and support patterns using governed FineBI assets.
- Customer Growth Briefing Secretary: Generates scheduled customer summaries, flags abnormal changes, and pushes segment-specific notes to marketing, customer success, service, or sales owners.
Example chat-style prompts:
- "Show this month's customer analytics by segment. Include new customers, active customers, repeat purchase, churn, customer lifetime value, and the top three changes from last month."
- "Explain why high-value retail customers purchased less this week. Compare campaign exposure, product category, discount usage, store region, and support complaints."
- "Create a dashboard-style view of customer retention by cohort, acquisition source, and loyalty tier, then list the segments that need follow-up."
- "Find customers with rising support tickets and declining product usage, then summarize which accounts need customer success review."
- "Generate a weekly customer growth briefing for regional managers, including new customers, repeat customers, churn risk, and recommended follow-up questions."
A closed-loop AI workflow could look like this:
- Retrieve trusted customer data: Dora reads configured FineBI assets, customer definitions, segment rules, KPI formulas, and permission settings.
- Detect meaningful movement: It compares current customer metrics with targets, previous periods, cohorts, and known campaign or service changes.
- Explain likely drivers: It highlights where variance appears, such as lifecycle stage, acquisition source, product usage, service delay, loyalty tier, or customer segment.
- Generate the briefing: It creates a structured summary with charts, metric notes, commentary, and data quality warnings.
- Push to owners: It sends relevant sections to marketing, customer success, support, ecommerce, sales, or leadership channels for review.
- Follow up and summarize: It tracks open questions, captures human feedback, and prepares a clearer customer analytics summary for the next review.
This is the practical value of enterprise AI agents in customer analytics. The value is not a generic chatbot that improvises from disconnected customer tables. The value is a governed workflow where natural-language questions map to trusted BI assets, semantic rules, reusable Skills, permissions, and reviewable outputs.
For IT teams, this shifts work from manually answering every customer data question to maintaining data connections, identity rules, metric definitions, semantic layers, access rules, and reusable AI workflows. For business users, it reduces the wait between a customer question and a useful first analysis. For executives, it makes customer analytics easier to connect to action: what changed, why it matters, who owns the next step, and what will be reviewed next.
The reason this scenario can work in a real enterprise is simple: scenario + product + service. Start with one recurring customer analytics workflow, use FineBI to govern the customer dashboard and analysis assets, use Dora to make the workflow easier to query and follow up, and support rollout with data connection, customer identity setup, KPI definition, permission setup, Skills configuration, and user training.
If your team is exploring AI-assisted analytics beyond customer work, related learning paths include AI assistant for business and AI agent workflow.
If your team is starting from scratch, do not begin with every customer use case. Start with one recurring workflow that already matters to the business. A weekly retention risk briefing is often a good candidate because it connects data, customer value, owner workflow, and action review.
One practical rollout could look like this:
- Define the retention risk question: For example, "Which active customers are most likely to churn or reduce purchase next month?"
- Build the FineBI view: Include customer segment, cohort, recent activity, purchase frequency, product usage, support tickets, satisfaction, account owner, and customer value.
- Create the metric dictionary: Define churn, retention, inactivity, high value, risk level, and follow-up owner.
- Configure Dora's briefing Skill: Ask Dora to retrieve the FineBI view, compare changes, summarize top risks, and generate owner-specific notes.
- Push a weekly review: Send the briefing to customer success, marketing, support, or regional owners before the customer review meeting.
- Capture feedback: Let owners mark false positives, confirmed risks, follow-up status, and missing context.
- Improve the next cycle: Adjust the segment rules, risk thresholds, and briefing format based on actual use.
This kind of workflow keeps customer analytics educational and practical. The goal is not to show that AI can answer every customer question. The goal is to build one trusted loop: detect, explain, brief, assign, review, and improve.
Customer Analytics Hub
This customer analytics guide should work as one spoke in a broader analytics, dashboard, and reporting learning path. Customer analytics explains customer behavior, value, experience, loyalty, retention, and relationship health. Adjacent pages can help users go deeper into specific formats and use cases.
Use these related resources to build a complete learning path:
- Start with customer analysis when the team needs a beginner-friendly foundation for studying customer groups and behavior.
- Use customer behavior analysis when the focus is what customers do before purchase, churn, repeat order, complaint, or upgrade.
- Review customer loyalty analytics when retention, repeat purchase, referral, and member value become central.
- Use RFM analysis when the team needs a practical model for recency, frequency, and monetary value segmentation.
- Explore customer data integration when customer identity, CRM, ecommerce, support, and marketing data need to be connected.
- Review marketing analytics dashboard when acquisition quality, campaign influence, and downstream customer value matter.
- Pair customer analytics with CRM reporting when sales and account teams need a structured customer narrative.
- Use data dashboard, data analytics dashboard, and analytics dashboard concepts when the team needs a stronger visual design foundation.
- Connect the workflow to business intelligence when the work moves beyond one team and needs governed metrics, permissions, and reusable assets.
FAQs
Customer analytics is the process of collecting, connecting, analyzing, and explaining customer data so teams can understand customer segments, behavior, experience, value, retention, churn, and growth opportunities. It helps teams move from raw customer records to decisions.
A customer analytics dashboard should include the metrics needed for a specific decision. Common sections include active customers, new customers, customer segments, conversion, retention, churn, repeat purchase, customer lifetime value, satisfaction, support quality, customer health, data quality notes, and follow-up owners.
Customer reporting communicates customer performance for a defined period. Customer analytics investigates the drivers behind that performance and helps decide what to do next. Reporting explains the story; analytics tests, deepens, and improves the story.
The most important metrics depend on the decision. High-value metrics often include customer acquisition, activation, conversion rate, repeat purchase rate, retention rate, churn rate, customer lifetime value, customer satisfaction, support response time, product usage, and loyalty activity. Avoid filling the first screen with metrics that do not change action.
Common sources include CRM, ecommerce, POS, web analytics, app analytics, product usage data, marketing automation, customer support, loyalty systems, surveys, billing, finance, CDP, data warehouse, and spreadsheets. The hardest part is often matching customer identity and definitions across systems.
FineBI can help teams connect customer data, model metrics, create dashboards, explore segments, and support self-service analysis. Dora can act as the AI Data Agent layer that answers follow-up questions, generates scheduled customer summaries, drafts commentary, flags abnormal changes, and pushes follow-up tasks based on governed BI assets. Human review should remain part of the workflow.
