
What Is an HR Dashboard?
HR Dashboard vs. HR Report
HR dashboards and HR reports both help organizations understand workforce data, but they are designed for different purposes.
An HR dashboard focuses on real-time monitoring and decision-making. It provides a visual overview of key workforce metrics such as headcount, employee turnover, recruitment progress, attendance, and employee engagement. Interactive charts and filters allow users to quickly identify trends, drill into specific departments, and respond to workforce challenges as they arise.
An HR report is a structured document that presents detailed workforce information over a specific period. Reports are commonly used for compliance, audits, performance reviews, and management reporting. They often include detailed tables, summaries, and analyses that provide a comprehensive record of HR activities and outcomes.
More resources:
- Dive deeper on the question, "What is a dashboard?"
- Download interactive marketing dashboard templates
Don't just collect data. Visualize what matters.
Download the Dashboard Guide to learn:
- 10 essential steps to build effective dashboards
- How to choose the right charts and avoid visual clutter
- 15 top-notch dashboard templates for 2026

Why HR Dashboards Matter Now?
The volume of workforce data available to HR has exploded. The challenge is no longer access — it's signal extraction. Organizations that close this gap share a common capability: they've made people analytics accessible at the point of decision. Here's what effective HR dashboards unlock:
- Improve Workforce Visibility: gain a complete view of employee performance, engagement, hiring, and retention across departments and locations.
- Make Faster HR Decisions: access real-time workforce data and identify trends instantly without waiting for manual reports.
- Reduce Administrative Work: automate HR reporting and eliminate repetitive spreadsheet updates.
- Enhance Talent Retention: monitor turnover risks, employee satisfaction, and engagement indicators to proactively address workforce challenges.
- Support Strategic Planning: Use workforce analytics to forecast staffing needs, optimize workforce allocation, and align HR initiatives with business goals.
Types of HR Dashboards
Different HR dashboards serve different business objectives. From recruitment and employee performance to workforce planning and retention, organizations can use specialized dashboards to gain deeper insights into every stage of the employee lifecycle.
- Recruitment Dashboard: a recruitment dashboard helps HR teams track hiring performance and optimize the recruitment process. By monitoring candidate pipelines, application volumes, and hiring timelines, recruiters can identify bottlenecks and improve hiring efficiency.
- Employee Performance Dashboard: an employee performance dashboard provides visibility into workforce productivity, goal achievement, and performance review outcomes. Managers can use these insights to recognize high performers, identify development opportunities, and support employee growth.
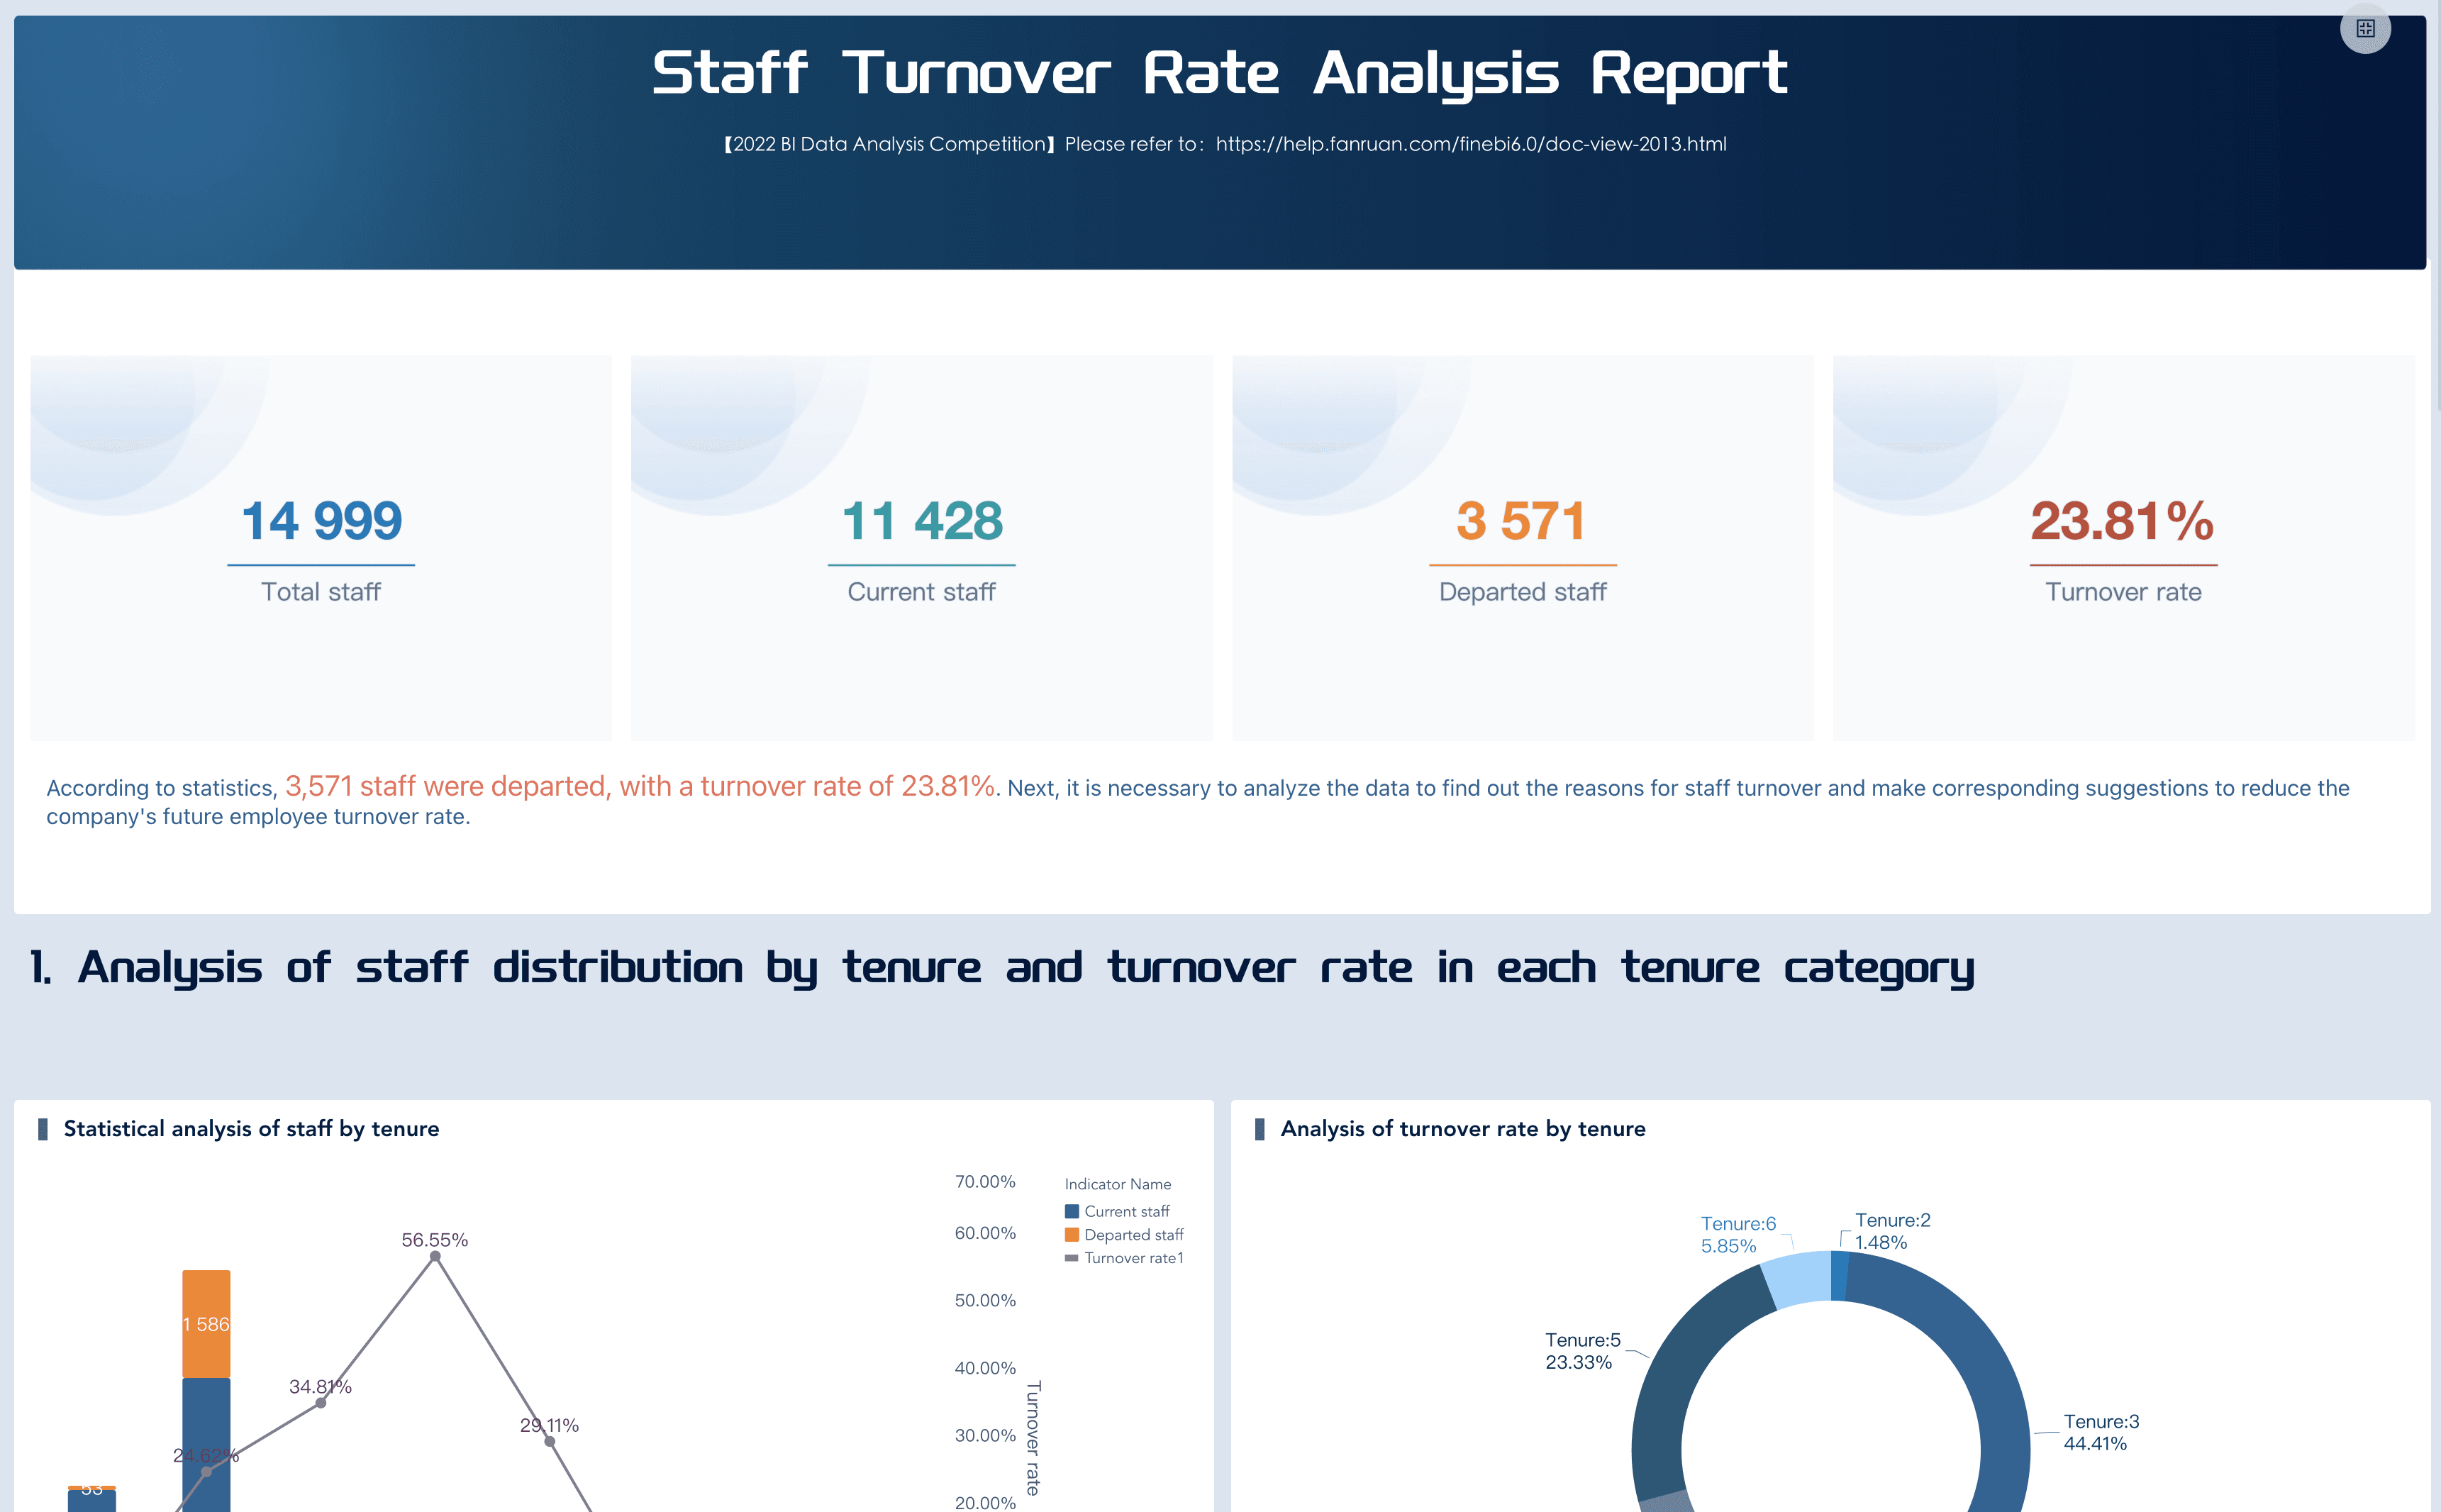
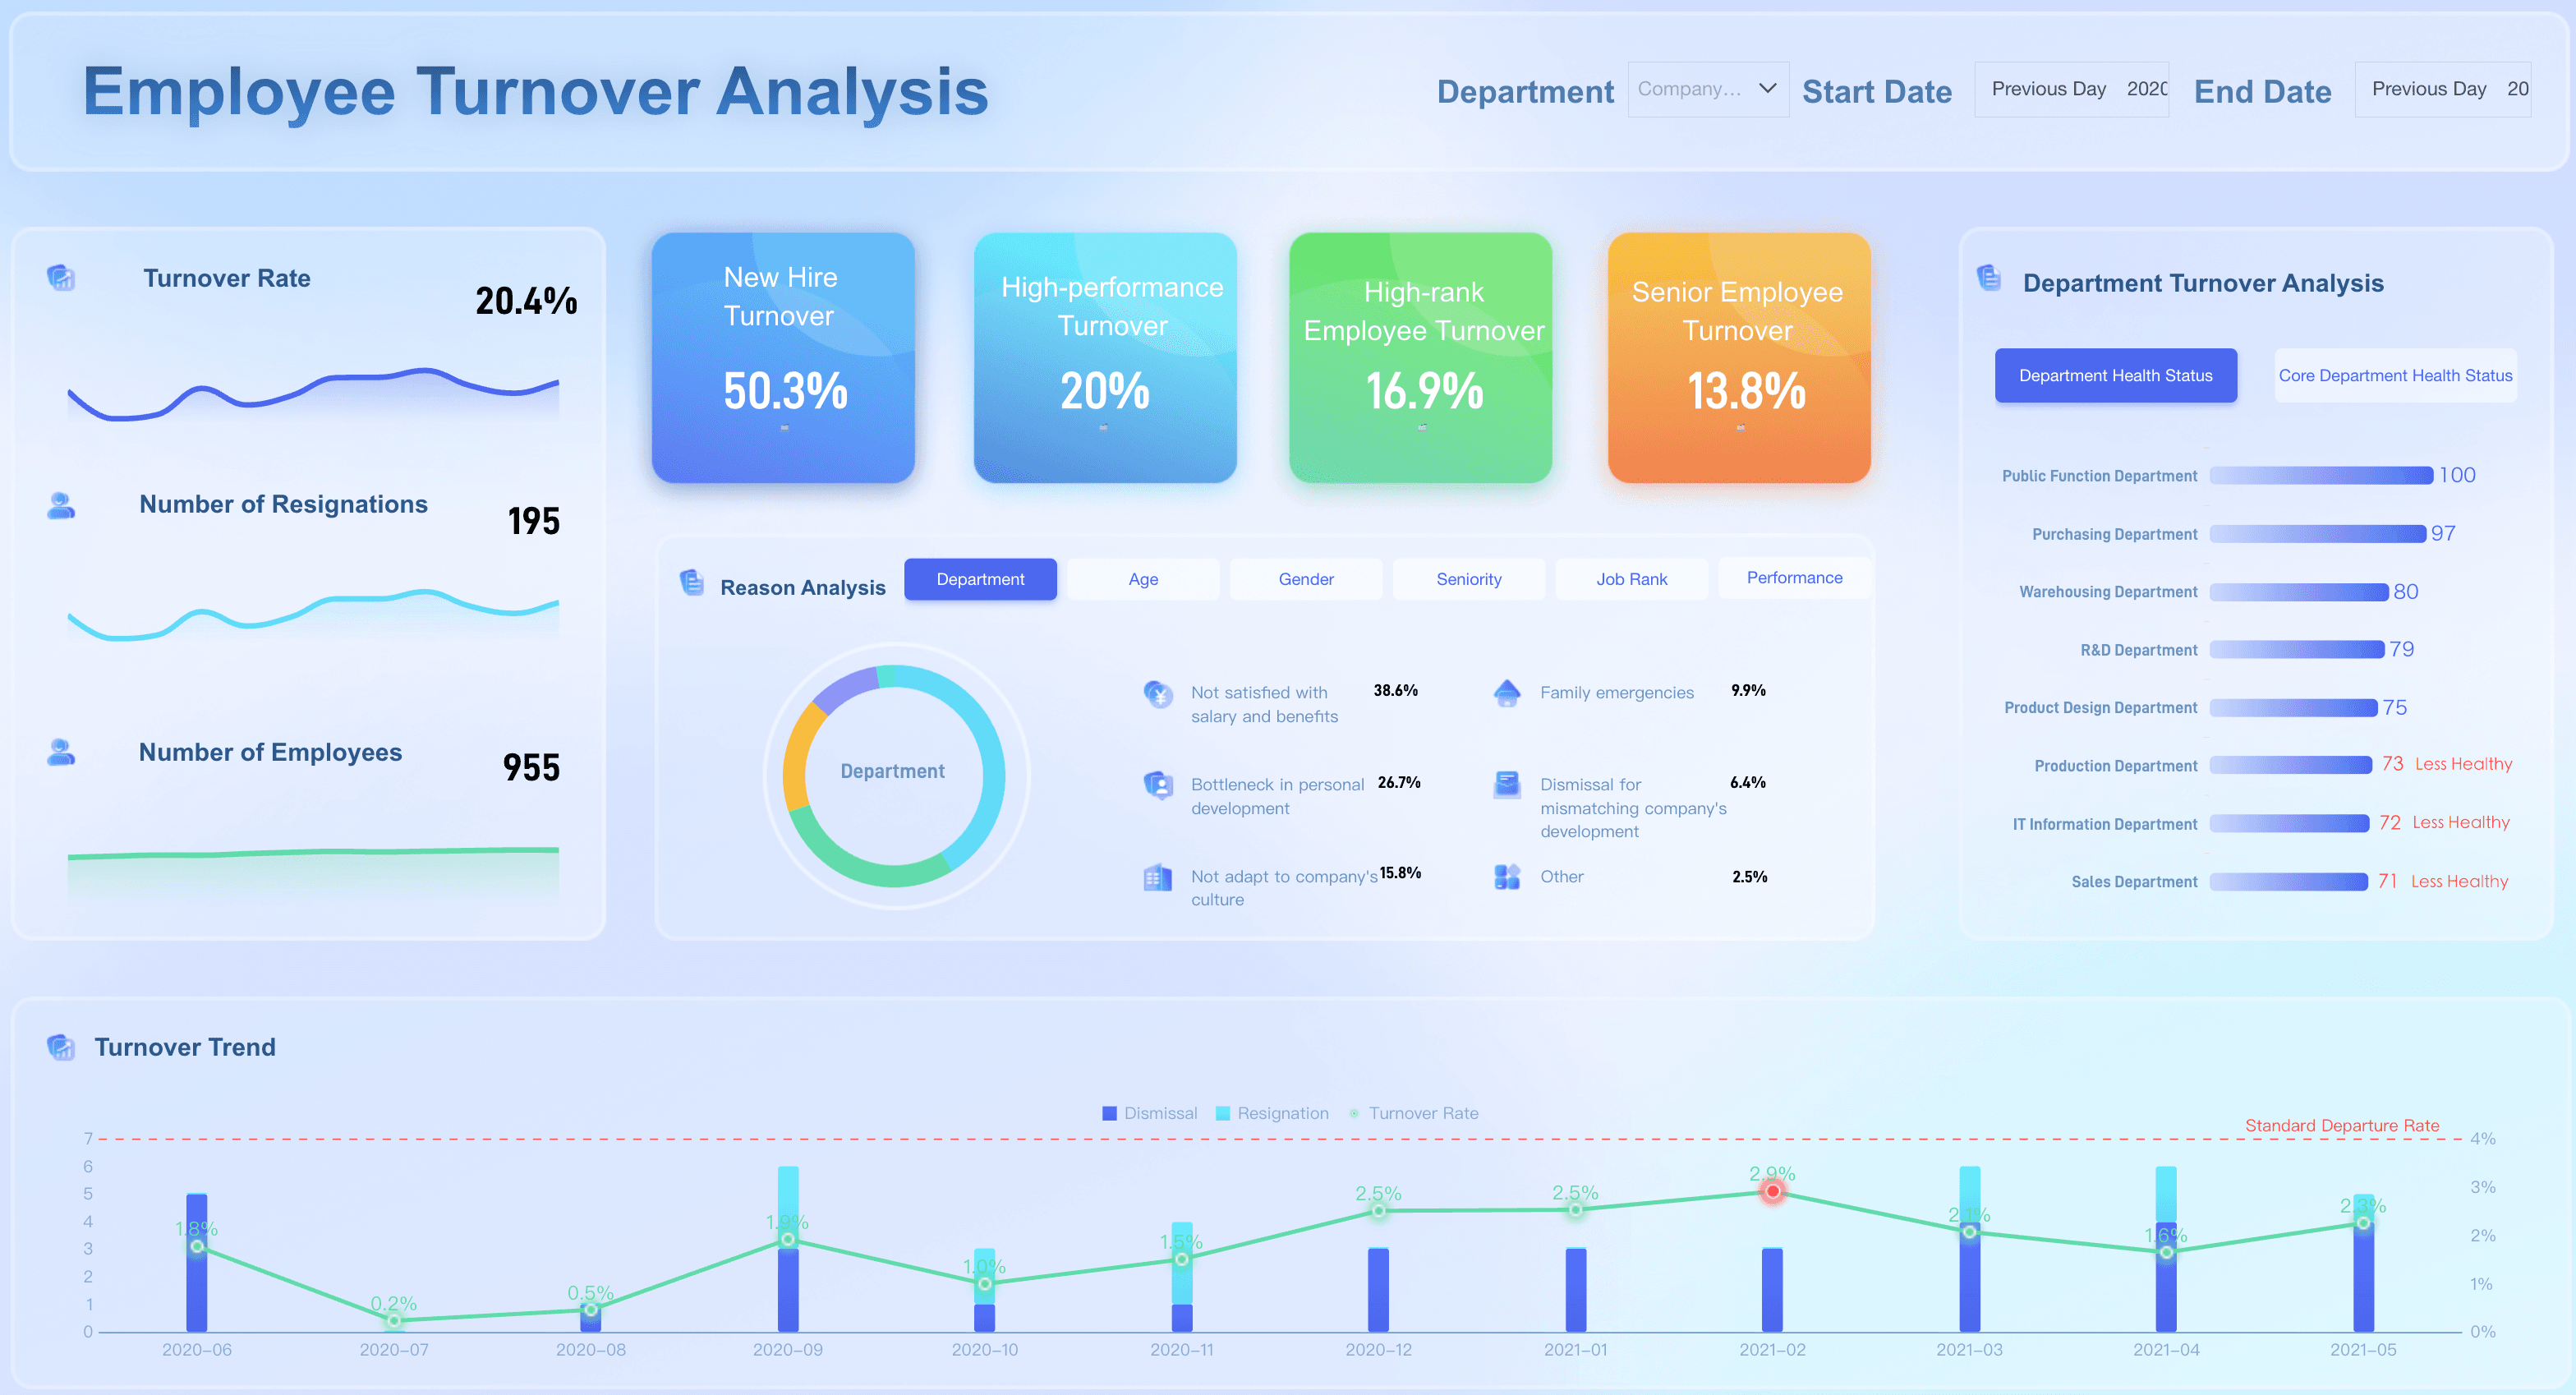
- Employee Turnover Dashboard: a turnover dashboard helps organizations understand why employees leave and identify factors that impact retention. By analyzing turnover trends and workforce stability, HR teams can develop more effective retention strategies.
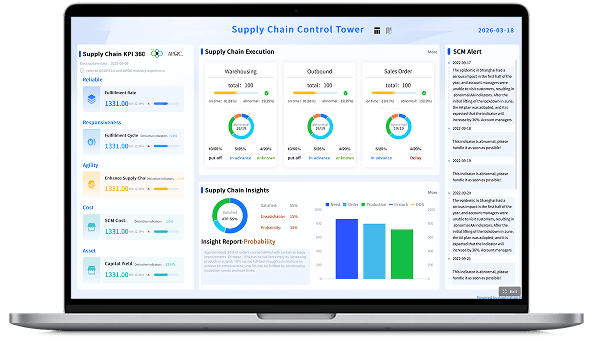
- Workforce Analytics Dashboard: a workforce analytics dashboard provides a high-level view of organizational health and workforce trends. It enables executives and HR leaders to make strategic decisions based on comprehensive workforce data.
- Employee Engagement Dashboard: an employee engagement dashboard measures workforce satisfaction and engagement levels. It helps organizations understand employee sentiment and create a more positive workplace culture.
- Learning and Development Dashboard: A learning and development dashboard tracks employee training activities and skill development initiatives. HR teams can use it to evaluate training effectiveness and support continuous learning.
- Diversity and Inclusion Dashboard: a diversity and inclusion dashboard helps organizations monitor workforce diversity and track progress toward DEI goals. It provides insights that support equitable hiring, promotion, and retention practices.
Key Metrics in an HR Dashboard
- Workforce Overview. Track organizational health at a glance:
- Total headcount
- Active employees
- New hires
- Employee distribution by department
- Workforce growth rate
- Recruitment Metrics. Measure hiring efficiency:
- Open positions
- Applicant volume
- Candidate conversion rate
- Time-to-hire
- Cost-per-hire
- Offer acceptance rate
- Employee Retention Metrics. Understand workforce stability:
- Turnover rate
- Voluntary turnover
- Employee tenure
- Retention rate
- Exit reasons analysis
- Attendance and Productivity Metrics. Monitor workforce utilization:
- Attendance rate
- Absenteeism rate
- Overtime hours
- Leave utilization
- Productivity indicators
- Diversity and Inclusion Metrics. Track workforce diversity initiatives:
- Gender distribution
- Age demographics
- Ethnic diversity
- Leadership diversity
- Inclusion benchmarks
- Learning and Development Metrics. Evaluate employee growth:
- Training completion rate
- Certification progress
- Learning hours per employee
- Skill development trends
How to Build an HR Dashboard
- Step 1: Define HR Objectives
Identify the workforce goals you want to measure, such as retention, hiring efficiency, or employee engagement.
- Step 2: Select Relevant KPIs
Choose metrics that directly support your HR strategy and business objectives.
- Step 3: Connect Data Sources
Integrate HRIS, ATS, payroll, learning management systems, and survey platforms.
- Step 4: Design Dashboard Visualizations
Use charts, scorecards, heatmaps, and trend analyses to present data clearly.
- Step 5: Automate Reporting
Set up scheduled refreshes and report distribution workflows.
- Step 6: Continuously Improve
Review dashboard performance regularly and refine metrics as organizational priorities evolve.
HR Dashboard Examples
High-impact HR dashboards share a common trait: they're scoped to specific decisions, not comprehensive data inventories. Below are proven configurations across key HR domains:
FAQs
An HR dashboard is a centralized visual interface that consolidates workforce metrics — spanning recruitment, retention, compensation, engagement, learning, and compliance — into a single, continuously updated view. It replaces fragmented reporting workflows with a unified lens on organizational health, enabling HR professionals and business leaders to monitor trends, identify emerging risks, and make evidence-based people decisions without waiting for periodic report cycles. When designed around actual decisions rather than available data, it becomes the operational backbone of modern people analytics.
The highest-value metrics depend on your organization's current strategic priorities, but consistently impactful choices include voluntary turnover rate, time-to-fill, employee net promoter score (eNPS), headcount vs. plan variance, pay equity ratio, internal mobility rate, and quality-of-hire. Avoid vanity metrics that look impressive in presentations but don't connect to actionable decisions. Every metric on your dashboard should answer a specific question that a stakeholder acts on regularly — if it doesn't drive action, archive it in a report library rather than consuming valuable dashboard real estate.
An HR dashboard provides real-time or near-real-time visibility designed for continuous monitoring and rapid response. HR leaders and managers check it frequently to track emerging trends, spot risks, and adjust course mid-cycle. An HR report is a structured, point-in-time document produced on a scheduled basis — weekly, monthly, quarterly, or annually — intended for deeper historical analysis, trend documentation, and formal review processes. Dashboards are for managing; reports are for reviewing. Both are essential, but designing one to serve the other's purpose undermines the effectiveness of each.
Access should be role-appropriate and privacy-conscious. Executives and CHROs need aggregated organizational trends and strategic KPIs for board reporting and resource allocation. HR business partners need team-level detail and risk indicators to guide manager coaching and intervention design. People managers need visibility into their direct reports' engagement, development progress, and retention signals. Individual employees may benefit from personal development, benefits, and career path views. Critically, sensitive data — compensation details, disciplinary records, health information, individual survey responses — must be governed by strict access controls. Effective HR dashboards balance analytical transparency with responsible data stewardship; getting this balance wrong erodes trust faster than any insight can build it.
Designing around available data instead of required decisions. Teams inventory every field in their HRIS, create visualizations for all of them, and produce comprehensive dashboards that nobody uses because nobody needed most of what's displayed. The fix is simple but requires discipline: start with stakeholder interviews, identify the 5–8 questions that drive weekly or monthly decisions, and build only what answers those questions. You can always expand scope later based on demonstrated usage — but you cannot recover credibility lost to a cluttered, unfocused first release that trained your audience to ignore the tool.
