
What Is a Financial Dashboard?
Financial Dashboard vs. Financial Report
Finance teams produce both constantly, yet confusing them is one of the most common sources of wasted analytical effort. The distinction matters because each serves a fundamentally different decision cadence.
- Financial dashboards are monitoring instruments designed for ongoing fiscal management. They surface real-time or near-real-time indicators such as daily cash burn, budget-to-actual variance by cost center, rolling revenue forecasts, and accounts receivable aging. Their value lies in enabling timely intervention — catching overruns before they become crises, spotting liquidity gaps before they constrain operations.
- Financial reports are structured retrospective documents produced on defined cycles — monthly close packages, quarterly board decks, annual audited statements. They provide comprehensive historical analysis, regulatory compliance documentation, and narrative context that dashboards intentionally omit. Their value lies in accountability, auditability, and strategic review.
Dashboards manage the present; reports document the past. Organizations that try to make one tool serve both purposes typically end up with dashboards too dense to monitor and reports too stale to act on.
More resources:
- Dive deeper on the question, "What is a dashboard?"
- Download interactive marketing dashboard templates
Don't just collect data. Visualize what matters.
Download the Dashboard Guide to learn:
- 10 essential steps to build effective dashboards
- How to choose the right charts and avoid visual clutter
- 15 top-notch dashboard templates for 2026

Why Financial Dashboards Matter Now
Improve Financial Visibility Across the Organization
Financial data is often stored across ERP systems, accounting software, spreadsheets, and business applications. A financial dashboard brings these scattered sources together into a unified view.
Finance leaders can quickly understand:
- Where revenue is generated
- How costs are changing
- Which departments impact profitability
- Whether business goals are being achieved
Replace Manual Financial Reporting
Traditional financial reporting requires repetitive data collection, spreadsheet consolidation, and manual calculations.
A financial dashboard automates financial analysis by:
- Connecting directly with existing data sources
- Updating financial metrics automatically
- Reducing reporting time and human errors
- Providing consistent financial insights across teams
Enable Faster Strategic Decisions
A financial dashboard helps executives move from reactive reporting to proactive decision-making.
By monitoring real-time financial indicators, businesses can:
- Detect abnormal cost increases
- Optimize resource allocation
- Improve budgeting accuracy
- Respond quickly to financial risks
Types of Financial Dashboards
Financial analytics serves multiple stakeholders with different scopes, time horizons, and regulatory considerations. Purpose-built views deliver more value than monolithic designs:
- Executive Financial Overview Dashboards: Consolidated views of revenue, EBITDA, cash position, and key ratios against plan and prior periods. CEOs, boards, and investors use these for rapid organizational health assessment and strategic resource allocation decisions without navigating detailed ledgers.
- Cash Flow & Liquidity Dashboards: Real-time monitoring of operating cash flow, working capital components, receivables/payables aging, debt service coverage, and runway projections. Treasury teams and CFOs rely on these to manage liquidity risk, optimize cash conversion cycles, and ensure covenant compliance.
- Budget vs. Actual Dashboards: Continuous variance tracking by department, project, or cost center with drill-down to line-item detail. Department heads and FP&A analysts use these to identify overruns early, understand root causes, and adjust spending within fiscal periods rather than explaining variances after close.
- Profitability Analysis Dashboards: Margin decomposition by product, customer, region, or channel with contribution margin waterfall views. Finance and business leaders use these to identify profit drivers and drainers, inform pricing decisions, and allocate resources toward highest-return segments.
- Accounts Receivable & Payable Dashboards: Aging analysis, collection effectiveness, DSO/DPO trends, bad debt exposure, and payment term compliance. AR/AP teams and controllers use these to optimize working capital, prioritize collection efforts, and manage vendor relationships strategically.
- Financial Close & Compliance Dashboards: Close task progress, journal entry exception tracking, reconciliation status, audit finding resolution, and control testing results. Accounting managers and internal audit teams use these to streamline period-end processes, maintain control effectiveness, and demonstrate compliance readiness continuously.
How to Build a Financial Dashboard
1. Define Financial Goals and KPIs
Determine what financial questions the dashboard should answer.
Examples:
- Are revenues growing?
- Are expenses under control?
- Which areas generate the highest profit?
2. Collect and Connect Financial Data
Integrate data from:
- ERP systems
- Accounting platforms
- Databases
- Spreadsheets
Ensure financial data is accurate and consistent.
3. Select Relevant Financial Metrics
Choose KPIs that align with business objectives.
Avoid displaying unnecessary data and focus on metrics that support decisions.
4. Design Financial Dashboard Layout
Create an intuitive dashboard structure:
- KPI summary at the top
- Trend analysis in the middle
- Detailed breakdowns below
Use charts and visualizations to make complex financial information easier to understand.
5. Monitor and Optimize
Regularly update dashboard metrics and improve layouts based on changing business needs.
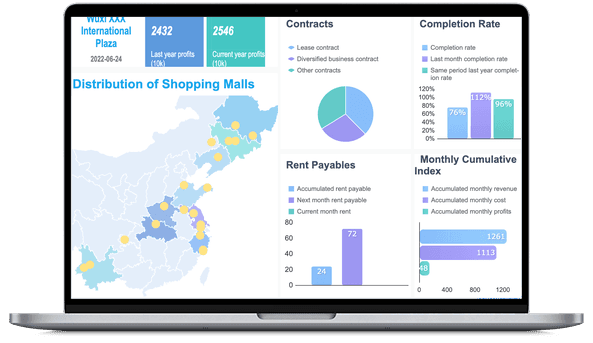
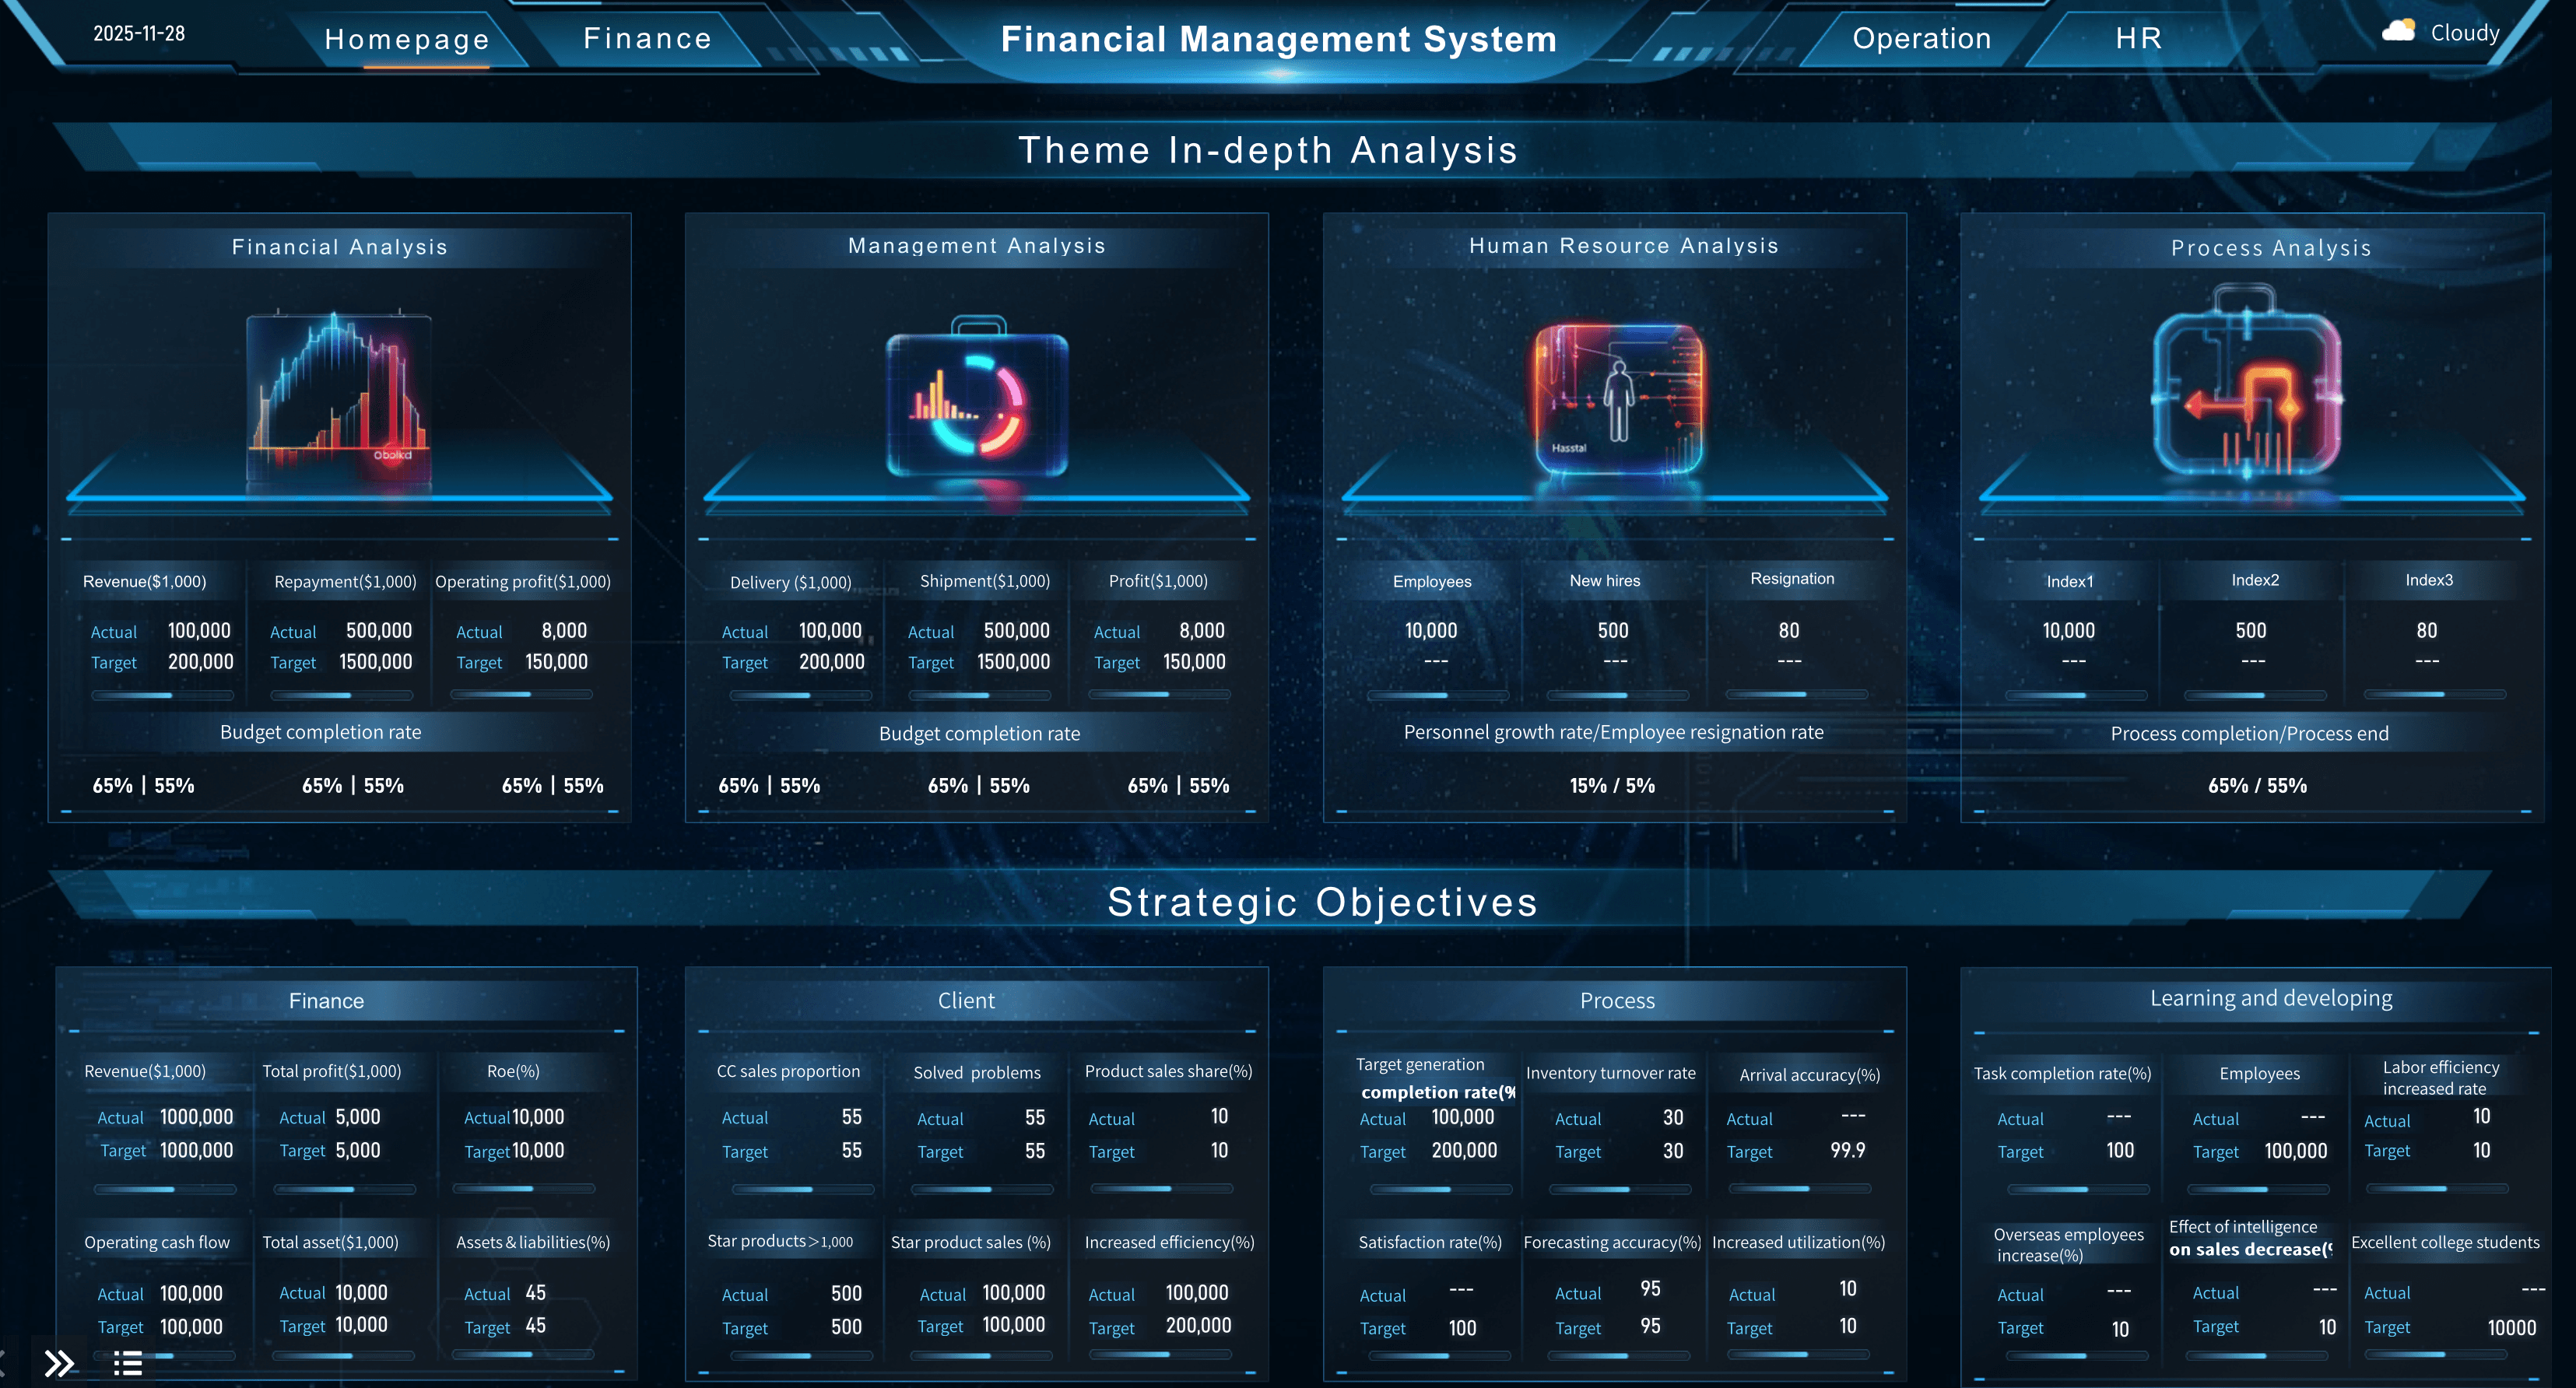
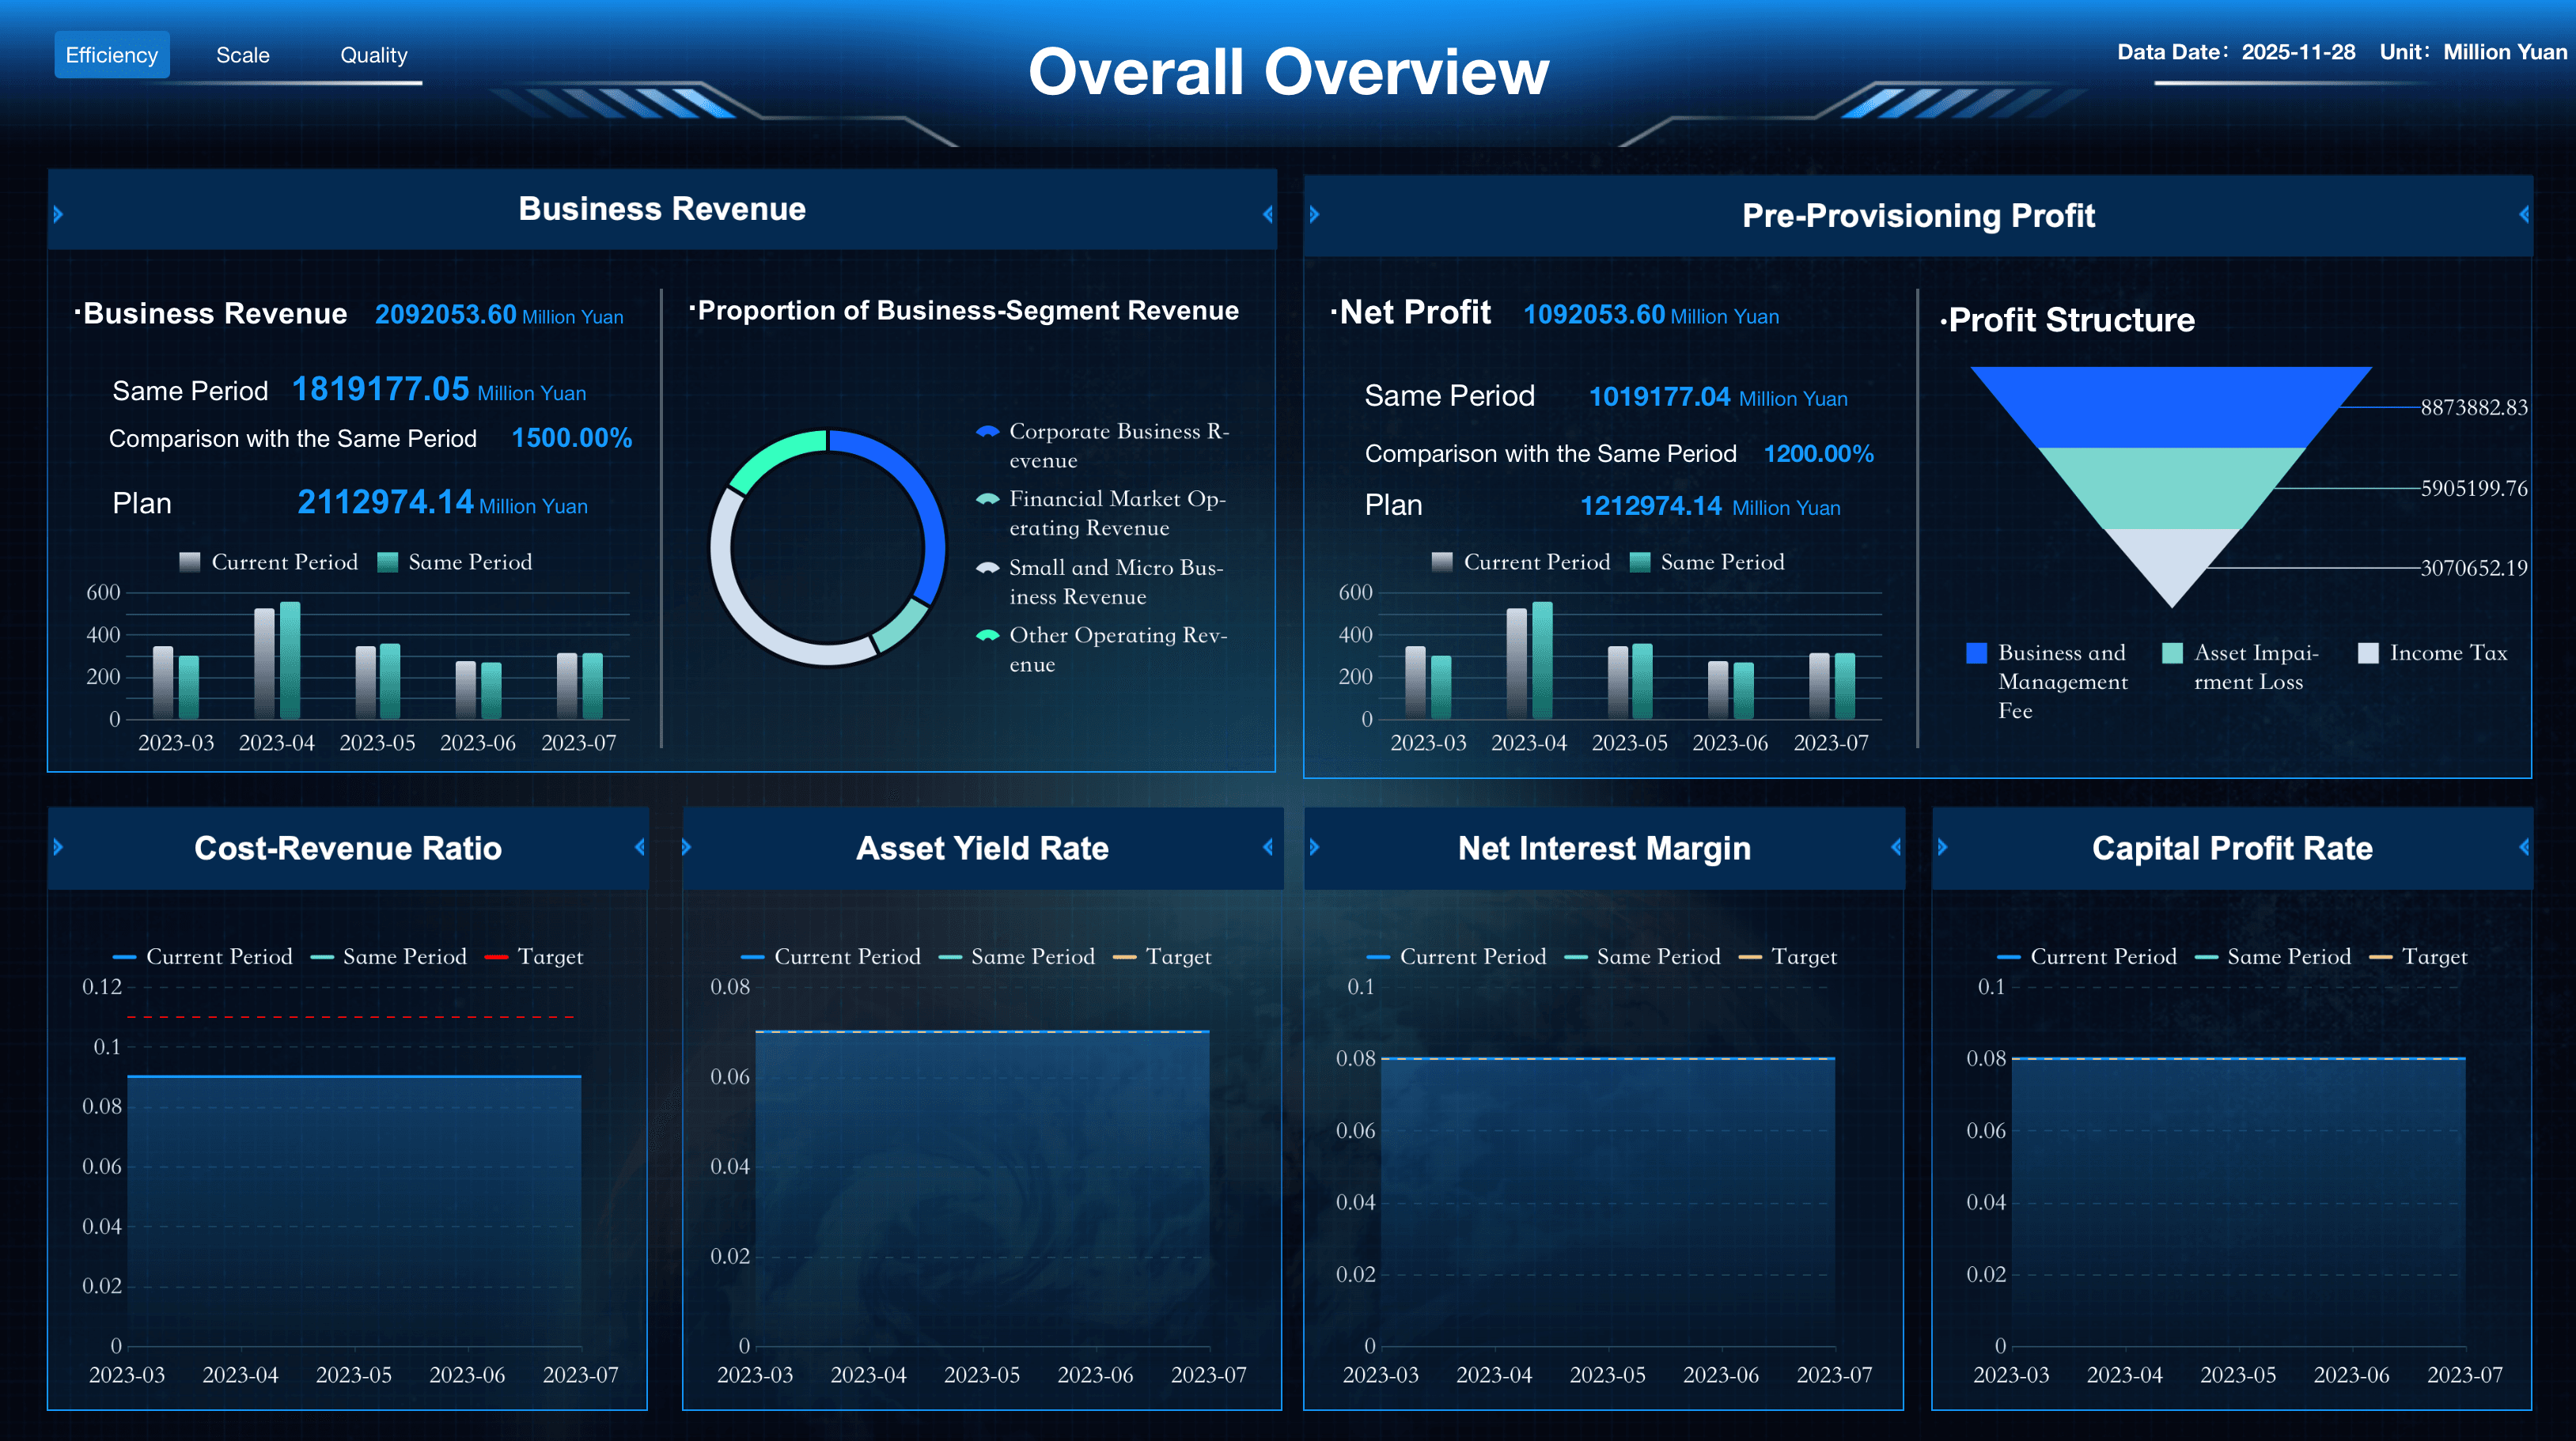
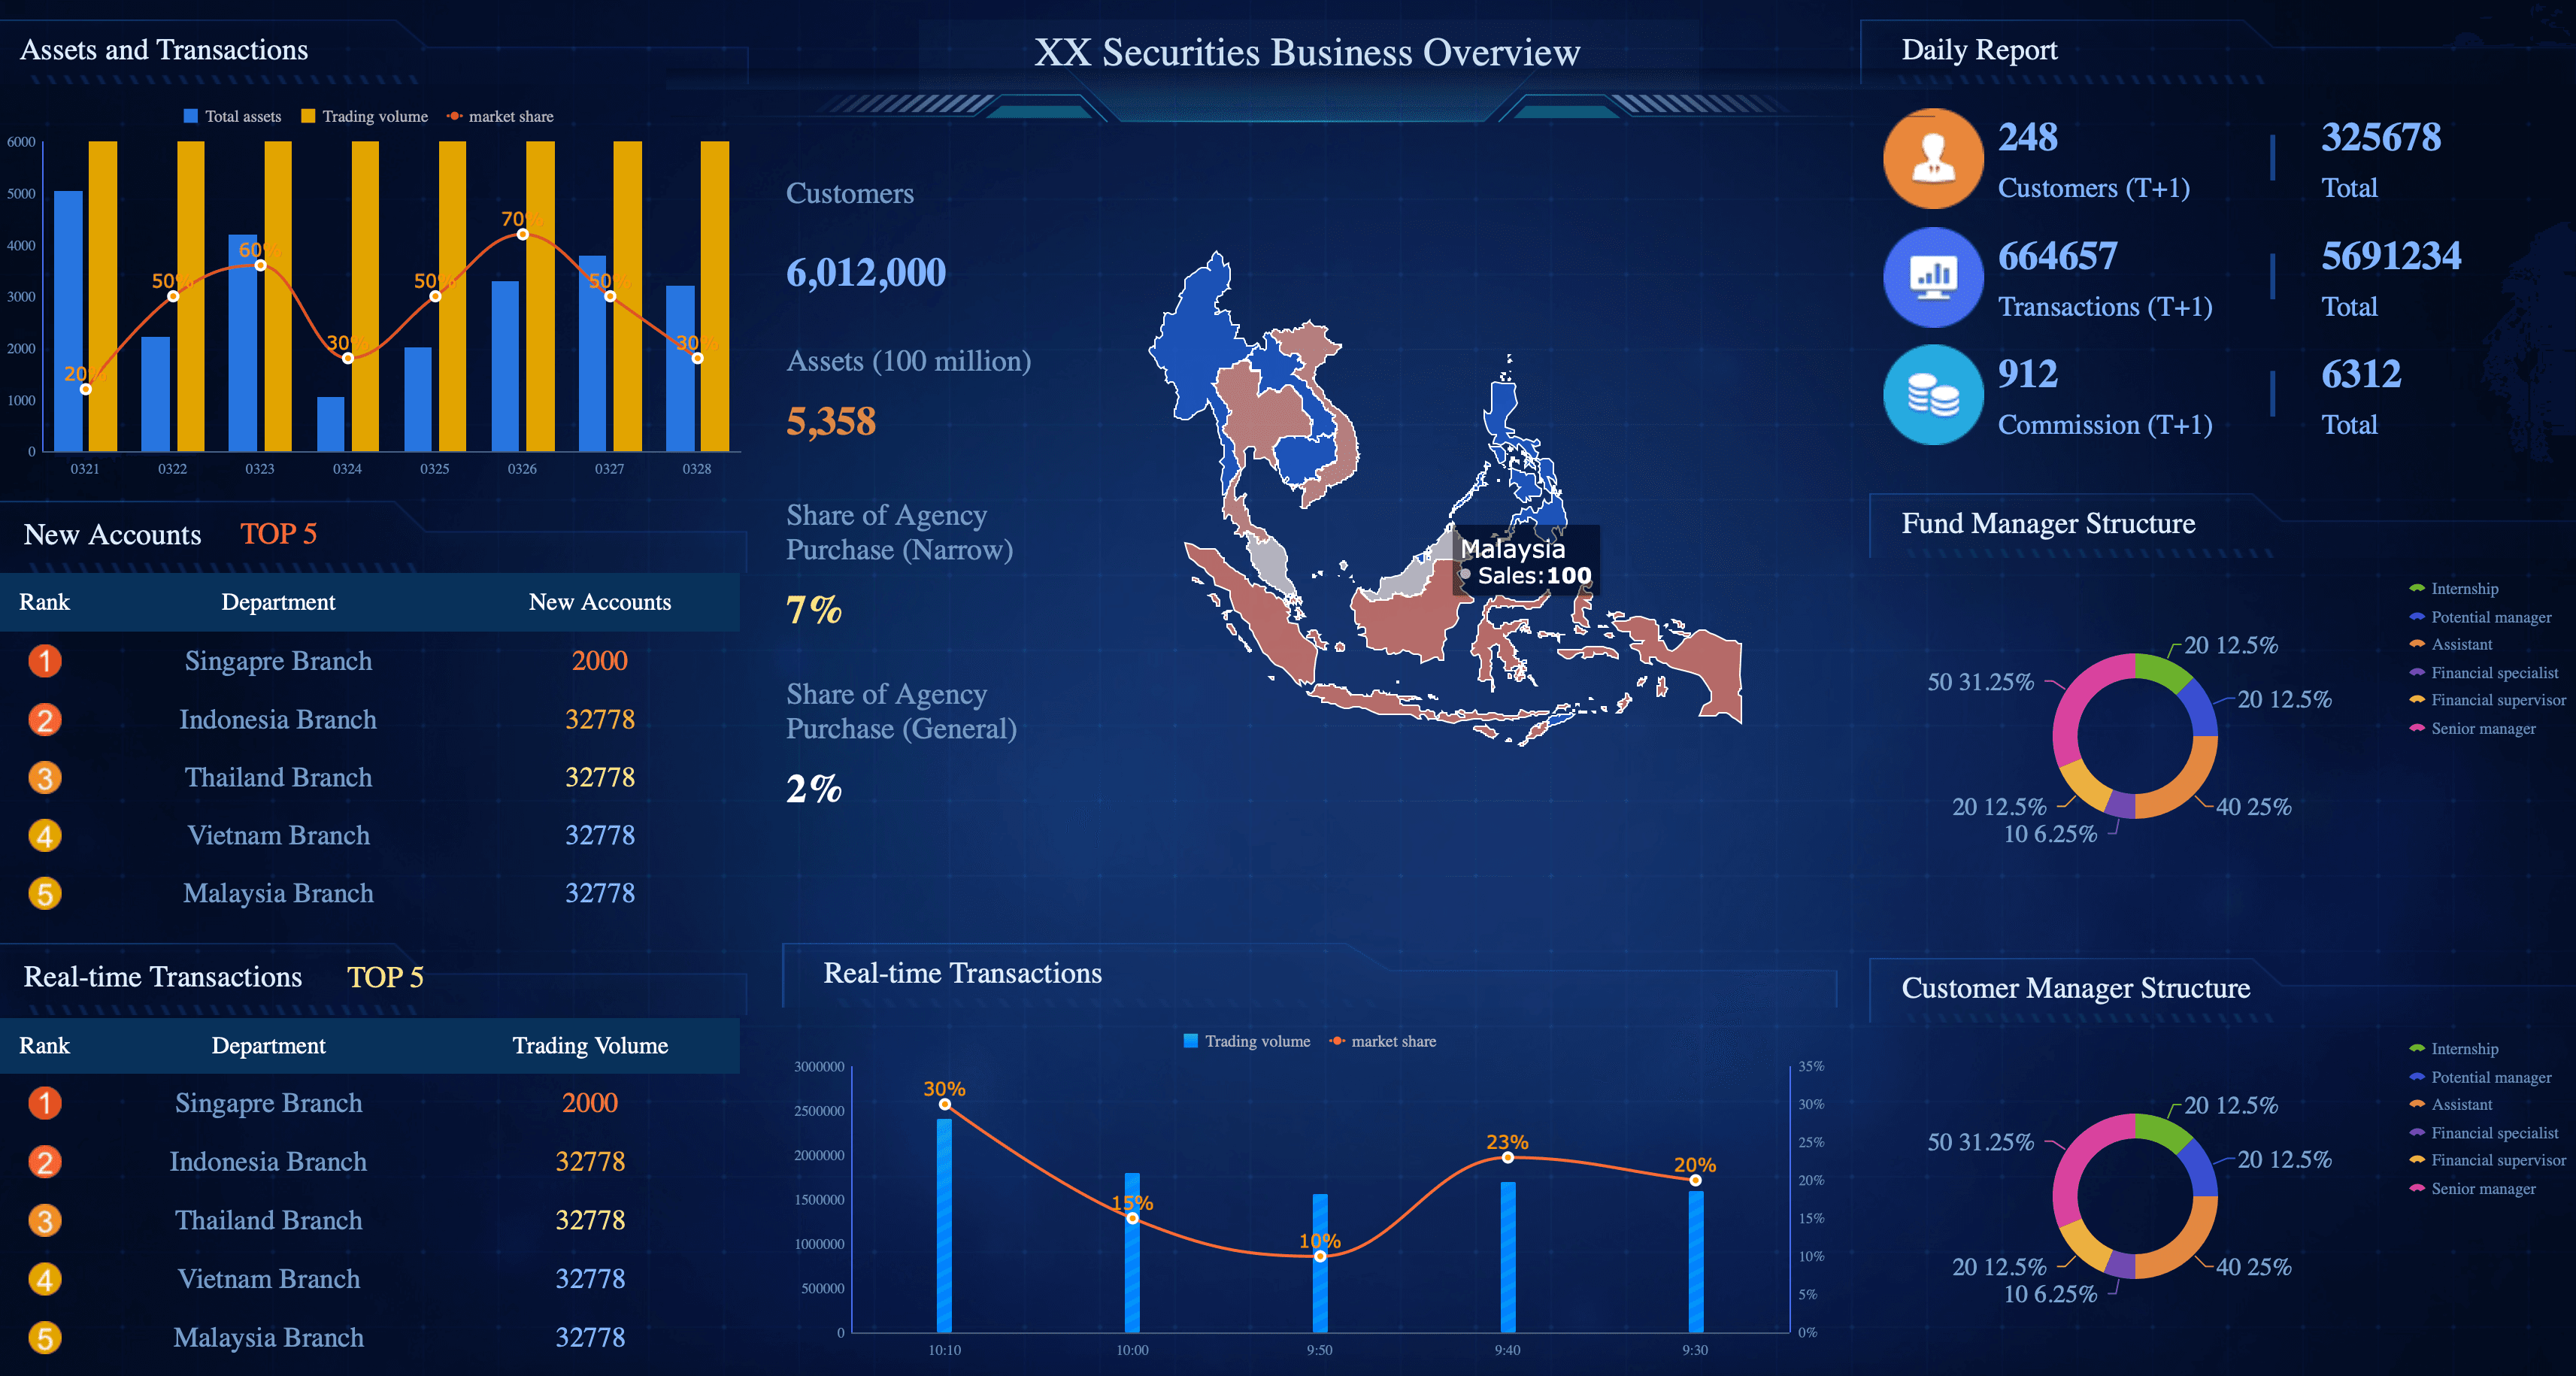
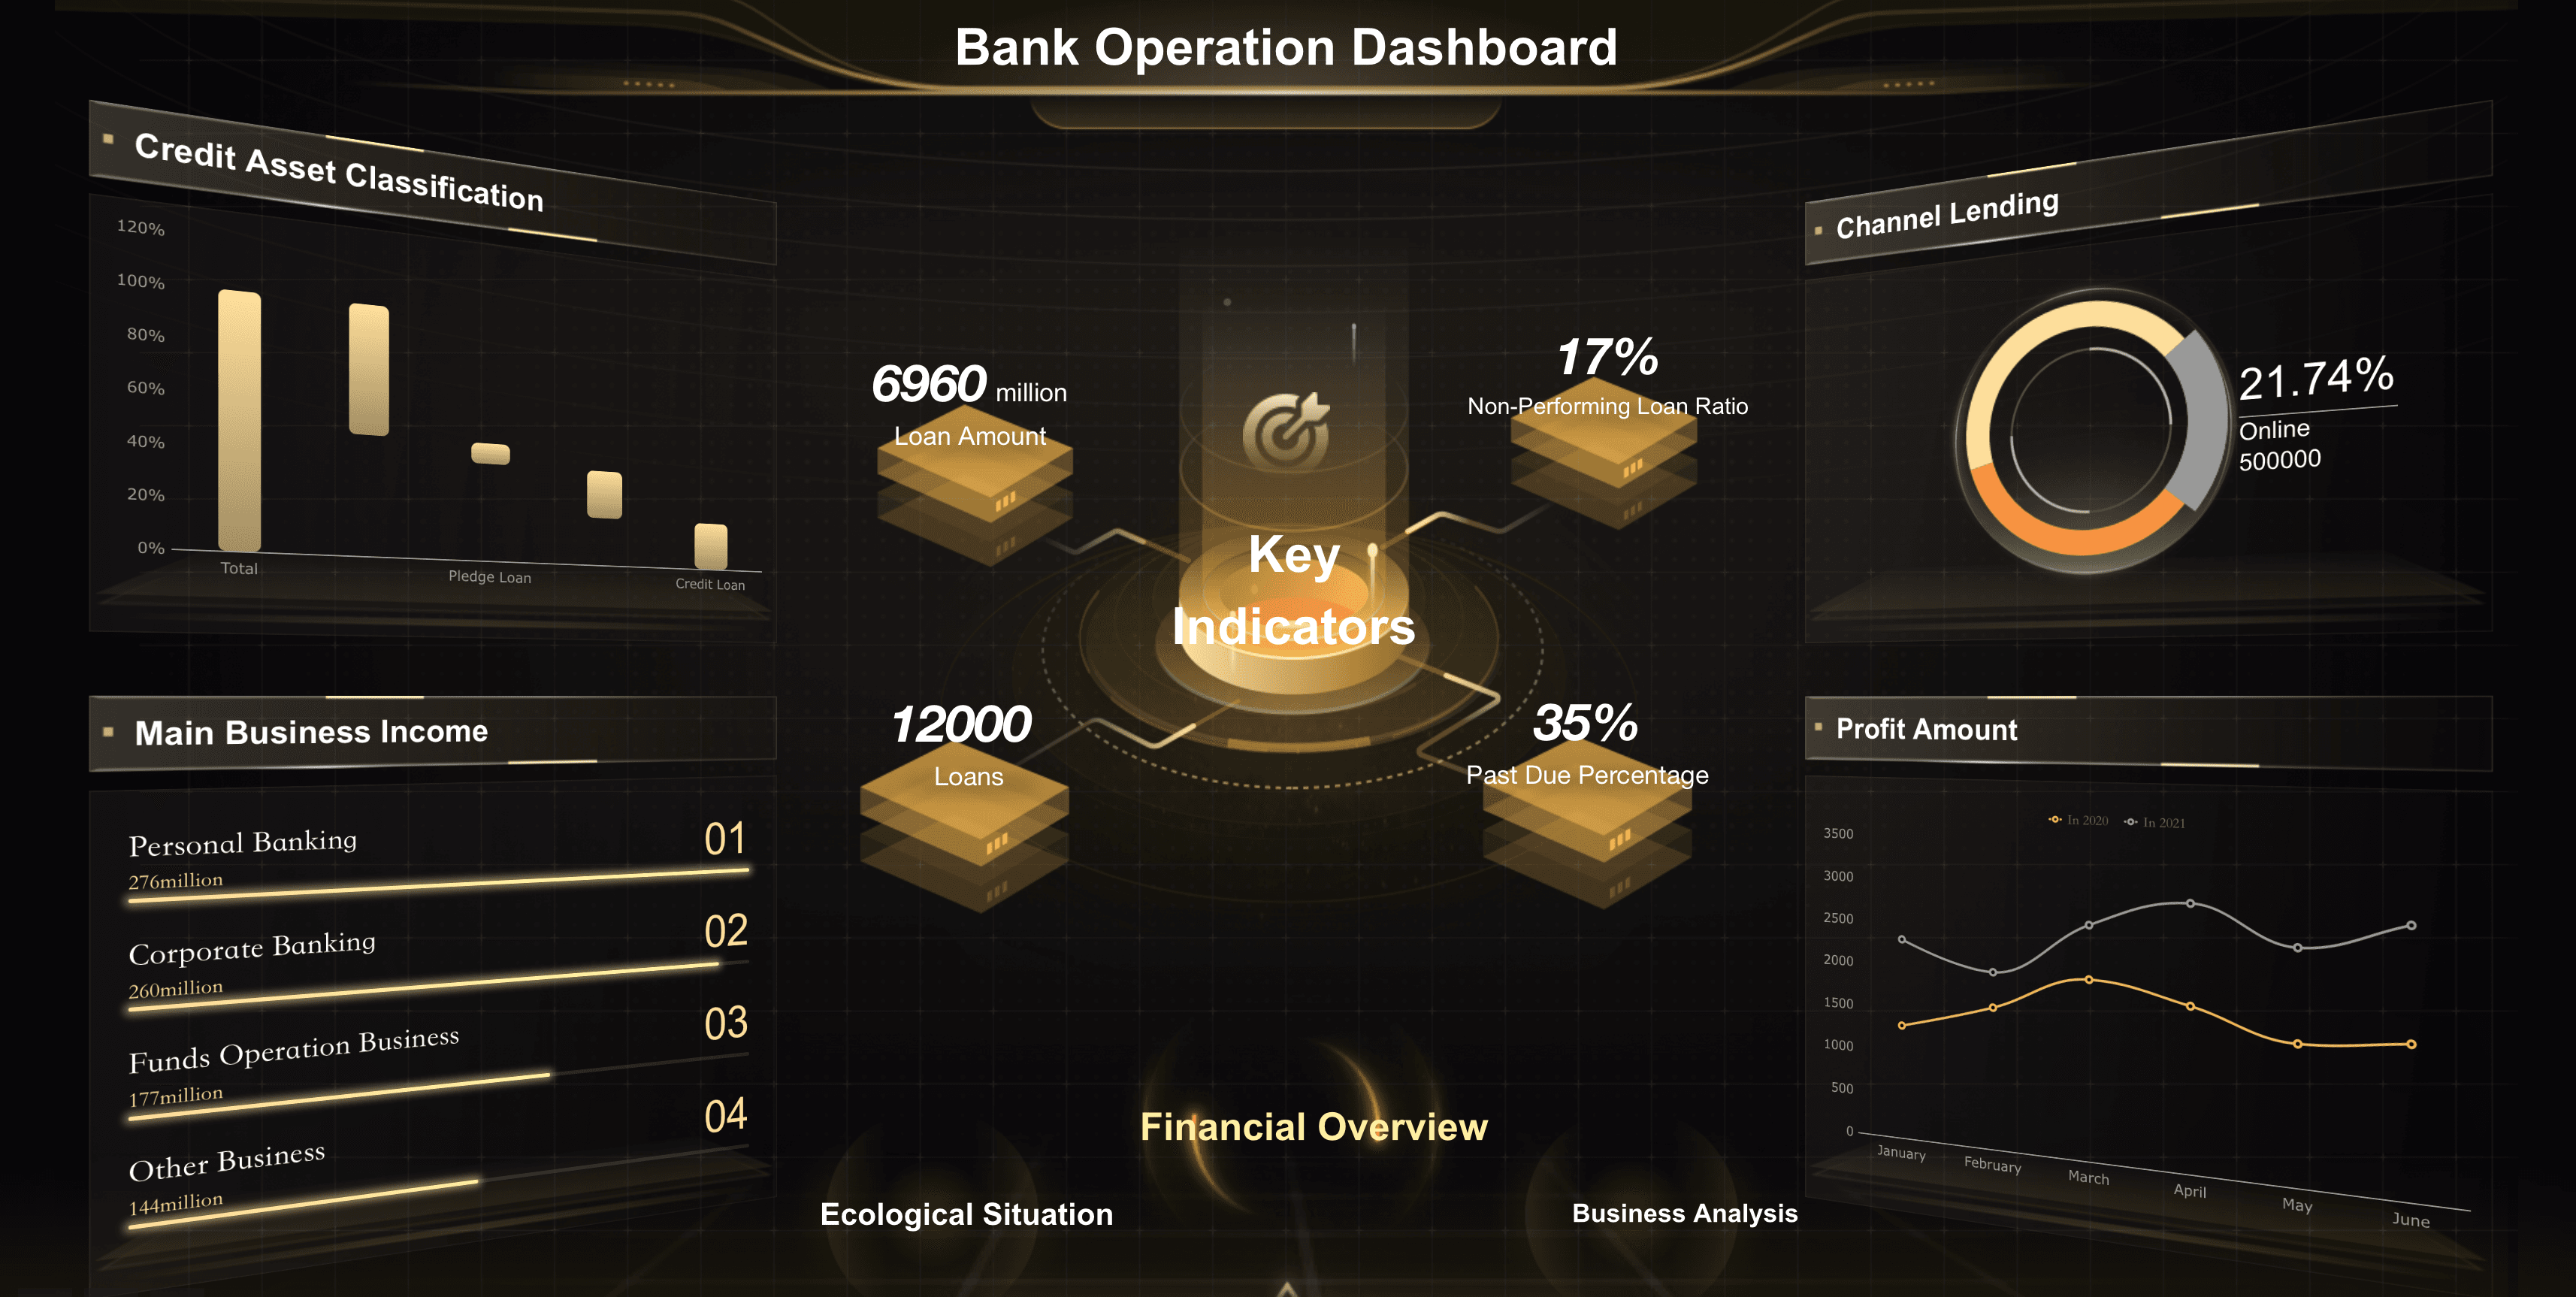
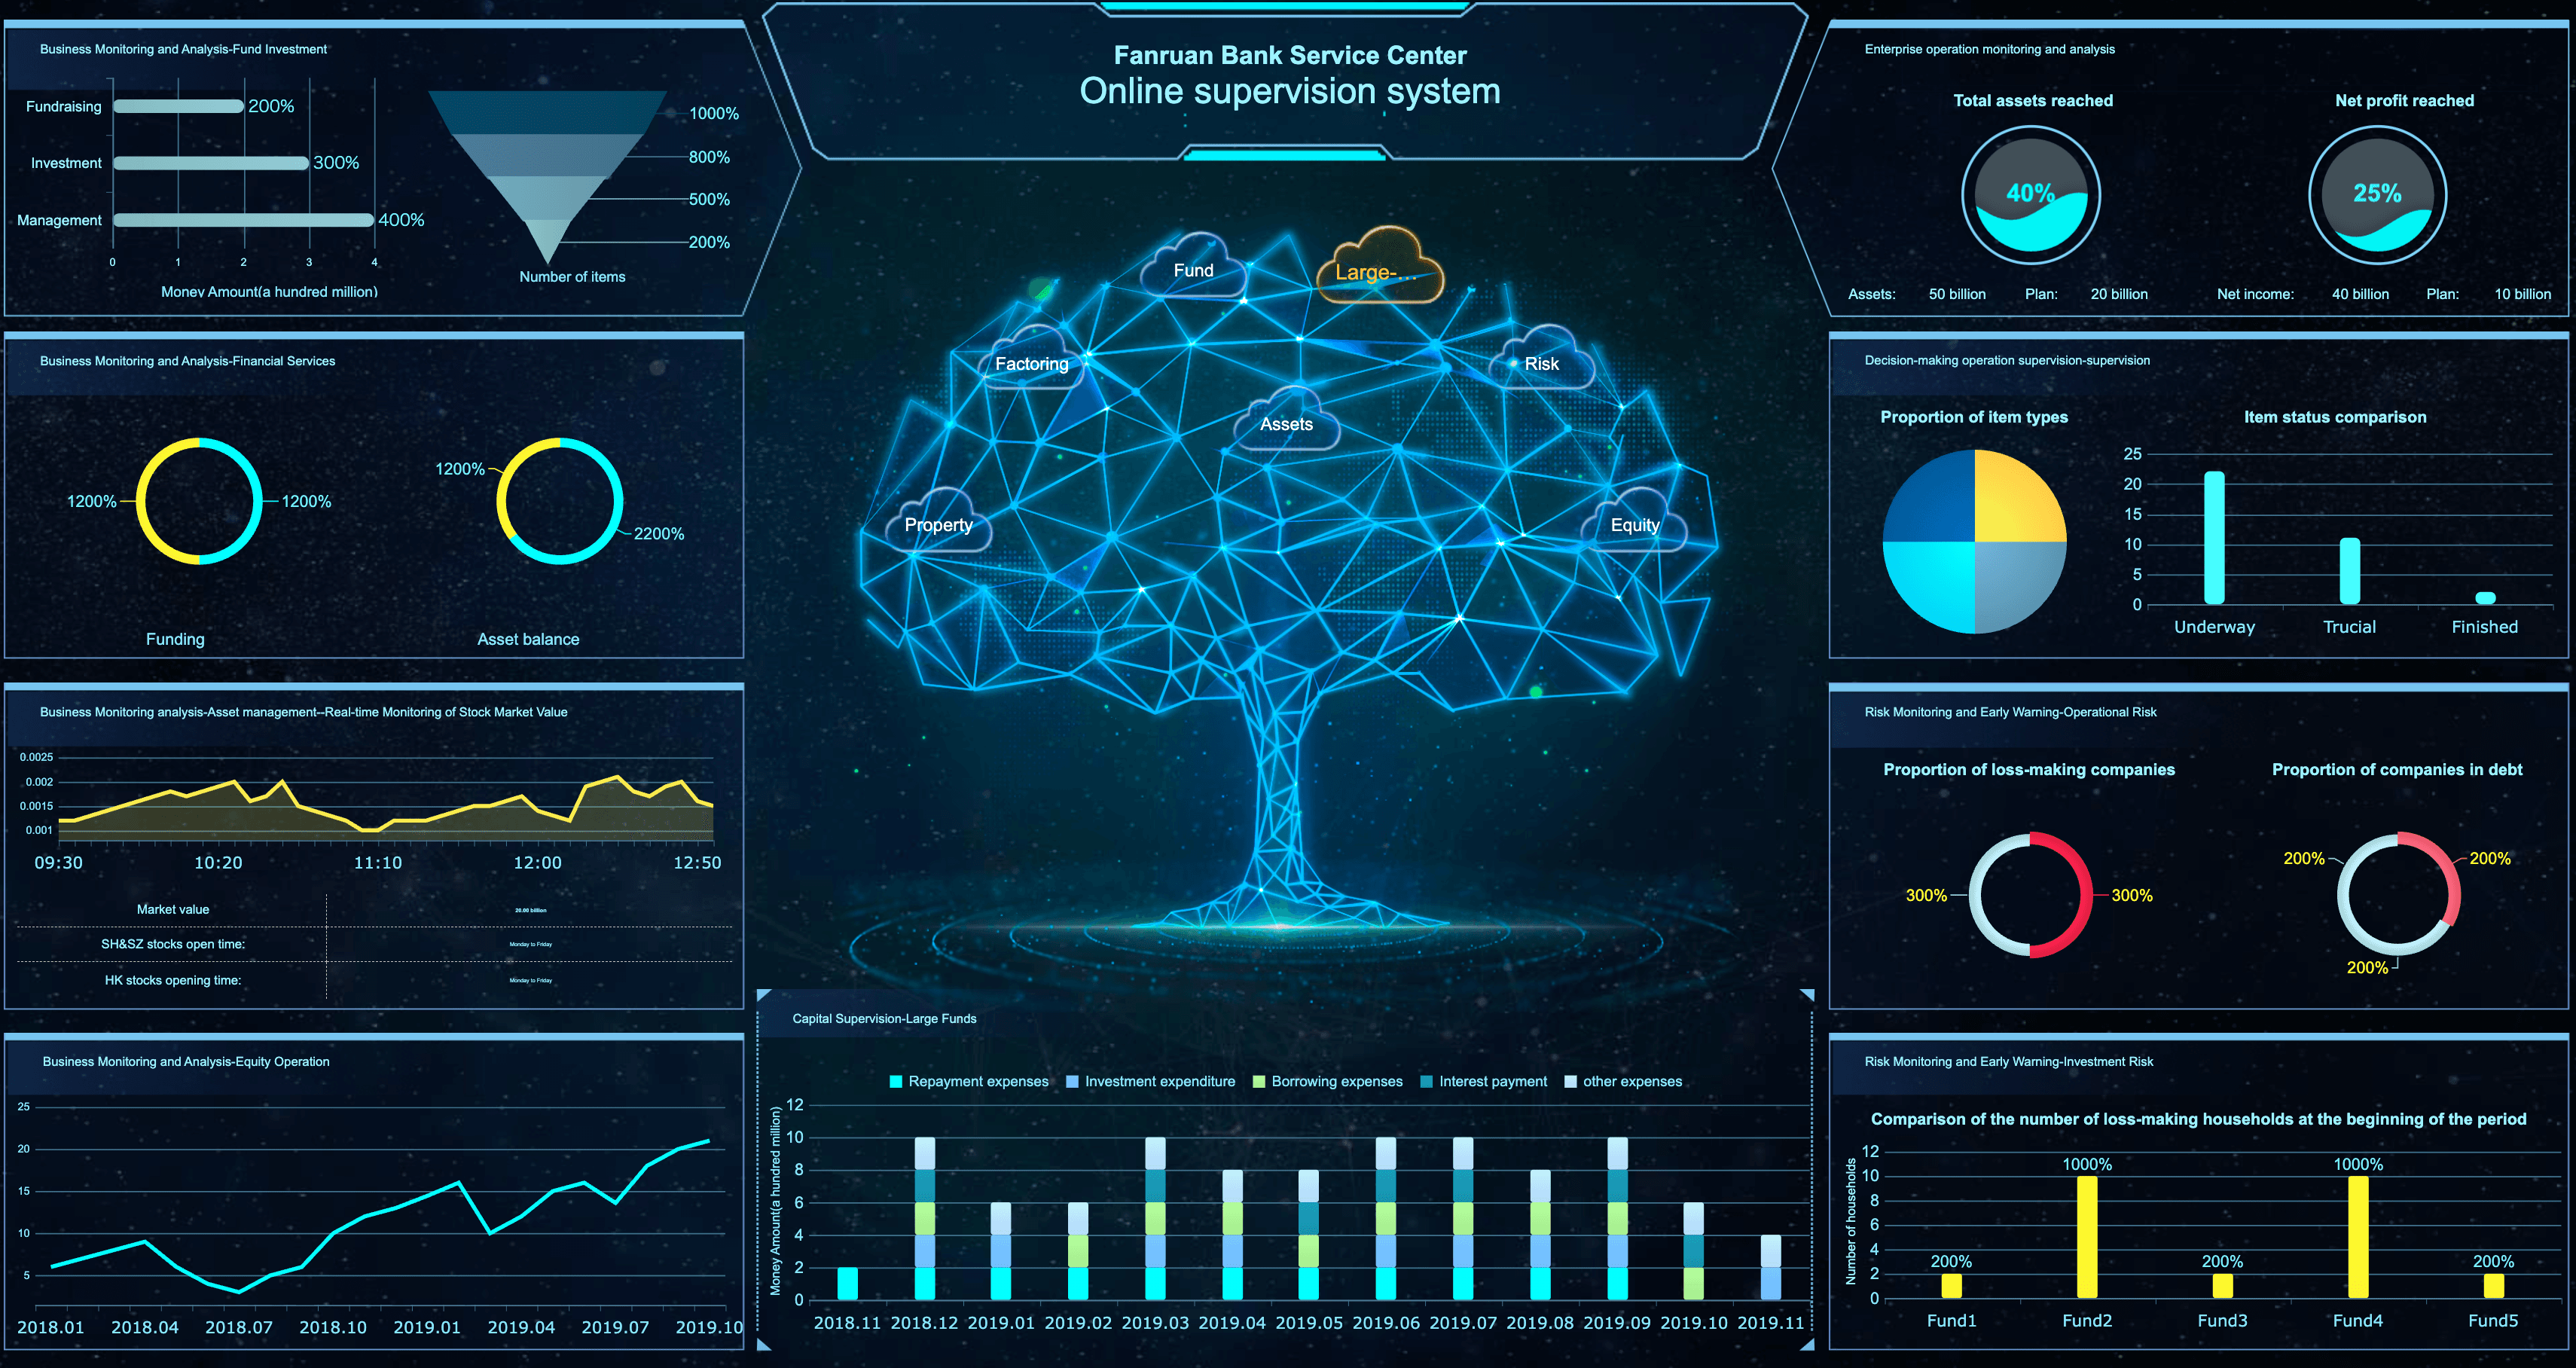
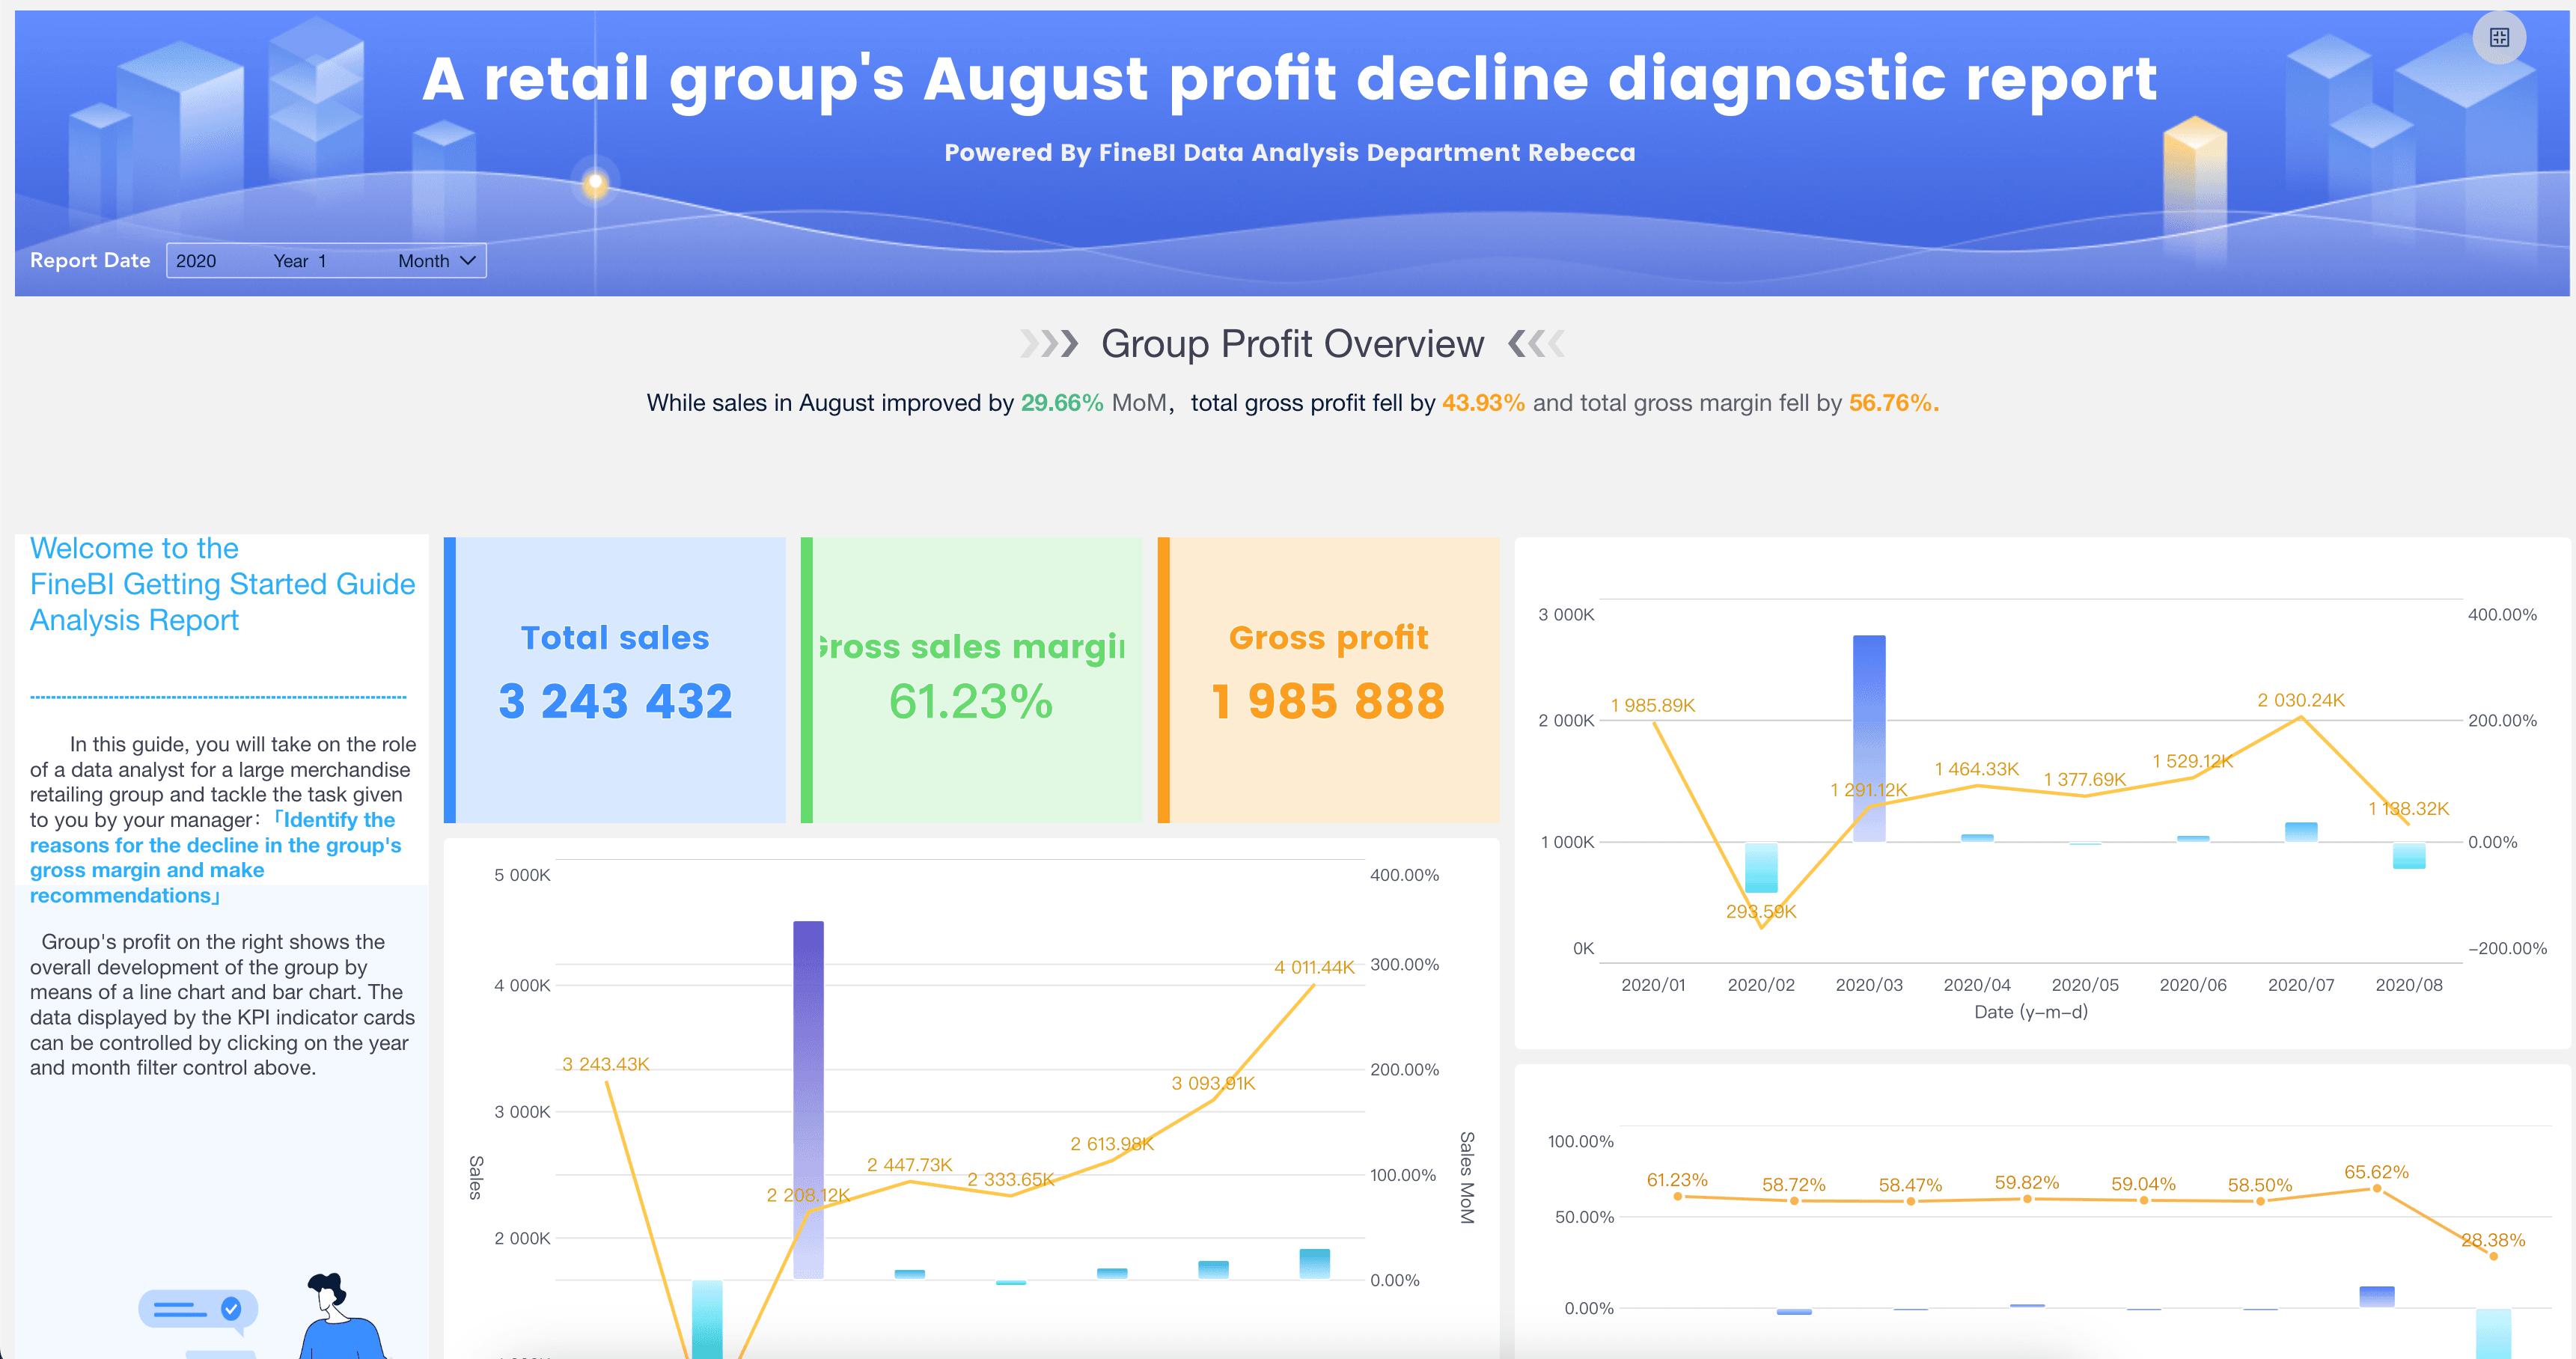
Financial Dashboard Examples
High-impact financial dashboards share a common trait: they're scoped to specific fiscal decisions and validated against source systems. Below are proven configurations across key finance domains:

FAQs
A financial dashboard is a centralized visual interface that consolidates an organization's key fiscal metrics — including revenue, expenses, cash flow, profitability, budget adherence, and working capital — into a single, continuously updated view. It enables CFOs, controllers, FP&A professionals, and business leaders to monitor financial health, detect emerging risks, and make evidence-based allocation decisions without waiting for periodic report cycles or manually reconciling disparate data sources. When designed around actual decisions and validated against source systems, it becomes the operational backbone of modern financial management.
The highest-value metrics depend on your organization's industry, stage, and current priorities, but consistently impactful choices include operating cash flow, revenue vs. target, gross and EBITDA margins, budget-to-actual variance, days sales outstanding (DSO), and liquidity ratios. Avoid including every available GL line item — financial dashboards should highlight material deviations and forward-looking signals, not replicate the chart of accounts. Every metric should trace to a specific decision someone makes regularly; if it doesn't drive action, it belongs in a scheduled report, not on a live monitoring surface.
A financial dashboard provides real-time or near-real-time visibility designed for continuous monitoring and proactive management. Finance leaders check it frequently to track cash position, spot budget overruns early, and adjust forecasts as conditions evolve. A financial report is a structured, point-in-time document produced on a scheduled basis — monthly close packages, quarterly earnings releases, annual audited statements — intended for comprehensive historical analysis, regulatory compliance, and formal stakeholder review. Dashboards manage the present; reports document the past. Both are essential, but designing one to serve the other's purpose undermines the effectiveness of each.
Access should align with decision authority and data sensitivity. CFOs and executives need consolidated organizational views with strategic KPIs and trend indicators. FP&A analysts need drill-down capability across dimensions (department, product, region) for variance investigation and forecasting. Department heads need visibility into their own budget consumption and cost drivers. Treasury teams need granular cash and liquidity monitoring. Critically, sensitive financial data — compensation details, unannounced M&A activity, pre-release earnings — must be governed by strict access controls and audit trails. Effective financial dashboards balance analytical transparency with appropriate confidentiality; getting this balance wrong creates compliance risk and erodes stakeholder trust.
Prioritizing comprehensiveness over accuracy and actionability. Teams attempt to replicate entire P&L statements or balance sheets visually, producing dense interfaces that overwhelm users and introduce reconciliation complexity that undermines trust. Financial dashboards earn adoption by being reliably accurate, materially focused, and clearly tied to decisions — not by displaying maximum data volume. Start with 5–8 validated, decision-critical metrics, establish user confidence through consistent accuracy, and expand scope only as trust and usage patterns justify it. A simple, trusted dashboard outperforms a comprehensive, questionable one every time.
Yes. FineReport handles complex multi-source financial data integration (ERP, banking APIs, expense systems, subsidiary ledgers) and delivers precisely formatted, audit-traceable dashboards with drill-down to transaction level, automated reconciliation indicators, and scheduled distribution — well-suited for budget vs. actual tracking, financial close monitoring, regulatory reporting, and executive financial summaries requiring verified data lineage. FineBI enables FP&A analysts and finance business partners to explore financial data independently through self-service analytics, reducing IT dependency for ad-hoc variance analysis and accelerating insight-to-decision cycles. Both platforms support role-based access controls, data refresh automation, and mobile-responsive viewing essential for secure, reliable financial analytics across distributed stakeholders.
