



Digital Transformation Challenges: Breaking the Cycle of Overstock and Stockouts
Aland Group is a China-headquartered nutraceutical contract development and manufacturing organization (CDMO) with manufacturing facilities across China, the US, Europe, and Canada. Its US subsidiary, IVC, is one of North America’s largest vitamin contract manufacturers, serving major retailers and warehouse clubs. Led by Jason Sheng, Head of Digital Innovation & AI, the group set out to advance supply chain digitalization across both regions.
In contract manufacturing, each customer has unique requirements, making inventory planning particularly challenging. As the business grew, Aland Group faced a costly paradox: overstock and stockouts occurring simultaneously.
Excess and obsolete inventory tied up capital, with 128 A_Z class SKUs accounting for the bulk of the overstock and 21 SKUs remaining in the yellow zone for extended periods. Meanwhile, 23 core SKUs faced a high risk of stockouts, including one high-value item with less than two months of coverage and another with less than one month.
Although aggregate inventory figures appeared healthy, capital was tied up in products the market did not need while products in demand faced potential shortages. This “Double Hell” exposed the limitations of relying on total inventory figures without understanding demand at the SKU level.
From Mathematical Hallucinations to Reliable Supply Chain Planning
Aland Group’s initial attempts to optimize supply chain parameters revealed a critical problem: algorithms can produce misleading recommendations when their underlying data is incomplete or their assumptions do not reflect business reality.
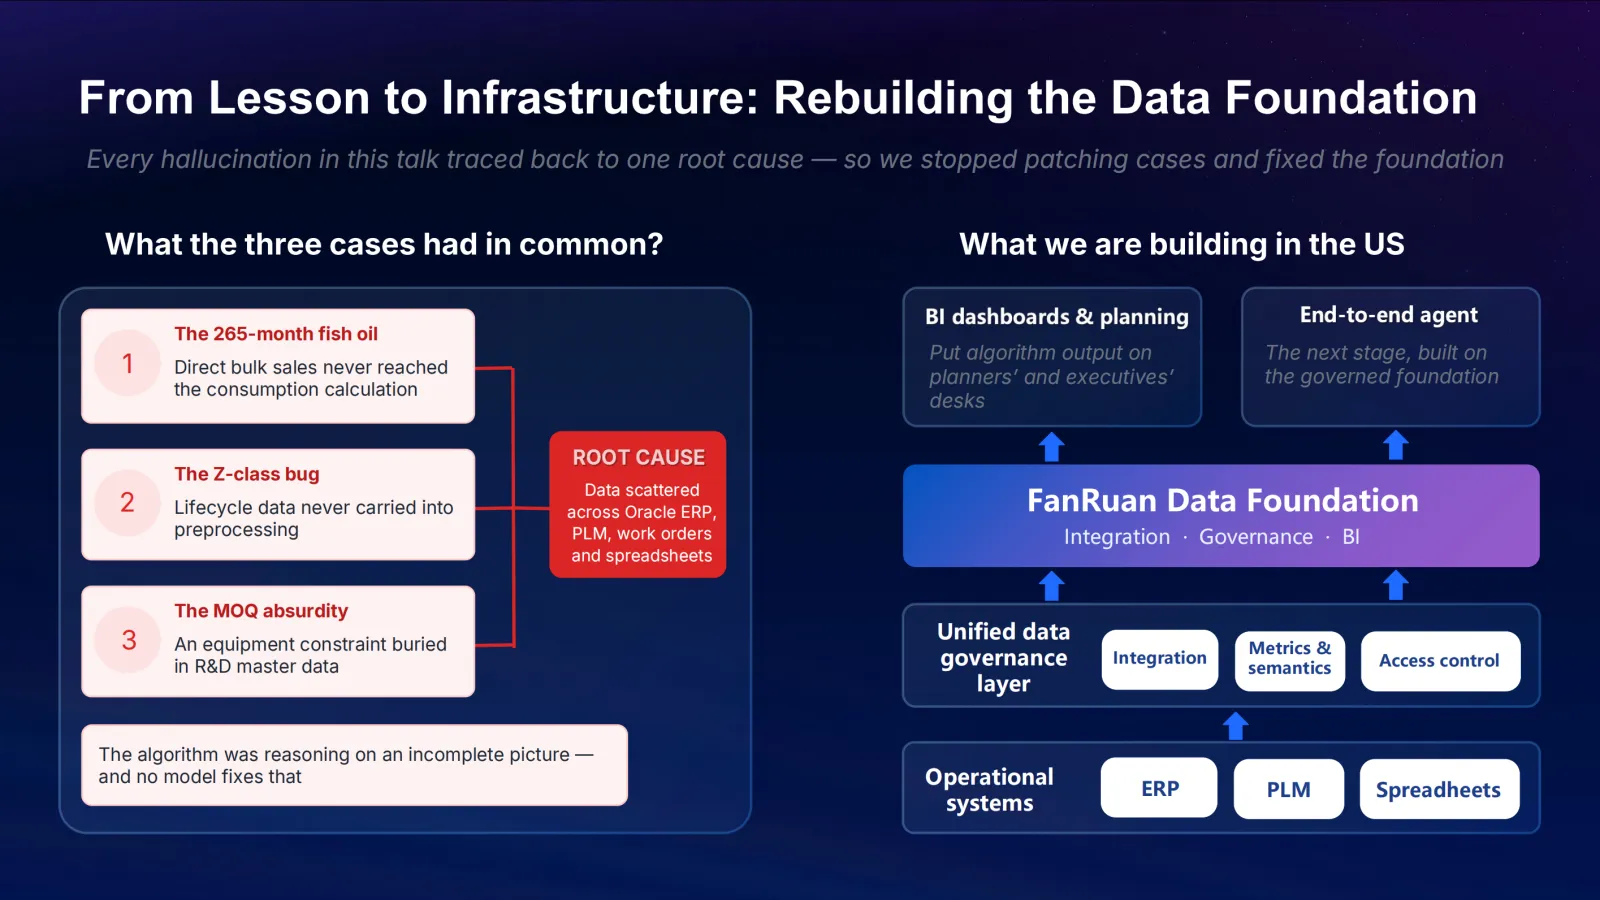
The 265.6-month fish oil anomaly:The V1 algorithm classified a core Omega-3 fish oil product as dead stock, reporting 265.6 months of inventory coverage—more than 22 years. The US COO challenged the result: “We ship this product every day. How can we have 22 years of inventory?” The algorithm had captured work-order consumption but missed direct bulk sales, calculating monthly consumption at just 37.9 kg instead of the actual 15,658 kg. Once the missing data was incorporated, inventory coverage dropped to a healthy 0.7 months.
Misclassified Z-class products:The XYZ classification engine treated months without recorded activity as zero-demand periods, artificially inflating the coefficient of variation (CV) for newer products. As a result, relatively stable products were classified as highly erratic Z-class items, and the system withheld safety stock, potentially increasing stockout risks. By starting each product’s demand history from its first shipment month, Aland Group increased the number of Y-class SKUs from 10 to 18, bringing the classifications closer to the planning team’s experience.
Excessive minimum order quantities (MOQs):R&D originally defined MOQ as a single production batch, assuming four to six production runs per year without adequately accounting for actual commercial demand. In extreme cases, this resulted in more than 20 months of inventory coverage. For nutraceutical products with shelf lives of two to three years, such quantities created significant risks of excess and obsolete inventory.
These cases showed that reliable supply chain optimization requires more than mathematical calculations. Algorithms must reflect actual consumption, product lifecycles, and manufacturing constraints to generate recommendations that business teams can trust.
Building an Intelligent Supply Chain Hub with FanRuan
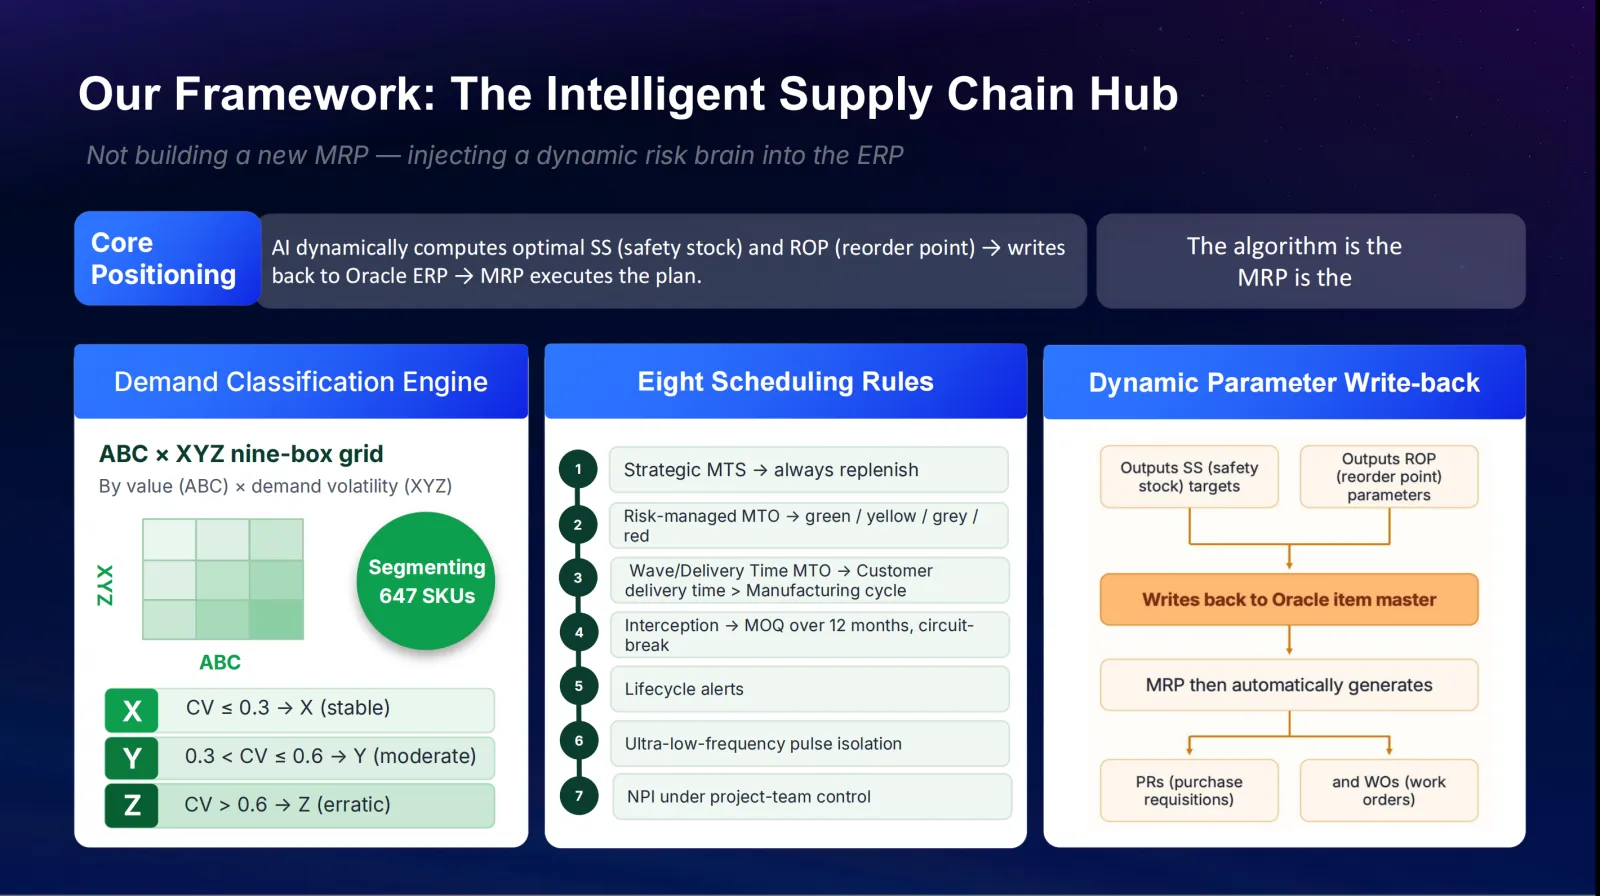
Rather than building a new material requirements planning (MRP) system or replacing Oracle ERP, Aland Group developed an Intelligent Supply Chain Hub that acts as an AI-powered “parameter brain” alongside its existing ERP.
The solution combines three core capabilities:
· Demand classification: An ABC × XYZ nine-box matrix segments 647 SKUs according to inventory value and demand volatility.
· Eight scheduling rules: Tailored rules support make-to-stock (MTS), risk-managed make-to-order (MTO), product lifecycle alerts, and new product introduction (NPI) controls.
· Dynamic parameter write-back: The algorithm calculates safety stock (SS) and reorder points (ROP), writes the parameters back to Oracle’s item master, and enables the standard MRP system to generate purchase requisitions and work orders.
A key breakthrough was the development of a “Dual-Signal Recombination” method, bridging the gap between the planning team’s preference for finished-goods sales data and the manufacturing team’s reliance on work-order data.
Actual finished-goods shipment records are translated through the bill of materials (BOM) into monthly bulk-material consumption, establishing a demand baseline that reflects market activity. Manufacturing constraints—including packaging MOQs, supplier lead-time variability, and ABC-based capital constraints—then refine the parameters to reflect operational realities.
This approach connects market demand with the physical limitations of production, helping the algorithm generate recommendations that are both commercially relevant and operationally feasible.
To address fragmented data across Oracle, product lifecycle management (PLM) systems, work orders, and spreadsheets, Aland Group is also building a unified data governance layer on the FanRuan Data Foundation. By integrating data integration, governance, and business intelligence (BI) in one platform, the initiative aims to establish a more complete and consistent foundation for supply chain decision-making. FanRuan’s BI capabilities also bring algorithmic outputs, including MOQ alerts and inventory coverage metrics, directly to planners’ dashboards and executive screens.
Driving Business Value: Making Hidden Risks Visible
Moving from V1 to V2 transformed Aland Group’s supply chain analysis, improving its ability to identify inventory imbalances and previously overlooked risks.
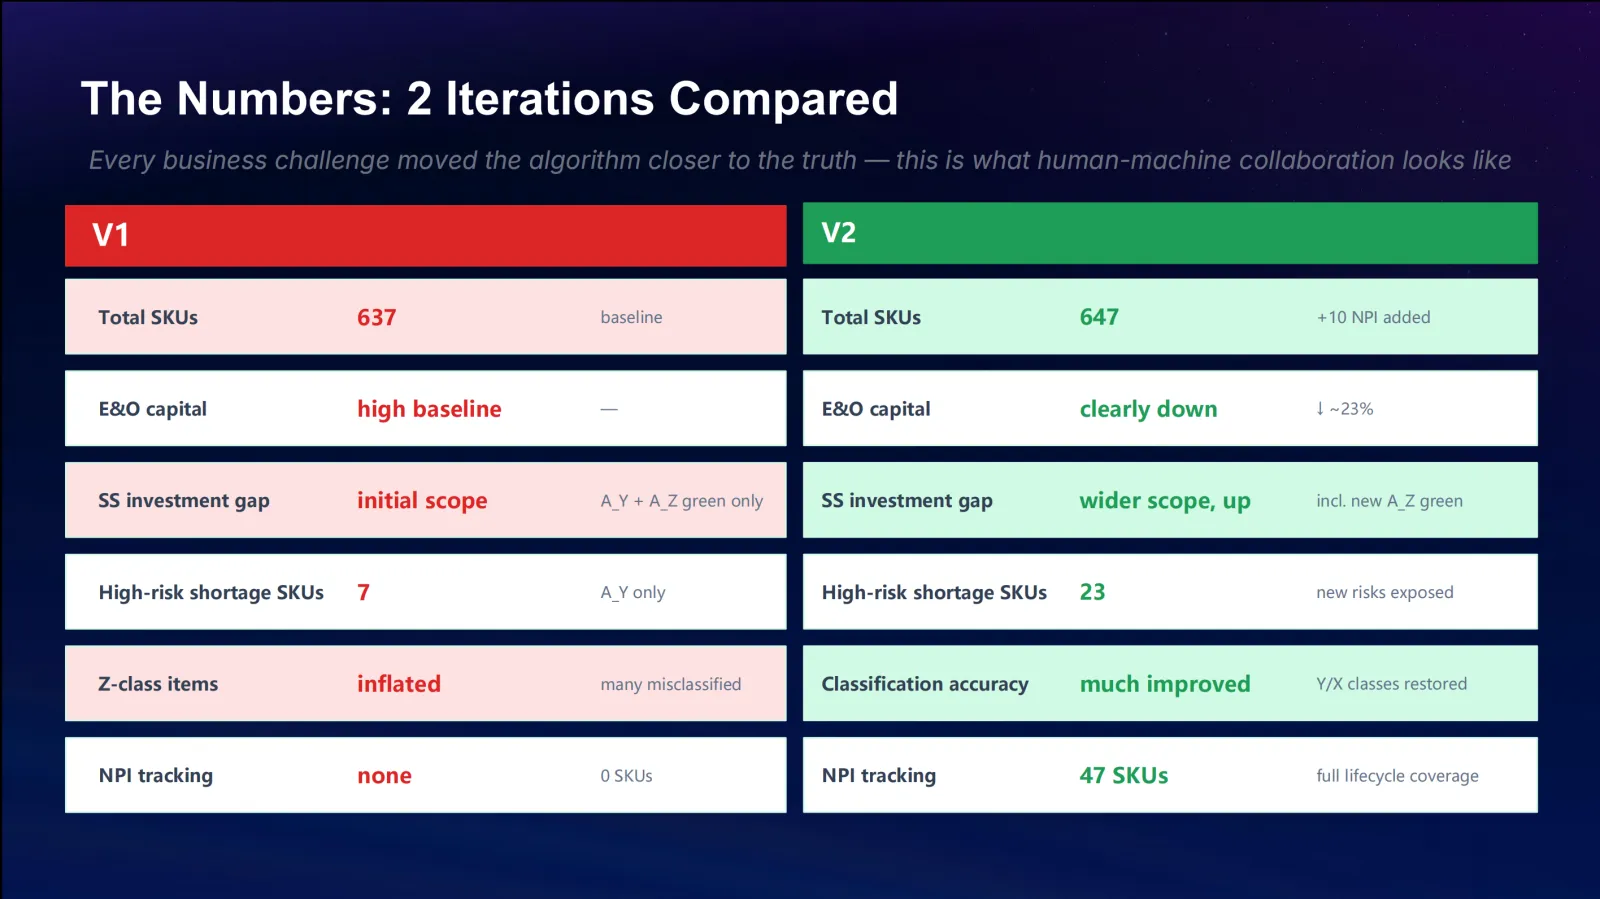
Approximately 23% reduction in E&O inventory capital:Excess and obsolete inventory capital decreased by approximately 23%, helping reduce capital tied up in slow-moving and obsolete stock.
Expanded SKU coverage.:The number of SKUs analyzed increased from 637 to 647, bringing 10 previously unmonitored new product introductions into the analysis.
Greater visibility into stockout risks:The number of SKUs identified as high risk for shortages increased from 7 to 23. As Jason Sheng explains:“We did not create a new risk. Those 23 items were always at risk. Version 1 could only see 7 of them because the data was incomplete. Making the invisible visible is the value of the upgrade.”
Beyond the numerical improvements, the project helped rebuild trust between the algorithm and the planning team. Jason Sheng reflects:“The most valuable outcome was not purely statistical. It was that the classification finally matched what the planner felt intuitively. Once the algorithm agreed with experience, the team moved from ‘we don't dare use this’ to ‘we can use this.’”
The lesson is clear: algorithms create business value when their recommendations reflect real operating conditions and reach the people responsible for acting on them.
Future Roadmap: From a Parameter Brain to an Industry Agent
Aland Group’s digital supply chain journey follows three stages.
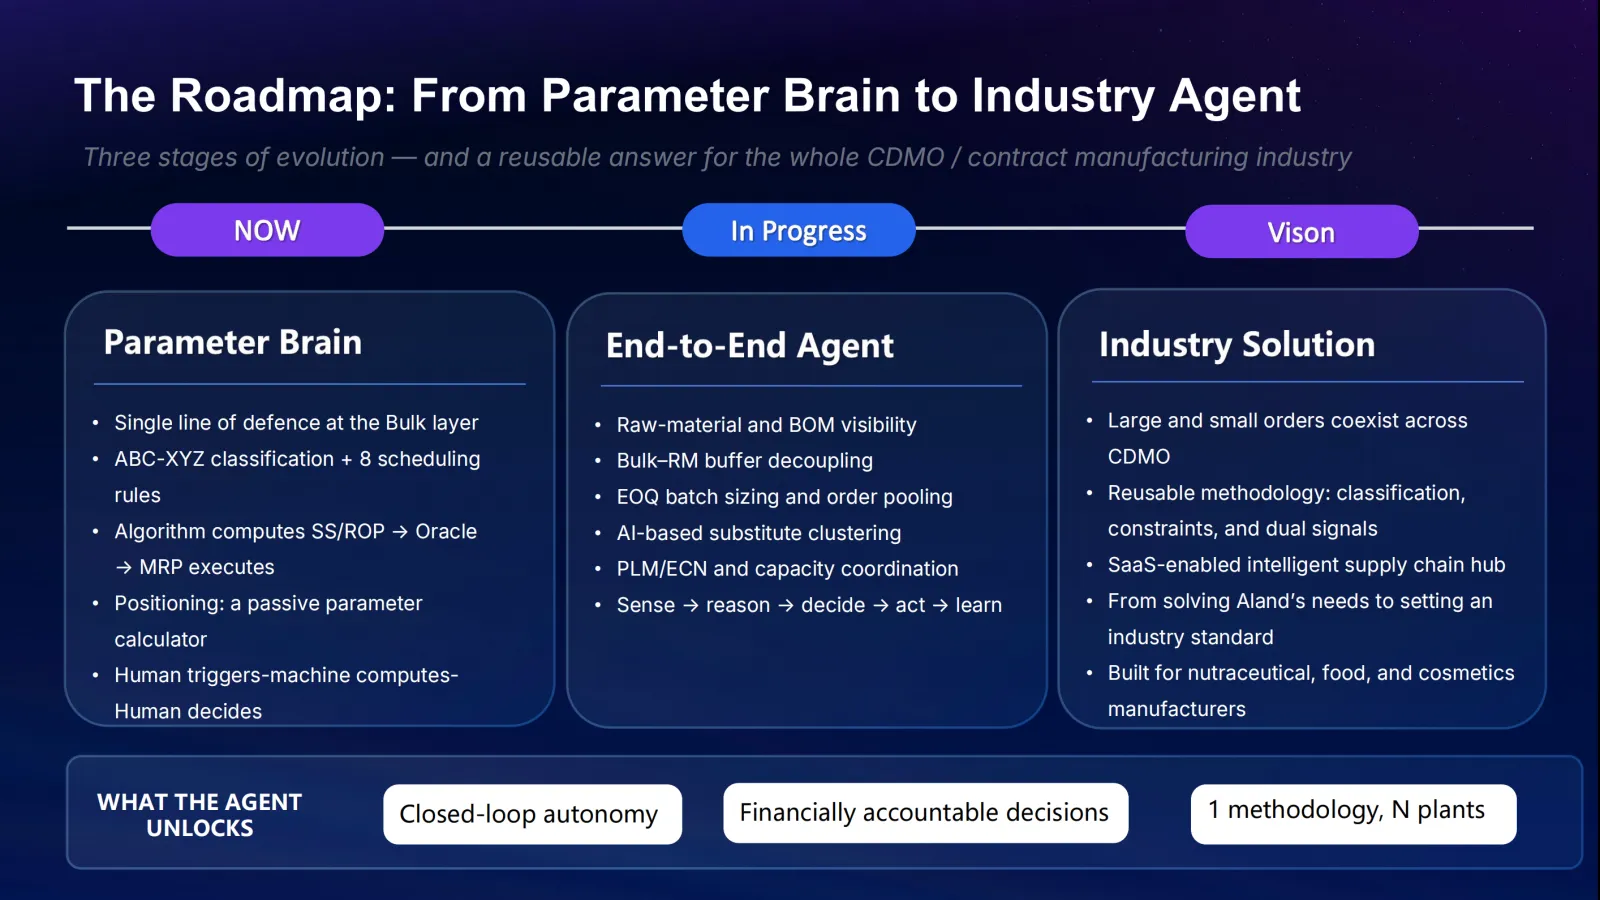
Parameter Brain — Current Stage:The existing system calculates optimized parameters in response to human input, while business teams retain responsibility for final decisions.
End-to-End Agent — Next Stage:The company plans to extend optimization into raw-material inventory management, decouple inventory buffers, incorporate economic order quantities, and use natural language processing (NLP) to identify and cluster substitute materials.
Industry Solution — Long-Term Vision:Aland Group ultimately envisions a SaaS-enabled intelligent supply chain hub tailored to the structural challenges of CDMO manufacturing, where large and small customer orders must coexist.
Reflecting on the journey, Jason Sheng offers a guiding principle for manufacturing digital leaders:“The highest form of an AI tool is not making the decision for you, it is making visible a cost you could not see before. Mathematics is how we understand the supply chain. Physics is how the supply chain actually runs. But business is the boundary we can never forget.”