For operations directors, big data analytics in fleet management is no longer about collecting more telematics feeds or adding another reporting layer. It is about using trusted data to improve uptime, lower cost per mile, reduce safety risk, and protect service levels across vehicles, drivers, routes, and maintenance operations.
The challenge is familiar: fleet data exists in many places, but decisions are still delayed. Telematics systems show location and events, fuel platforms show spend, maintenance systems show work orders, dispatch tools show route execution, and driver logs show compliance. Without a unified KPI framework, teams spend too much time reconciling numbers and not enough time acting on them.
With FineBI + Dora, business users can ask for analysis in chat, generate chart-based answers or dashboard-style analysis views from trusted BI assets, and receive scheduled summaries before the next meeting. That means fleet leaders do not have to choose between dashboard governance and AI convenience. They can use governed BI as the foundation and add an enterprise Data Agent that helps users ask, analyze, summarize, alert, and follow up faster.
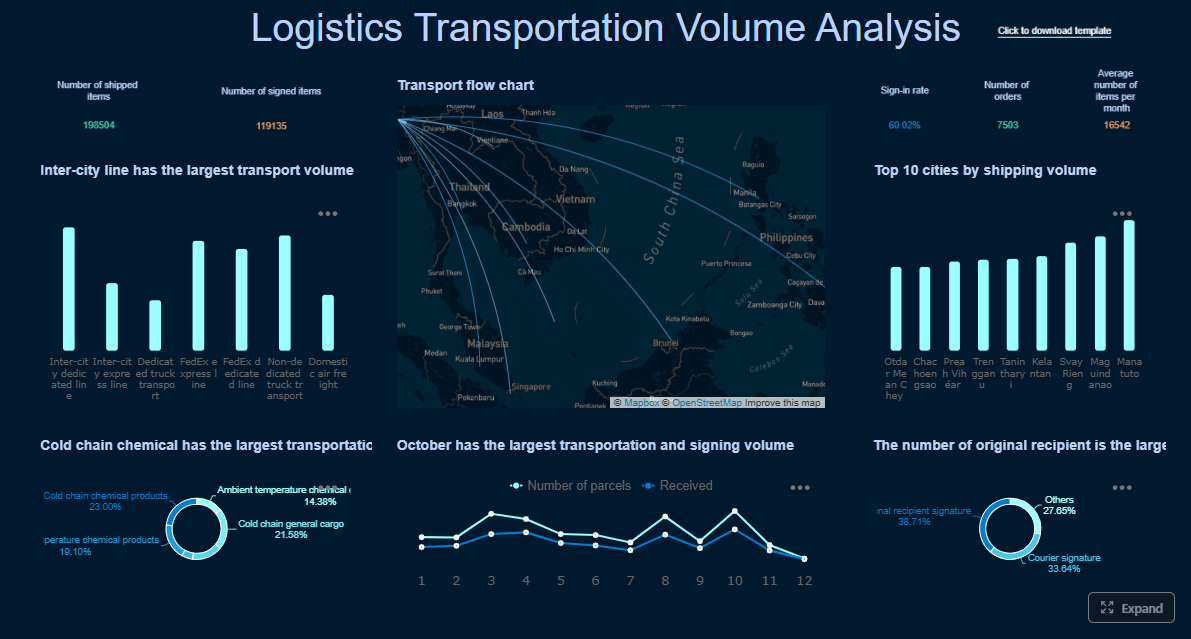 Click To Try The Dashboard
All dashboards in this article are built with FineBI
What big data analytics in fleet management means for operations directors
Big data analytics in fleet management means turning high-volume operational data into repeatable, decision-ready actions. For operations directors, the goal is not simply visibility. The goal is control: control over asset utilization, fuel cost, maintenance timing, driver risk, and service reliability.
Modern fleet operations generate data from many sources:
- Vehicle telematics
- GPS and routing platforms
- Fuel card transactions
- Maintenance and repair records
- Dispatch and TMS systems
- Driver logs and compliance systems
- Customer service records
Analytics connects these signals so leaders can understand cause and effect. A rise in fuel cost may be linked to idle time, route inefficiency, poor driving behavior, or aging vehicles. A drop in on-time delivery may stem from dwell time at customer sites, dispatch delays, or maintenance-related downtime. The value of analytics is in connecting those dots quickly and consistently.
Operations directors should also separate three different layers of data maturity:
-
Raw data
This includes location pings, engine hours, speeding events, fuel transactions, and service logs. Raw data is necessary, but by itself it is noisy and difficult to use in management reviews. -
Reporting dashboards
Dashboards organize operational data into usable views. This is where FineBI plays a foundational role by delivering trusted metrics, visual exploration, trend analysis, and semantic definitions that different teams can use consistently. -
Actionable insight
Insight is what happens when data is interpreted in business context. This is where Dora adds value as an enterprise Data Agent. Dora helps users retrieve trusted metrics through natural language, summarize patterns, flag exceptions, push alerts, and support follow-up actions without making users hunt through dashboards manually.
For operations directors, this distinction matters. Raw data creates activity. Dashboards create visibility. FineBI + Dora helps create operational execution.
The KPI categories that matter most in fleet operations
A practical fleet KPI framework should focus on the metrics that influence decisions. Most operations directors need a scorecard across four categories: utilization, cost, safety, and service.
Utilization and asset productivity
Utilization KPIs show whether fleet assets are being deployed effectively.
-
Vehicle utilization rate: Percentage of available vehicle time that is actively used for operations.
Business value: Helps identify underused vehicles, oversized fleet capacity, and scheduling inefficiencies.
AI use: Dora can retrieve utilization by region, vehicle class, or depot through chat, compare it against planned capacity, and include low-utilization assets in a scheduled fleet briefing. -
Idle time: Time vehicles spend running without productive movement.
Business value: Excessive idle time increases fuel cost, emissions, and engine wear.
AI use: Dora can surface high-idle routes or drivers, summarize patterns, and push exception alerts to supervisors for follow-up. -
Load factor: Percentage of vehicle carrying capacity actually used.
Business value: Reveals whether routes are optimized and whether shipments are being consolidated effectively.
AI use: Dora can answer questions such as which fleet segments consistently run below target load factor and provide chart-based comparisons by route or business unit. -
Route efficiency: Comparison of planned versus actual route distance, time, and stop sequence.
Business value: Highlights waste in dispatch planning and execution.
AI use: Dora can retrieve route efficiency metrics from FineBI assets, identify routes with recurring variance, and produce a dashboard-style analysis view for dispatch teams.
These metrics help operations directors identify two common problems: underused assets and poor scheduling discipline. A dashboard should make those patterns obvious. An AI assistant should make them easier to query, summarize, and assign for follow-up.
Cost and fuel performance
Fleet cost control depends on understanding where spending is rising and why.
-
Fuel spend per mile: Total fuel cost divided by distance traveled.
Business value: A core measure of route, vehicle, and driver efficiency.
AI use: Dora can retrieve fuel spend per mile by vehicle type, region, or period, compare trends, and include cost variance explanations in weekly operating summaries. -
Maintenance cost per vehicle: Total maintenance spend divided by the number of vehicles or by asset class.
Business value: Helps detect aging assets, maintenance backlog, or poorly performing vehicle models.
AI use: Dora can flag vehicles with above-threshold maintenance trends and support maintenance managers with anomaly-focused summaries. -
Total operating cost trend: Combined cost trend across fuel, labor, maintenance, tolls, insurance, and other operating expenses.
Business value: Gives leadership a broad view of cost pressure and profitability risk.
AI use: Dora can answer natural-language requests such as “show me the top drivers of operating cost increase this quarter” using governed FineBI metrics. -
Fixed vs variable cost by fleet segment: Comparison of ownership, lease, depreciation, labor, and usage-driven costs across vehicle groups.
Business value: Supports make-versus-buy, fleet sizing, and replacement planning.
AI use: Dora can generate chart-based answers for executive planning reviews and summarize where cost structure differs by segment.
These KPIs matter because cost trends are rarely isolated. Fuel cost increases may reflect route issues, safety behavior, maintenance conditions, or asset utilization. A good KPI framework should help leaders move from the symptom to the operational cause.
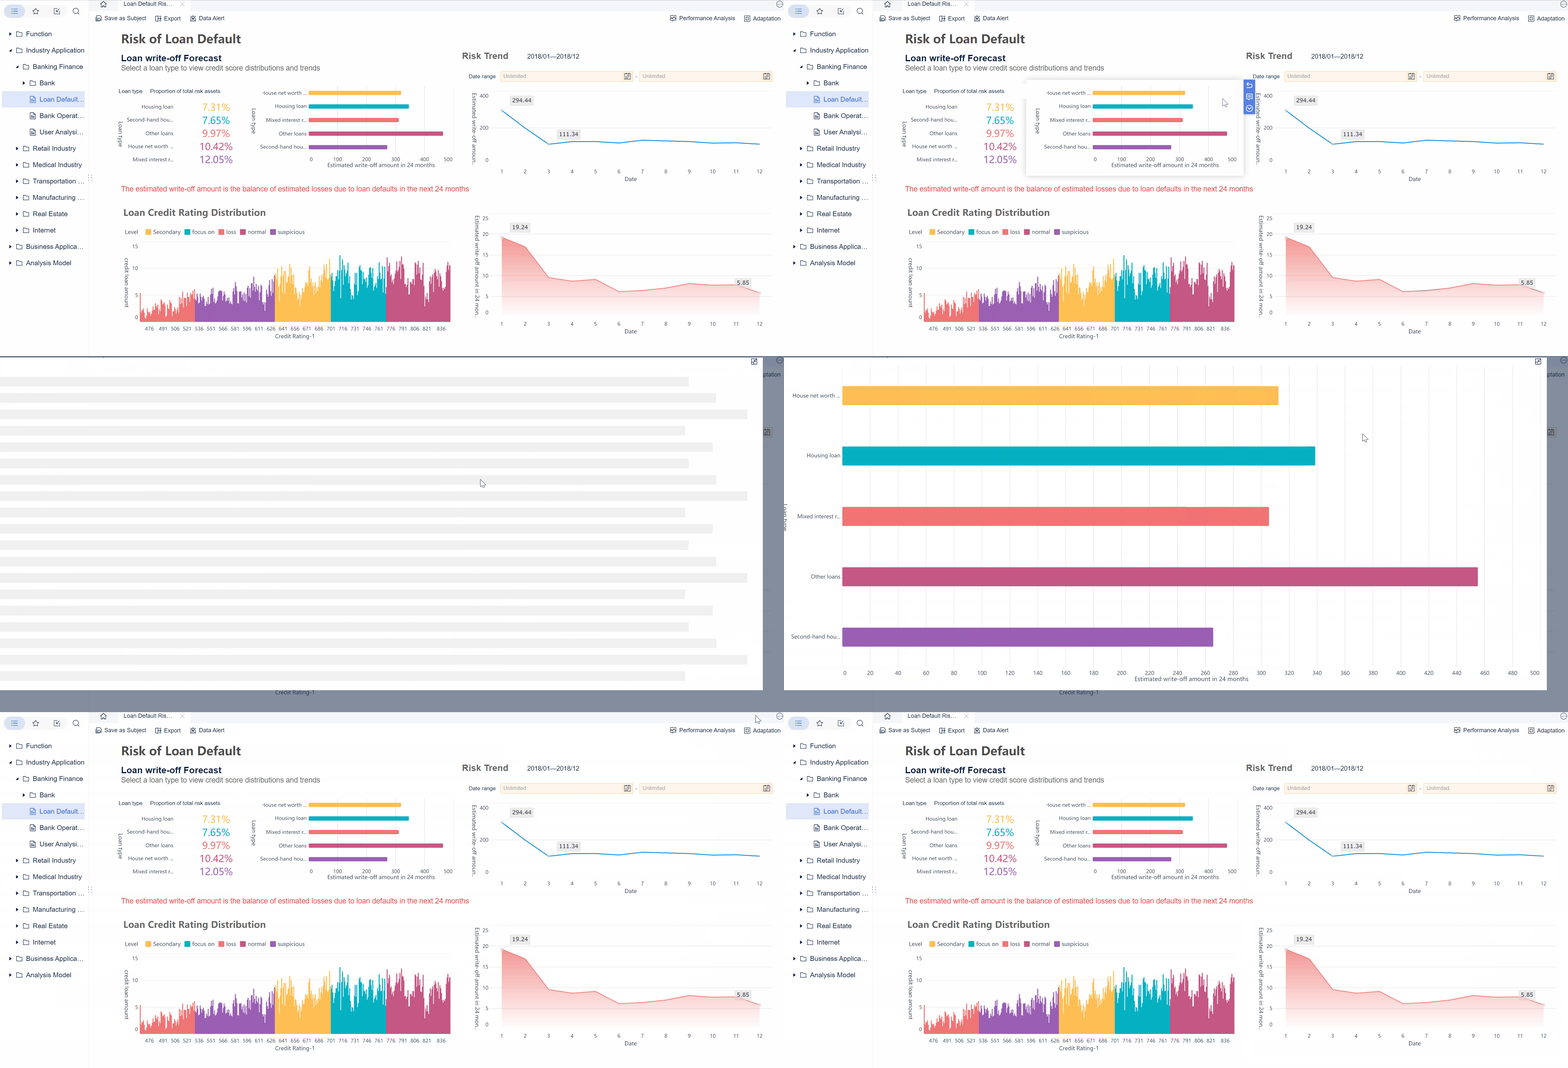
Safety and driver behavior
Safety analytics is essential for both risk reduction and operational continuity.
-
Harsh braking events: Frequency of aggressive braking incidents per distance or trip.
Business value: Often correlates with unsafe driving, increased wear, and higher accident risk.
AI use: Dora can retrieve driver or route-level event trends and help managers prioritize coaching targets. -
Speeding incidents: Number or duration of speed threshold violations.
Business value: Impacts safety, compliance, fuel efficiency, and brand risk.
AI use: Dora can monitor threshold breaches, summarize repeat offenders, and push timely alerts to safety managers. -
Fatigue indicators: Signals from duty hours, driving duration, or telematics-supported fatigue patterns.
Business value: Helps reduce accident risk and improve regulatory compliance.
AI use: Dora can support a Risk Alert Officer workflow by flagging risky patterns and notifying responsible managers before review meetings. -
Incident rate: Frequency of accidents, claims, or safety events relative to miles driven or trips completed.
Business value: A lagging measure of safety performance that helps validate whether coaching and policy changes are working.
AI use: Dora can combine incident trends with leading indicators like speeding and harsh braking to support preliminary attribution. -
Compliance metrics: Hours-of-service adherence, inspection completion, licensing status, and policy compliance.
Business value: Protects the business from legal, financial, and service disruptions.
AI use: Dora can include upcoming compliance risk items in periodic briefings and route them to the right owners.
Safety KPIs should not sit in a separate reporting silo. They should connect to operations, maintenance, and customer service outcomes. Unsafe behavior often increases cost and delays service at the same time.
Service reliability and customer outcomes
Fleet performance must ultimately support customer commitments.
-
On-time delivery rate: Percentage of deliveries or service calls completed within the promised window.
Business value: A direct indicator of service quality and revenue protection.
AI use: Dora can retrieve on-time performance by route, customer, or region and summarize deteriorating service patterns before customer review meetings. -
Missed service windows: Count or rate of jobs not completed within scheduled time.
Business value: Highlights operational failure points that affect service-level agreements.
AI use: Dora can push exception summaries to dispatch leaders when missed windows exceed defined thresholds. -
Dwell time: Time vehicles spend waiting at depots, loading sites, or customer locations.
Business value: Helps explain route inefficiency, asset underutilization, and service delays.
AI use: Dora can identify repeated dwell hotspots and provide chart-based comparisons to support corrective action. -
Customer complaint trend: Volume and type of service complaints over time.
Business value: Connects operational execution to customer experience.
AI use: Dora can merge complaint data with route or timing KPIs and provide a more complete service risk picture.
Service KPIs are where fleet analytics becomes highly strategic. They help operations directors show how fleet decisions affect retention, service-level performance, and revenue outcomes.
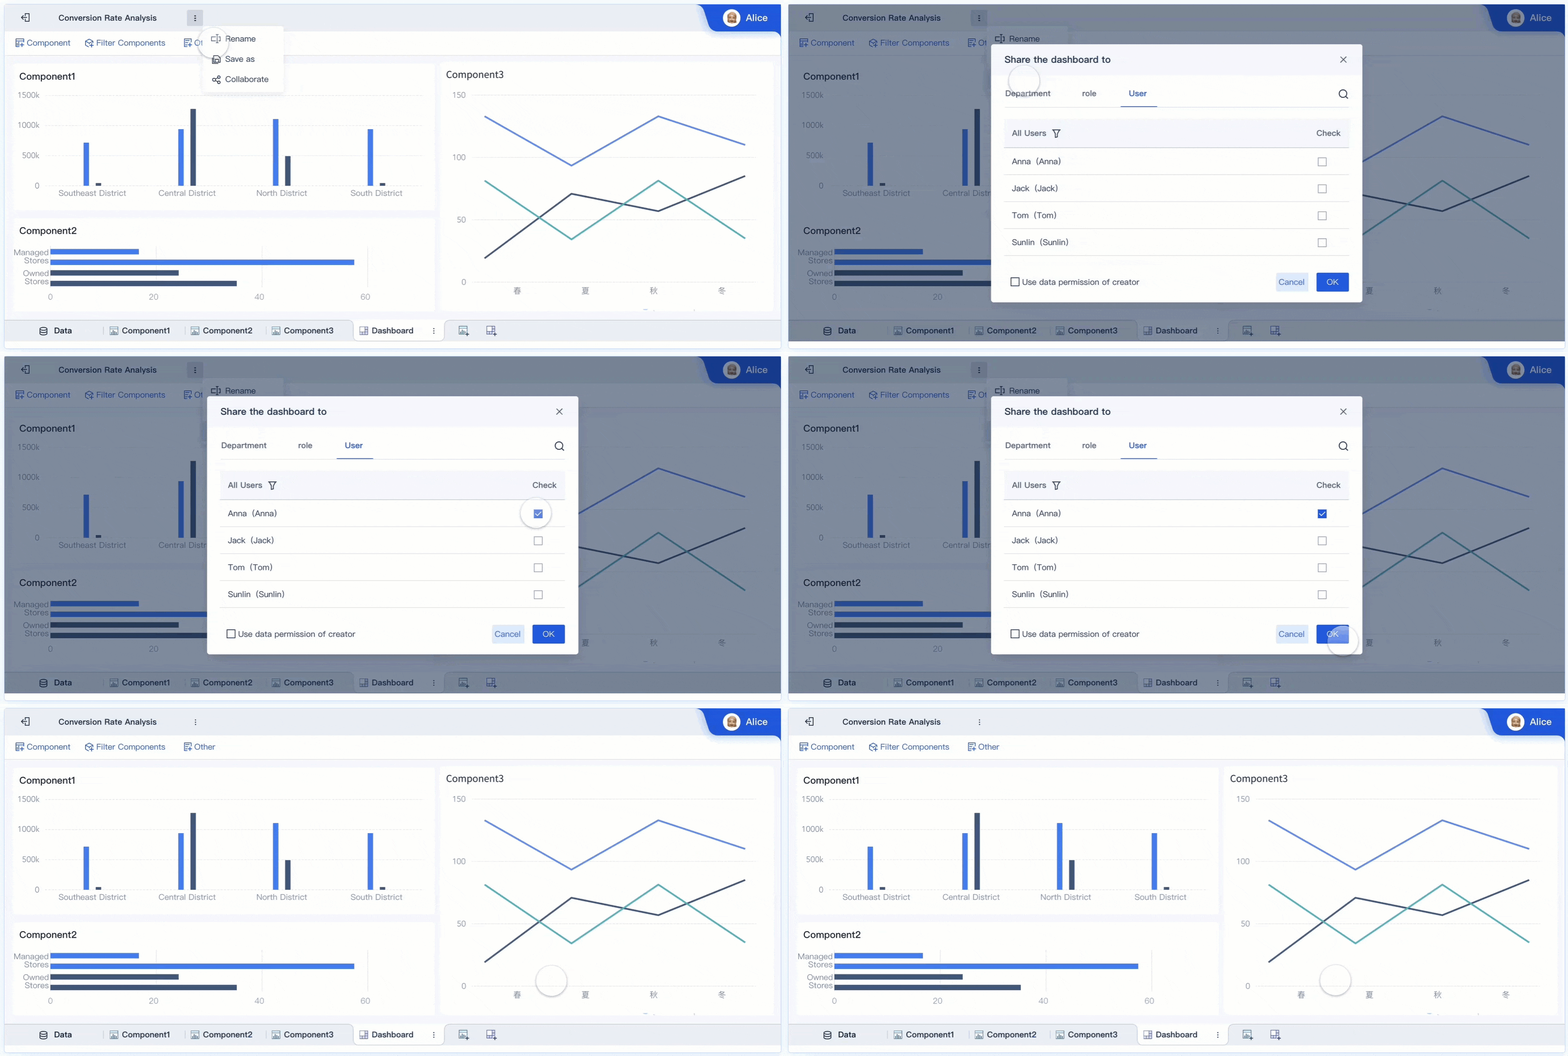
How to build a practical KPI framework
A fleet KPI framework should not start with available data fields. It should start with the decisions the business needs to make.
Start with business goals and operational constraints
The best KPI frameworks align directly with business priorities such as:
- Profitability improvement
- Asset uptime
- Safety performance
- Customer service consistency
- Regulatory compliance
For example, a distribution fleet focused on cost reduction may prioritize utilization, idle time, fuel spend per mile, and maintenance cost by asset class. A service fleet with strict appointment windows may emphasize on-time arrival, dwell time, repeat visits, and driver compliance.
The key principle is simple: do not measure data points that do not influence decisions. If a metric does not trigger an action, it does not belong in the core scorecard.
FineBI helps teams organize this logic into governed metric models, business-friendly subject areas, and role-based dashboards. That creates a trusted semantic foundation before AI workflows are added.
Choose leading and lagging indicators
Operations directors need both:
- Leading indicators: Signals that suggest future problems or opportunities, such as speeding, idle time, route variance, or delayed maintenance completion.
- Lagging indicators: Outcome measures such as cost per mile, incident rate, on-time delivery, or total downtime.
A small set of core KPIs should be supported by diagnostic metrics. For example:
- Core KPI: on-time delivery rate
- Diagnostic metrics: dwell time, route variance, dispatch delay, unplanned maintenance, driver hours issue
This structure helps dashboards stay focused while still allowing teams to drill into root causes. It also gives Dora a better governed context for follow-up analysis. Instead of answering with disconnected figures, Dora can use trusted KPI definitions and business relationships from FineBI to produce more relevant summaries.
Set thresholds, ownership, and review cadence
Metrics become operational only when they are linked to accountability.
Every KPI should have:
- A clear owner
- A target or acceptable range
- A review cadence
- A defined response when thresholds are breached
For example:
- Idle time over target for two consecutive weeks triggers route review by dispatch
- Maintenance backlog above threshold triggers workshop scheduling review
- Speeding incidents above threshold trigger driver coaching workflow
- On-time delivery decline in a region triggers service recovery review
This is also where Dora becomes especially useful. A governed AI workflow can monitor exceptions, summarize what changed, notify the right owners, and support follow-up discussions without replacing management judgment.
Turning fleet data into operational decisions
Analytics only matters if it changes what the operation does next.
Build a reliable data pipeline
A fleet KPI program depends on combining multiple enterprise data sources, including:
- Telematics platforms
- Fuel card data
- Maintenance management records
- Dispatch or transportation systems
- Driver logs and compliance data
- Service records or customer feedback data
The priority is not just integration. It is definition consistency. If mileage, trip completion, downtime, or fuel categories are defined differently across systems, dashboards will generate debate instead of action.
FineBI helps by creating a BI foundation with governed metrics, reusable semantic assets, and visual analysis models. IT and data teams can standardize formulas, filters, hierarchies, and access permissions so users do not work from conflicting numbers.
Data quality also matters for AI. Dora performs best when the underlying KPI model is trusted. A Data Agent should operate on governed business definitions, permission rules, and validated metrics rather than raw, ambiguous fields.
Use dashboards for visibility, not overload
A common mistake in big data analytics in fleet management is overloading dashboards with every available signal. More charts do not create better management decisions.
Role-based design works better:
- Executives: high-level scorecard, trend summary, risk highlights
- Fleet managers: utilization, downtime, fuel efficiency, safety patterns
- Dispatch teams: route variance, dwell time, missed windows, vehicle availability
- Maintenance teams: preventive compliance, repair backlog, repeat failures, asset health signals
Dashboards should emphasize:
- Trends over time
- Variance against target
- Exception views
- Breakdown by region, route, vehicle class, or driver segment
- Decision-ready summaries
FineBI is the right place to build these trusted views. Dora then extends access by helping users retrieve the right dashboard or metric via chat, ask follow-up questions, and receive scheduled summaries without manually navigating multiple reports.
Create closed-loop improvement processes
A KPI framework is complete only when insight leads to action and results are reviewed.
Examples of closed-loop action include:
- Adjusting route plans after repeated route efficiency issues
- Scheduling preventive maintenance when repair trends worsen
- Launching targeted driver coaching after repeated safety exceptions
- Rebalancing fleet assets when utilization is uneven across depots
- Updating customer service escalation plans when missed windows rise
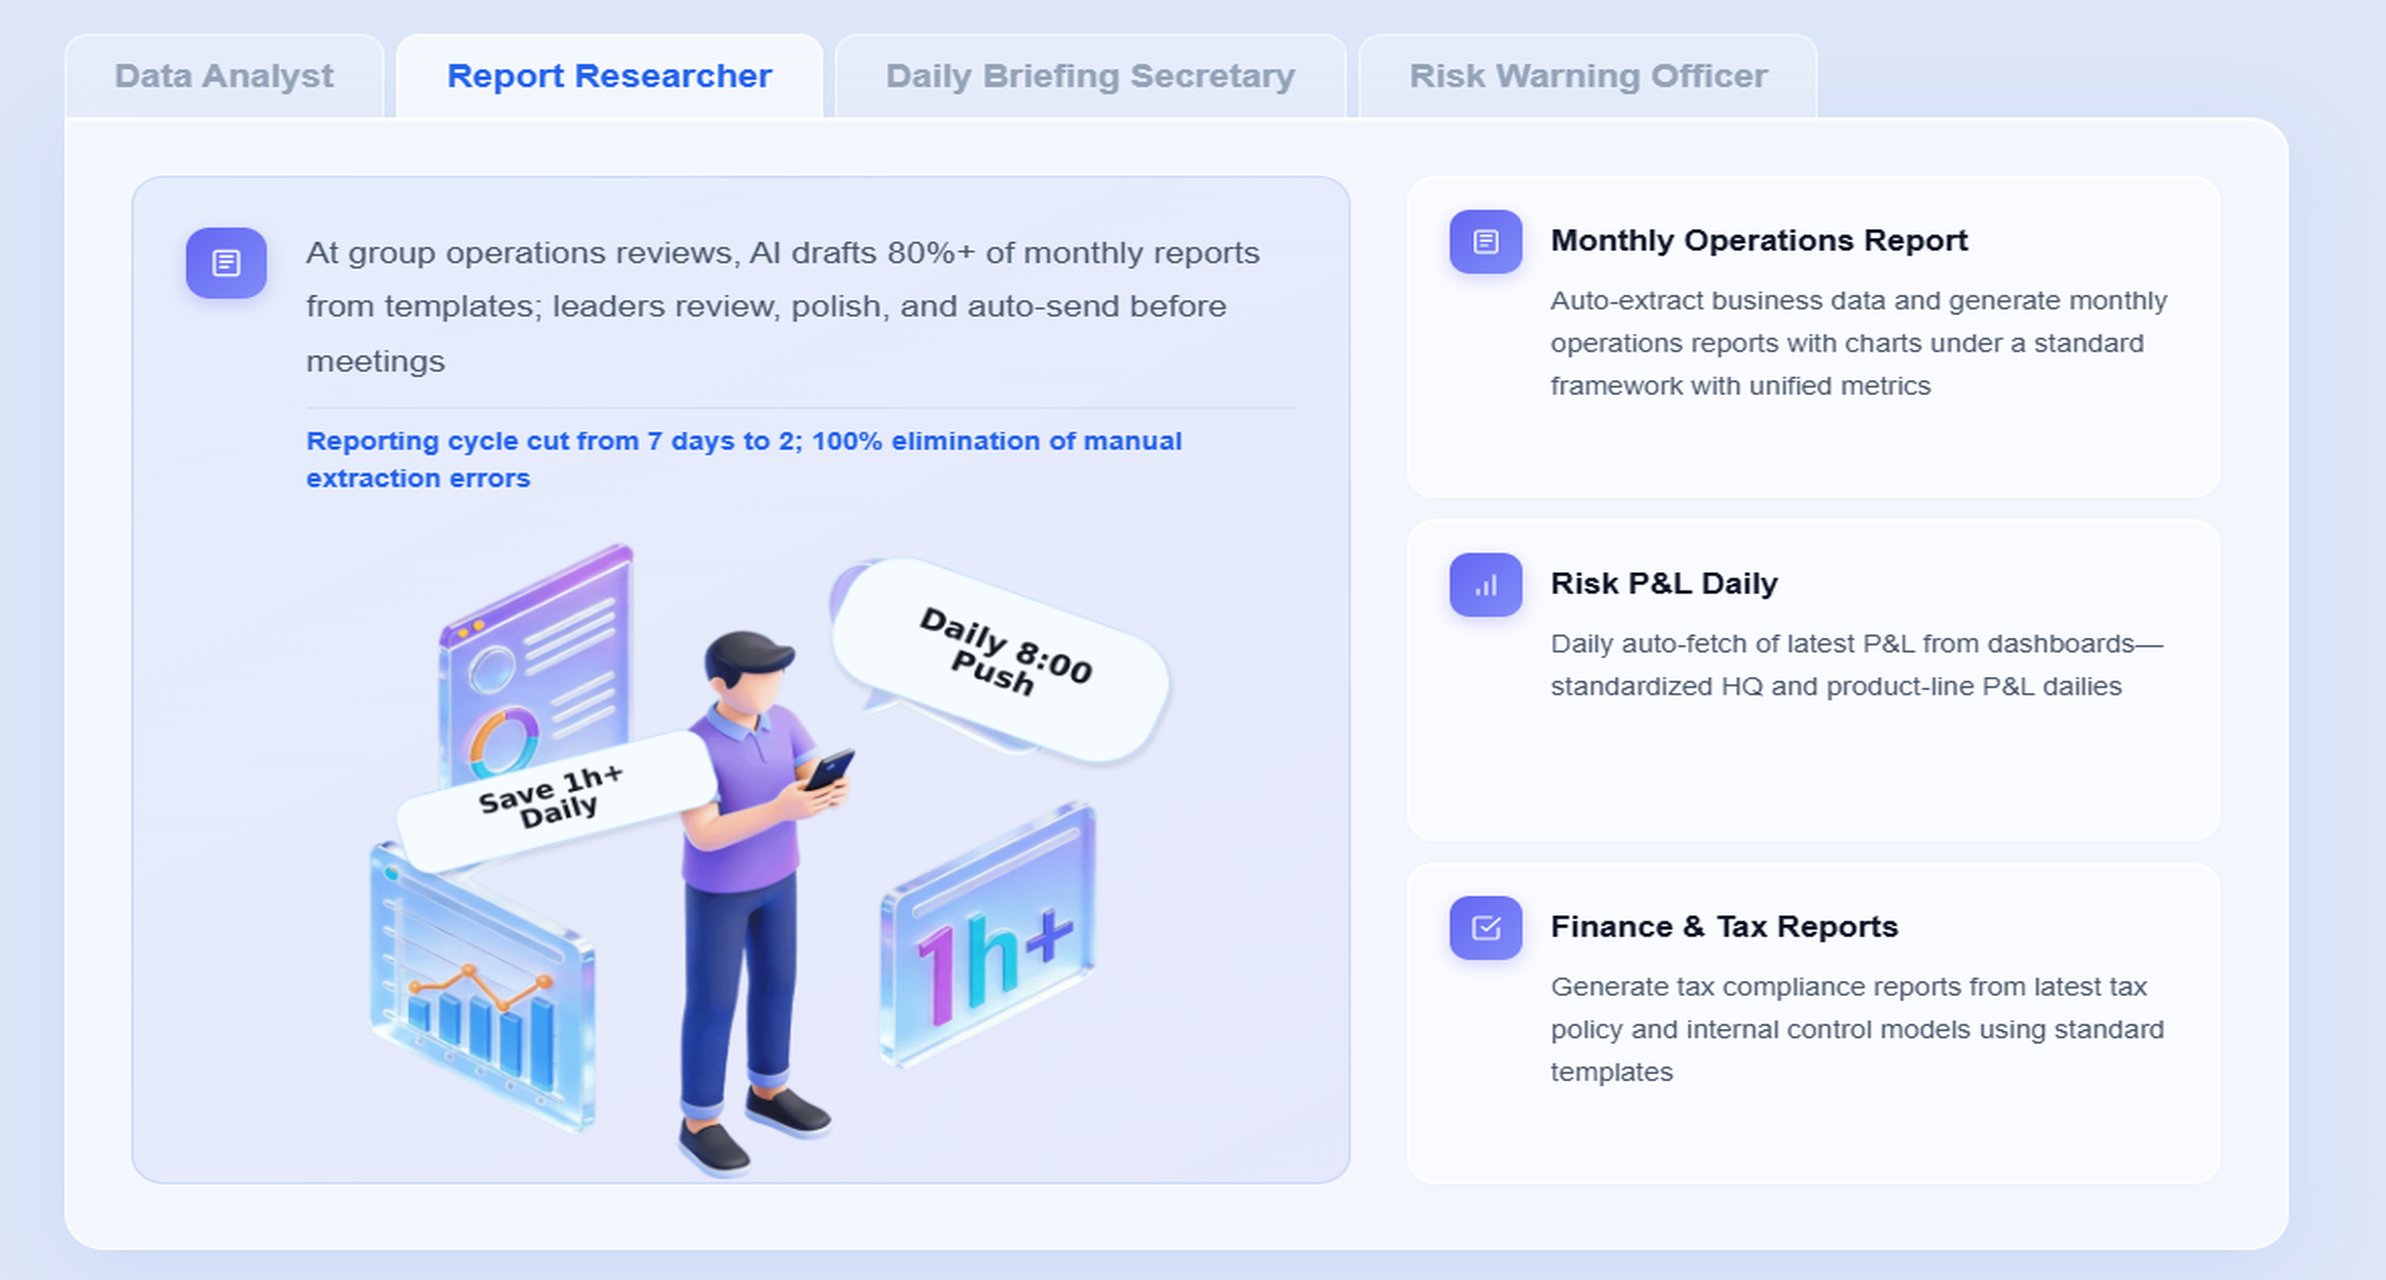
Dora strengthens this loop because it can support recurring data work that teams often skip when they are busy. As a Daily Briefing Secretary, Dora can push periodic KPI summaries before operations meetings. As a Risk Alert Officer, Dora can monitor threshold breaches and notify responsible owners. As a Data Analyst digital employee, Dora can answer natural-language questions using trusted FineBI assets and provide chart-based answers for quick decision support.
How an AI Data Agent Handles This Scenario
For fleet operations, the most relevant Dora digital employees are usually:
- Data Analyst digital employee for natural-language data query, dashboard retrieval, and follow-up analysis
- Daily Briefing Secretary for scheduled KPI summaries before operating reviews
- Risk Alert Officer for threshold monitoring, anomaly detection, and owner notification
A scenario-specific example for an operations director might be:
“Show me this week’s fleet performance by region, including vehicle utilization, fuel cost per mile, on-time delivery, and the top safety and maintenance risks.”
Here is how a governed AI workflow can work in practice:
-
Retrieve trusted FineBI dashboard or analysis-subject data
Dora accesses the approved fleet KPI assets built in FineBI, such as utilization models, fuel cost dashboards, maintenance trend reports, and service reliability scorecards. -
Understand KPI definitions, filters, business terms, and semantic rules
Dora uses the governed semantic layer so terms like “on-time delivery,” “idle time,” “preventive compliance,” or “fuel spend per mile” match enterprise definitions instead of ad hoc interpretation. -
Generate a chart-based answer or dashboard-style analysis view through chat
The user asks a question in natural language. Dora returns the requested metrics, visual breakdowns, trend summaries, and relevant comparisons by region, vehicle type, or period. -
Detect abnormal changes or threshold breaches
If fuel cost per mile spikes, on-time delivery falls below target, or speeding incidents rise above threshold, Dora can identify these exceptions based on configured business rules. -
Push insights, alerts, or suggested follow-up to responsible users
Dora can support a governed alert flow by sending periodic summaries or exception notifications to fleet managers, dispatch leads, safety managers, or maintenance owners. -
Produce follow-up summaries for meetings or management review
Before weekly operations meetings, Dora can assemble a concise briefing covering KPI changes, major risks, and items requiring attention.
This is where the value of Agentic BI becomes concrete. FineBI provides the trusted dashboard, metric, and semantic foundation. Dora turns that foundation into an enterprise AI assistant that helps teams ask, analyze, generate, push, alert, and follow up.
For operations directors, that means less time searching across dashboards and more time managing outcomes.
For IT teams, it means a shift in role. Instead of manually building every one-off report request, IT can focus on data connections, semantic modeling, KPI governance, permission control, and reusable AI Skills that make workflows more controllable and auditable.
For business users, it means lower friction. They can get timely metrics, chart-based answers, and scheduled summaries without waiting for analysts to prepare every review pack.
Dora also offers stronger enterprise fit than raw prompt-only agents because it is designed for governed AI workflows. It can use trusted BI assets, business permissions, semantic rules, and Skills-based execution to reduce token waste, improve response speed, and increase workflow stability compared with generic prompt-driven approaches. That makes it better suited for repeatable fleet scenarios such as weekly cost briefings, risk monitoring, and service exception follow-up.
Common implementation challenges and how to avoid them
Fleet analytics programs often fail for process reasons, not technology reasons.
Data silos and inconsistent definitions
Different systems often define mileage, downtime, route completion, or service delay in different ways. This creates conflicting reports and reduces trust.
To avoid this:
- Standardize KPI formulas centrally
- Align business definitions across operations, finance, maintenance, and safety
- Build reusable semantic assets inside FineBI
- Apply consistent reporting rules and filters across dashboards and AI workflows
When Dora uses trusted FineBI assets, users get more consistent answers because the AI assistant is working from governed definitions rather than disconnected raw fields.
Too many metrics and not enough action
Fleet teams often track every signal available from telematics and dispatch systems. That creates dashboard clutter and weakens accountability.
To avoid this:
- Prioritize a concise scorecard of core KPIs
- Tie each KPI to a specific operational decision
- Support each core KPI with a limited set of diagnostic metrics
- Use Dora to summarize what changed and what requires attention instead of pushing large, unfocused data dumps
The goal is not to see everything. The goal is to act on the few things that matter most.
Change management and adoption barriers
Frontline teams may see analytics as surveillance or extra reporting work. Managers may continue to rely on intuition if dashboards feel disconnected from daily operations.
To avoid this:
- Explain how measurement supports better scheduling, safety, service, and asset planning
- Make KPI ownership and review expectations explicit
- Build transparency around formulas and thresholds
- Train users on both dashboards and AI-assisted workflows
- Start with practical recurring use cases that save time, such as weekly briefings or exception alerts
Adoption improves when users see that analytics reduces friction instead of creating more administrative effort.
A 90-day roadmap for launching your KPI program
A fast, practical rollout is often better than a long, overly complex transformation plan.
Days 1 to 30: Assess current data and reporting gaps
Start by auditing:
- Available source systems
- Existing reports and dashboards
- KPI definitions already in use
- Decision bottlenecks in operations reviews
- Areas where teams still rely on spreadsheets or manual data consolidation
At this stage, select a preliminary shortlist of KPIs based on business priorities. For most operations directors, this usually includes:
- Vehicle utilization
- Idle time
- Fuel spend per mile
- Maintenance cost per vehicle
- On-time delivery
- Incident or safety event rate
This is also the right time to identify where FineBI should become the trusted dashboard and semantic layer foundation.
Days 31 to 60: Pilot dashboards and validate metrics
Next, pilot the KPI framework with a subset of vehicles, routes, depots, or regions.
Key tasks include:
- Testing metric definitions with operational stakeholders
- Validating source system accuracy
- Reviewing whether thresholds are realistic
- Designing role-based dashboard views in FineBI
- Confirming drill-down paths for diagnostics
This phase is also ideal for introducing Dora in a controlled way. Start with one or two repeatable AI workflows, such as:
- A Daily Briefing Secretary that sends weekly fleet KPI summaries
- A Data Analyst digital employee that answers common management questions through chat
- A Risk Alert Officer that flags threshold breaches in safety or service KPIs
Starting with high-value recurring workflows creates better landing capability than trying to automate every use case at once.
Days 61 to 90: Roll out governance and optimization routines
Once pilot metrics are trusted, move into operational rollout.
Key actions:
- Assign KPI owners
- Finalize review meeting cadence
- Document alert thresholds and escalation rules
- Define response playbooks for recurring exceptions
- Preserve FineBI permission governance so AI outputs respect access boundaries
- Introduce human review for AI-generated summaries and expand Dora Skills gradually
By day 90, the organization should have more than dashboards. It should have a working management routine supported by governed analytics and AI-assisted execution.

Actionable best practices
Below are practical steps that make big data analytics in fleet management more likely to succeed in a real enterprise environment.
1. Standardize KPI definitions, synonyms, filters, and metric ownership
Fleet teams often use different terms for similar measures. Align definitions for mileage, downtime, service window, utilization, and fuel efficiency. FineBI should hold the trusted semantic layer so both dashboards and Dora use the same business language.
2. Build the semantic layer inside the BI workflow
Do not wait until the AI phase to define business meaning. FineBI should organize trusted metrics, hierarchies, dimensions, and permission rules first. Dora works best when it can retrieve governed assets rather than interpret raw tables with inconsistent naming.
3. Treat data quality as part of the AI implementation
An AI assistant is only as useful as the data and KPI governance behind it. Validate telematics feeds, maintenance records, fuel data, and dispatch status logic. If source data is weak, AI-generated summaries will still require heavy correction.
4. Start with high-value recurring workflows instead of automating everything
The best first AI scenarios are repetitive and decision-relevant, such as weekly performance summaries, anomaly alerts, service risk reviews, and recurring cost briefings. These use cases create visible business value and are easier to govern.
5. Define alert thresholds, responsibility rules, and escalation paths
Dora should not just provide answers on request. It should support execution through governed AI workflows. Define what counts as an exception, who is notified, what summary is pushed, and what follow-up action is expected.
6. Preserve permission governance and expand human review gradually
AI outputs should respect the same access boundaries as FineBI dashboards. Use human review for AI-generated reports at the beginning, then expand trusted Skills and automation scope as governance matures.
FineBI + Dora Solution Pitch
Building this manually is complex. FineBI helps teams build trusted dashboards, metrics, and semantic assets. Dora turns those assets into an AI assistant that can answer questions in chat, generate dashboard-style analysis views, push scheduled summaries, monitor anomalies, and follow up with responsible owners.
For fleet management, this combination is especially practical because operations teams already depend on recurring data work:
- Weekly operating reviews
- Fuel and cost variance analysis
- Route exception follow-up
- Maintenance risk monitoring
- Safety coaching prioritization
- Service performance briefings
FineBI provides the BI foundation for all of those scenarios. It supports dashboarding, self-service analytics, metric modeling, and governed business definitions. Dora adds the enterprise Data Agent layer on top so users can interact with those assets through natural language, scheduled summaries, alerting workflows, and auditable Skills-based execution.
This is important for real-world enterprise adoption. Many organizations already have data systems and some level of reporting maturity. FineBI strengthens the trusted BI layer. Dora can then turn that foundation into scenario-specific AI assistants or AI digital employees with better business landing capability than feature-only agent comparisons.
FineBI + Dora is not only a BI upgrade; it is a practical fourth-generation Agentic BI path. FineBI provides governed metrics and visual analysis. Dora provides the AI assistant layer for scenario execution, with more controlled Skills, lower token waste, faster execution paths, and more stable workflows than prompt-only agents.
For operations directors, the value is concrete: better KPI visibility, faster exception response, and less manual report coordination.
For IT teams, the value is also clear: fewer one-off requests and a stronger focus on reusable semantic assets, data quality, permission governance, and agent Skills.
For business users, the advantage is speed and accessibility: timely metrics, chart-based answers, and periodic briefings without searching through multiple dashboards.

Get Ready-to-Use Dashboard Templates in Fine Gallery
The strongest Dora pitch is scenario + product + service: FineBI provides the trusted BI foundation, Dora provides the AI digital employee, and implementation service connects data, governance, semantic setup, Skills, and rollout.
If your fleet organization wants to move beyond fragmented reports toward governed, decision-ready analytics with AI-assisted execution, FineBI + Dora offers a practical path.
FAQs
It is the use of data from telematics, fuel systems, maintenance records, dispatch tools, and driver logs to improve fleet decisions. The goal is to turn scattered operational data into clear actions that reduce cost, risk, and downtime.