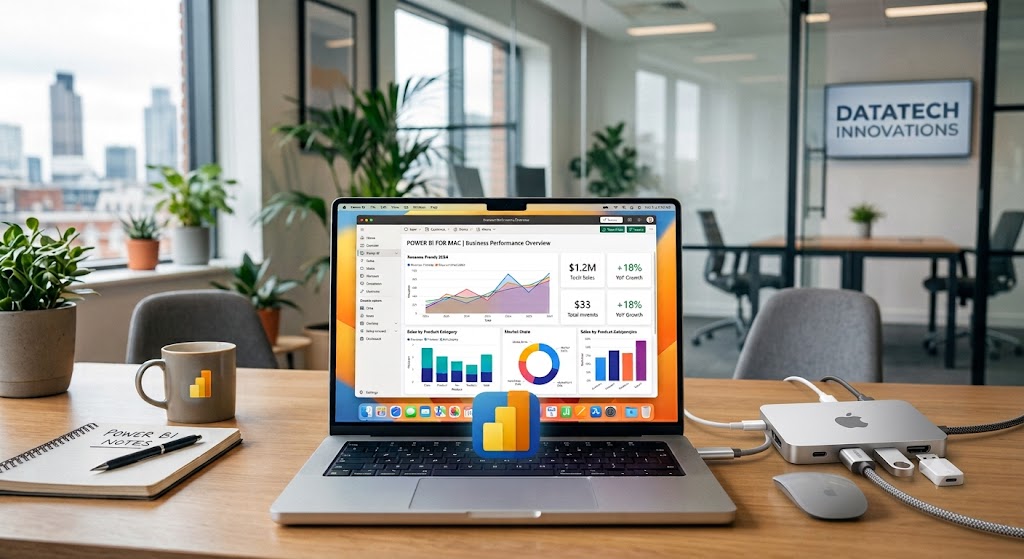
If your team uses Tableau, the real goal is not just to build attractive dashboards. It is to make analytics and reporting practical for everyday business decisions. Leaders need KPI visibility, analysts need room to investigate issues, and operational teams need timely updates they can act on.
A Tableau reporting tool helps organizations turn raw data into dashboards, recurring reports, and visual analysis. But in many enterprises, dashboards alone are no longer enough. Teams also want an AI assistant that can help them ask questions in chat, retrieve trusted metrics, generate chart-based answers or dashboard-style analysis views, and send scheduled summaries before the next meeting.
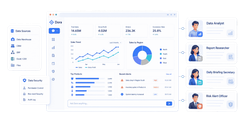
With FineBI + Dora, business users can ask for analysis in chat, generate chart-based answers or dashboard-style views from trusted BI assets, and receive scheduled summaries before the next meeting.
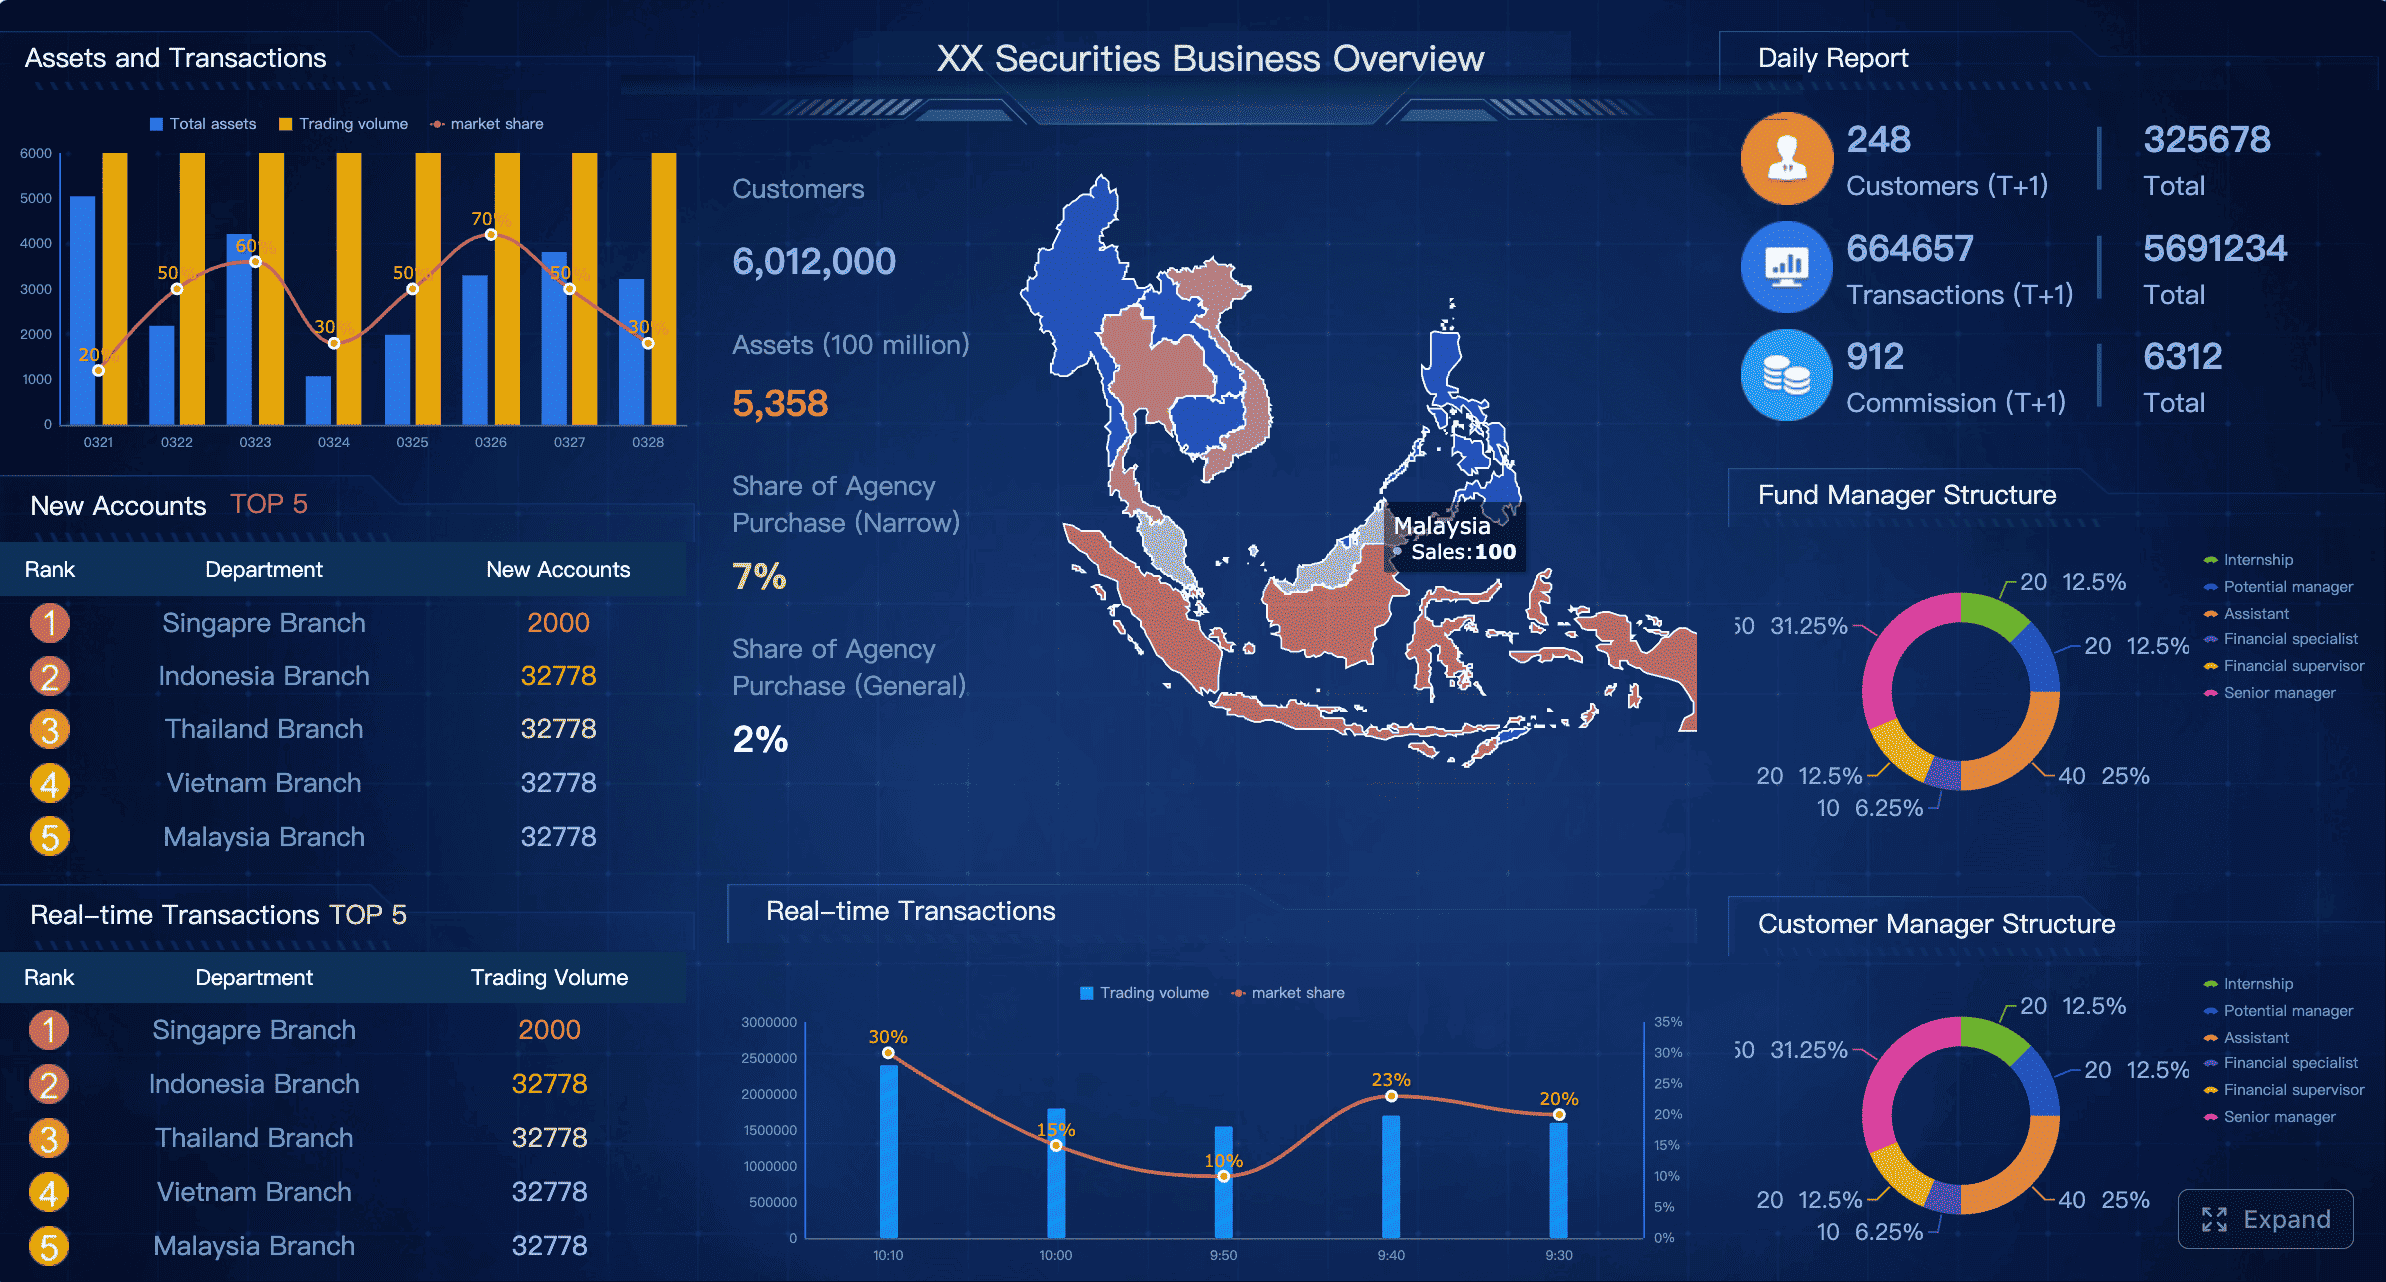
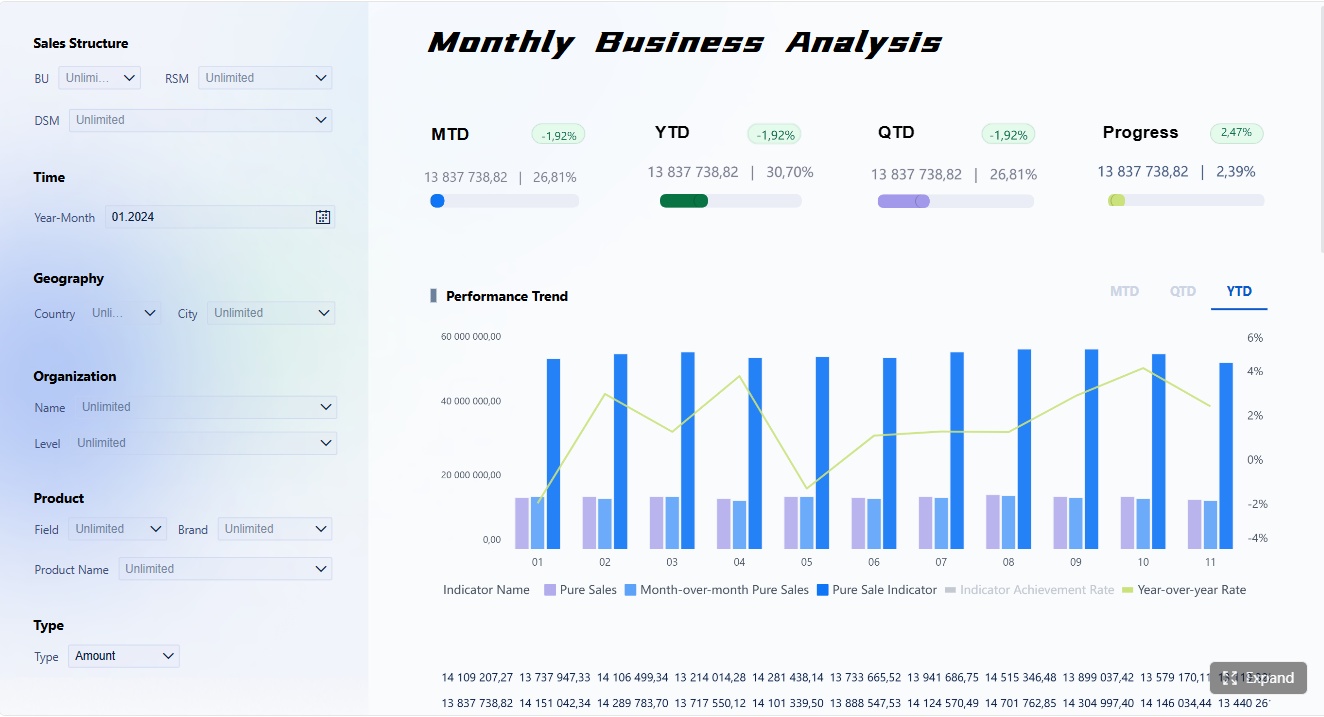 Explore more analytics and reporting templates for all industries.
What a Tableau Reporting Tool Does in Modern Business
A Tableau reporting tool is typically used to connect business data, organize it visually, and present it in dashboards or recurring reports. In plain language, it helps teams answer questions such as:
- How are sales performing this month?
- Which regions are behind target?
- Which campaigns generated pipeline?
- Where are operational delays increasing?
- Which KPIs need leadership attention this week?
In modern business, this work usually combines two related but different disciplines:
- Reporting shows what happened through structured KPI summaries, scheduled updates, and standard dashboards.
- Analytics helps explain why it happened through exploration, comparisons, segmentation, and trend review.
That distinction matters. If a COO opens a dashboard and sees order fulfillment falling, that is reporting. If an analyst drills into warehouse, product mix, and supplier delays to explain the drop, that is analytics.
A tool like Tableau is often used for both. It provides visualization and exploration features that support recurring monitoring as well as deeper investigation. Still, many teams hit a workflow gap after dashboards are published. Business users may know the question they want to ask, but not which dashboard to open, how to filter it, or how to summarize the result for action.
This is where FineBI + Dora offers a practical enterprise path. FineBI builds the trusted dashboard, metric model, and semantic foundation. Dora acts as an enterprise Data Agent on top of that foundation, so users can move from searching dashboards to asking business questions directly and receiving governed answers, summaries, alerts, and follow-up support.
For different personas, the value looks different:
- Executives want fast visibility into risk, performance, and owner follow-up.
- Analysts want self-service exploration plus reusable trusted KPI definitions.
- Operational teams want timely updates without waiting for a manual report build.
- IT teams want governance, permission control, semantic consistency, and reusable AI Skills rather than unmanaged prompt experiments.
Dashboards, Reports, and Analytics: What’s the Difference?
Understanding the difference between dashboards, reports, and analytics helps teams choose the right workflow for the right business need.
How reporting answers “what happened”
Reporting is structured, repeatable, and usually tied to ongoing monitoring. It answers questions like:
- What was revenue last month?
- Did we hit the weekly target?
- Which stores missed SLA?
- How many leads converted by channel?
Reporting usually includes:
- Scheduled reports
- KPI summaries
- Standard dashboards
- Status snapshots
- Recurring management updates
For example, a weekly sales report may include total revenue, target attainment, win rate, and regional performance. Its purpose is to create a common view of performance and make sure everyone starts from the same facts.
In enterprise environments, good reporting supports:
- Consistent communication
- Team accountability
- Faster meeting preparation
- Timely exception review
- Better alignment across departments
How analytics answers “why it happened” and “what to do next”
Analytics goes a step further. It investigates performance drivers and supports decision-making. It answers questions like:
- Why did conversion drop in one region?
- Which customer segment drove margin decline?
- What changed after the pricing update?
- Which product category is causing inventory pressure?
Analytics often includes:
- Filtering and segmentation
- Trend analysis
- Period comparisons
- Contribution analysis
- Drill-down by region, product, channel, or team
- Early root-cause exploration
This is where users often need more than a static dashboard. They need the ability to ask follow-up questions and get an immediate, governed response. Dora helps here by acting as a Data Analyst digital employee that can retrieve trusted FineBI metrics, understand KPI definitions, apply semantic rules, and generate chart-based answers in chat.
Examples of when to use one, the other, or both
Here is a practical way to think about usage:
| Scenario | Reporting Need | Analytics Need |
|---|---|---|
| Sales review | Weekly pipeline and revenue summary | Why one region missed target, which accounts are at risk |
| Marketing performance | Campaign spend, leads, conversion by channel | Which campaigns produce high-value pipeline, what audience trends changed |
| Operations tracking | On-time delivery, backlog, defect rate | Root causes of delays, shift-level performance, supplier impact |
| Finance management | Monthly revenue, cost, margin statements | Margin erosion drivers, unusual spending patterns, forecast sensitivity |
In most real businesses, the answer is not reporting or analytics. It is both. Reporting creates visibility. Analytics creates understanding. The best enterprise setups connect the two.
Key Tableau Features That Support Analytics and Reporting
Tableau is commonly adopted because it supports visual exploration as well as recurring information delivery. Below are the feature areas most relevant to analytics and reporting workflows.
Core Framework / Key Metrics
No reporting tool creates value on its own. The foundation is a clear KPI framework. Whether you use Tableau, FineBI, or another BI layer, teams need agreed metric definitions before dashboards and AI workflows can be trusted.
KPI categories that matter in analytics and reporting
Different functions track different metrics, but most enterprise reporting frameworks include five layers:
- Outcome KPIs
- Efficiency KPIs
- Quality KPIs
- Risk KPIs
- Forecast or pipeline KPIs
Common KPIs for business reporting workflows
-
Revenue: Total recognized sales in a defined period.
Business value: Shows topline performance and target attainment.
AI use: Dora can retrieve revenue by period, region, or product through chat and include it in scheduled executive briefings. -
Gross Margin: Revenue minus direct cost, often shown as amount or percentage.
Business value: Helps leaders assess profitability, not just volume.
AI use: Dora can compare margin changes across segments and flag unusual declines for review. -
Conversion Rate: The share of leads, opportunities, or orders that move to the next stage.
Business value: Reveals funnel efficiency and commercial execution quality.
AI use: Dora can answer natural-language questions such as which channels had the best conversion last month and generate a chart-based comparison. -
On-Time Delivery Rate: Percentage of shipments or orders delivered within the promised window.
Business value: Critical for customer satisfaction and operational reliability.
AI use: Dora can monitor threshold breaches and act as a Risk Alert Officer to push exception summaries to responsible teams. -
Inventory Turnover: How quickly inventory is sold or used over time.
Business value: Supports working capital control and demand planning.
AI use: Dora can summarize slow-moving categories and provide a dashboard-style analysis view before planning meetings. -
Defect Rate: Share of units, orders, or processes with quality issues.
Business value: Connects operational quality to cost and customer outcomes.
AI use: Dora can detect abnormal spikes and produce a preliminary analysis summary for managers. -
Pipeline Coverage: The amount of qualified pipeline compared with sales target.
Business value: Indicates whether future target achievement is realistic.
AI use: Dora can retrieve pipeline coverage by team, identify risk gaps, and push scheduled summaries to sales leaders.
Interactive dashboards for self-service insights
Interactive dashboards support fast exploration. Users can filter by time, region, product, channel, team, or customer segment and quickly narrow down the issue they want to examine.
Typical self-service capabilities include:
- Date and category filters
- Drill-down from summary to detail
- Cross-chart interaction
- Comparative views
- Trend lines and outlier spotting
These features help analysts and managers investigate questions without building a new report every time. However, self-service only works well when definitions are governed. If “revenue,” “active customer,” or “qualified lead” mean different things to different teams, the dashboard becomes visually polished but operationally unreliable.
That is why FineBI’s semantic layer matters. It gives organizations a more trusted base for dashboards, metrics, and reusable business definitions. Dora then uses that governed layer to answer natural-language questions in a more controllable way.
Automated and shareable reporting workflows
A reporting tool becomes more valuable when it supports repeatable distribution. Teams usually need more than a dashboard link. They need information delivered at the right time and in the right format.
Useful reporting workflows include:
- Scheduled refreshes
- Email subscriptions
- Threshold alerts
- Report exports
- Shared views for business meetings
- Periodic management summaries
This is also where AI can materially improve execution. Instead of simply sending a dashboard, Dora can act as a Daily Briefing Secretary or Report Researcher that retrieves KPI changes from FineBI, summarizes what changed, highlights risk areas, and pushes a concise briefing to the right stakeholders.
Data connections and preparation
Reliable reporting depends on reliable input data. Tableau is often used because it can connect to spreadsheets, databases, and cloud platforms. But connection alone is not enough. Teams still need to:
- Clean inconsistent fields
- Standardize business definitions
- Reconcile duplicate dimensions
- Handle missing or delayed records
- Validate KPI logic
- Apply access permissions
This is especially important if AI is part of the workflow. AI should not sit on top of weak definitions and poor data quality. Dora performs best when FineBI or an existing trusted BI layer already provides governed metrics, semantic rules, and permission boundaries.
How Teams Use Tableau in Real Analytics Workflows
In practice, reporting and analytics are not separate projects. They are part of one operational workflow.
From raw data to a finished dashboard
A typical BI workflow looks like this:
- Connect source data from spreadsheets, operational systems, databases, or cloud tools.
- Clean and prepare the data for consistency.
- Define metrics and business logic.
- Build visualizations and dashboard layouts.
- Test KPI accuracy with stakeholders.
- Publish and share the final dashboard.
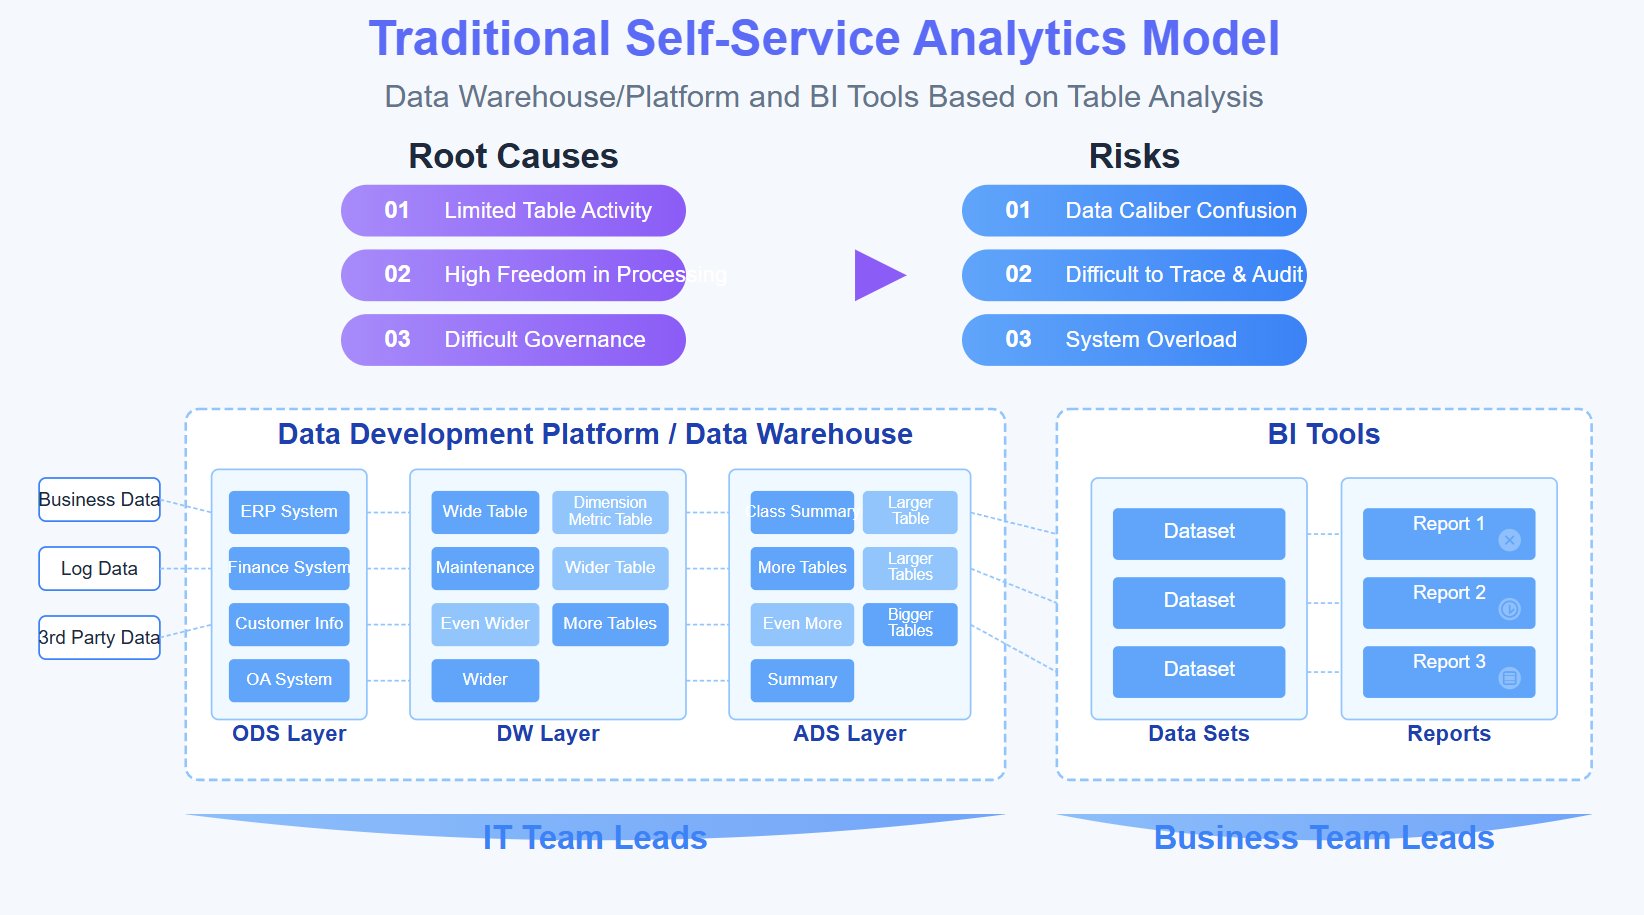
This workflow is familiar to most BI teams. The challenge comes after publication. Users still need to interpret the output, ask follow-up questions, and turn insight into next steps. FineBI helps strengthen the governed metric and dashboard foundation. Dora helps close the final-mile execution gap.
Using Tableau for recurring reporting and ad hoc analysis
Most teams need both:
- Recurring reporting for weekly, monthly, or quarterly management updates
- Ad hoc analysis for new questions that emerge during operations or meetings
For example, a sales manager may review a recurring dashboard every Monday, then ask an analyst on Wednesday why conversion in one region dropped. In a traditional setup, that requires manual follow-up. In an Agentic BI setup, Dora can help retrieve the right FineBI dashboard or analysis subject, understand the KPI logic, and respond with a chart-based answer in chat.
Collaboration between analysts, managers, and stakeholders
A shared dashboard environment improves alignment when it is built on trusted definitions. Analysts define and validate metrics. Managers monitor outcomes. Stakeholders use the same baseline to discuss actions.
In the AI era, collaboration also changes:
- IT teams maintain connections, permissions, semantic assets, and reusable AI Skills.
- Analysts curate metrics and trusted business logic.
- Managers ask business questions in natural language and receive structured answers.
- Executives consume scheduled summaries and risk alerts rather than waiting for manual consolidation.
That is why Dora is best positioned not as a generic chatbot, but as an enterprise Data Agent built for governed AI workflows on top of trusted BI assets.
How an AI Data Agent Handles This Scenario
If your organization already has dashboards but still struggles with follow-up analysis, meeting prep, and owner notification, this is the scenario where Dora adds concrete value.
The most relevant Dora digital employee here is the Data Analyst digital employee, supported by the Daily Briefing Secretary and Risk Alert Officer when summaries and exception monitoring are needed.
A scenario-specific query could look like this:
“Show me this month’s sales performance by region, target achievement, top declining product categories, and any accounts at risk of missing forecast.”
A practical Dora workflow for analytics and reporting
-
Retrieve trusted FineBI assets
Dora identifies the relevant FineBI dashboard, dataset, or analysis subject tied to sales performance. -
Understand KPI definitions and semantic rules
Dora interprets business terms such as target achievement, forecast risk, region, and product category based on governed semantic assets rather than free-form guessing. -
Generate a chart-based answer or dashboard-style analysis view
In chat, Dora returns the relevant metrics, comparisons, and a visual analysis summary that business users can understand quickly. -
Detect anomalies or threshold breaches
If a region drops below target or a product category declines beyond a set threshold, Dora can flag the exception and explain the preliminary pattern. -
Push summaries and alerts to responsible users
Dora can send a scheduled briefing to leadership, notify regional owners of underperformance, or prepare a concise summary before the next review meeting. -
Support follow-up and action review
Dora can help generate a management-ready recap, list the affected segments, and support ongoing check-ins using the same governed metric framework.
Why FineBI matters in this AI workflow
Dora works best when the BI foundation is trusted. FineBI provides:
- Governed KPI definitions
- Trusted dashboards and analysis subjects
- Semantic consistency across teams
- Permission-controlled access
- Reusable visual and metric assets
Without that foundation, AI responses may be fast but unreliable. With FineBI, Dora can operate as a more enterprise-ready AI assistant with clearer execution paths, auditable workflows, and better alignment to business definitions.
What Dora improves beyond dashboard access
Dora helps enterprises move beyond “people looking at dashboards” toward “AI helping people ask, analyze, generate, push, alert, and follow up.”
 That means users can benefit from:
- Natural-language data query over trusted BI assets
- Chat-based access for non-technical business users
- Dashboard and metric retrieval from FineBI assets
- Chart-based answers and dashboard-style analysis views
- Scheduled daily or weekly briefings
- Anomaly alerts and push notifications
- Skills-based execution for more controllable workflows
- Better enterprise fit through permissions, semantic rules, KPI governance, and data quality controls
This is why Dora is better framed as a practical fourth-generation Agentic BI path. It combines natural-language request, trusted semantic understanding, governed query or Skill execution, and business-ready answers plus follow-up.
Why Reporting and Analytics Matter for Growth
Organizations grow faster when they can see performance clearly, understand the drivers behind it, and respond quickly.
Better visibility into performance and opportunities
Consistent measurement helps teams identify:
- Positive trends worth scaling
- Early warning signs
- Underperforming segments
- Operational bottlenecks
- Margin pressure
- Team execution gaps
Without structured analytics and reporting, many of these issues are discovered too late or discussed without evidence.
Faster decisions with trusted data
Accessible dashboards reduce guesswork. Trusted metrics reduce internal debate. AI-assisted follow-up reduces delay between question and action.
For executives, this means less time waiting for manual report consolidation. For managers, it means faster insight into what changed. For frontline business users, it means lower friction in getting answers.
Dora is not an AI experiment. It is a landed digital employee for recurring data work such as sales briefing, order risk follow-up, monthly report generation, quality anomaly alert, and owner follow-up.
Common mistakes to avoid when using Tableau
Even strong tools can fail if the operating model is weak. Common issues include:
- Unclear KPI definitions
- Outdated or inconsistent source data
- Overdesigned dashboards that hide the message
- Too many charts with no decision context
- Poor governance over permissions and data ownership
- Treating AI as a shortcut instead of building a trusted semantic layer first
For IT teams, the opportunity in the AI era is clear: move from manually building every dashboard toward optimizing enterprise data connections, semantic layers, data quality, permission governance, and reusable agent Skills.
Actionable Best Practices
To make analytics and reporting work in a real enterprise setting, focus on implementation discipline rather than tool features alone.
1. Standardize KPI definitions and ownership
Define each KPI clearly, including calculation logic, filters, time scope, and owner. This reduces confusion between teams and makes both dashboards and AI responses more trustworthy.
2. Build a semantic layer inside the BI workflow
Do not rely on users to remember every table, field, and business rule. FineBI can provide governed semantic assets so both dashboards and Dora workflows use the same business language.
3. Treat data quality as part of the AI implementation
If source data is delayed, duplicated, or inconsistent, AI will only surface those problems faster. Validate data pipelines, refresh logic, and exception handling before expanding AI use cases.
4. Start with recurring high-value workflows
Do not try to automate every question at once. Begin with stable scenarios such as:
- Weekly sales briefing
- Monthly business review pack
- Order risk monitoring
- Margin exception follow-up
- Operations KPI summary
These are ideal for Dora digital employees such as the Daily Briefing Secretary, Report Researcher, or Risk Alert Officer.
5. Preserve governance and human review
AI outputs should respect FineBI permission boundaries and business rules. Use human review for AI-generated summaries and reports at the early stage, then gradually expand trusted Skills and automation scope.
How to Decide If Tableau Is the Right Reporting Tool for You
Tableau can be a strong option if your team needs visual analysis, interactive dashboards, and flexible reporting across multiple data sources. It is often a good fit when:
- Data comes from several business systems
- Analysts need exploration flexibility
- Managers need dashboard access across teams
- Reporting requirements change frequently
- The organization values strong visual communication
However, the best-fit decision should also consider broader operational needs.
Evaluate your current analytics and reporting setup across these questions:
- How easy is it for business users to get answers without analyst support?
- Are KPI definitions standardized and governed?
- Can the platform scale across departments and data domains?
- Does it support permission management and semantic consistency?
- How well does it integrate with your existing systems?
- Can it support both recurring reporting and on-the-fly analysis?
- Do you also need an AI assistant layer for summaries, alerts, and follow-up?
If your organization already has trusted BI assets but wants to reduce friction in how users consume and act on data, Dora can also be deployed as a standalone enterprise Data Agent layer. But when teams need both the governed BI foundation and the AI execution layer, FineBI + Dora is the stronger combined path.
FineBI + Dora Solution Pitch
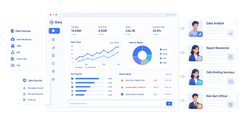 Building this manually is complex. FineBI helps teams build trusted dashboards, metrics, and semantic assets. Dora turns those assets into an AI assistant that can answer questions in chat, generate dashboard-style analysis views, push scheduled summaries, monitor anomalies, and follow up with responsible owners.
FineBI + Dora is not only a BI upgrade; it is a practical fourth-generation Agentic BI path. FineBI provides governed metrics and visual analysis. Dora provides the AI assistant layer for scenario execution, with more controlled Skills, lower token waste, faster execution paths, and more stable workflows than prompt-only agents.
For enterprise decision-makers, this matters because adoption depends on landing real workflows, not just showcasing AI features. Business users want timely metrics and chart-based answers. Executives want concrete scenario ROI. IT wants governance and reusable execution patterns. FineBI + Dora aligns all three.

Get Ready-to-Use Dashboard Templates in Fine Gallery
The strongest Dora pitch is scenario + product + service: FineBI provides the trusted BI foundation, Dora provides the AI digital employee, and implementation service connects data, governance, semantic setup, Skills, and rollout.
If you are comparing Tableau with your current reporting environment, do not just compare dashboard features. Compare the full operating model: metric governance, business usability, AI landing capability, alerting workflow, and the ability to turn dashboards into repeatable action.
FAQs
A Tableau reporting tool helps teams turn business data into dashboards, KPI views, and recurring reports so they can monitor performance and share updates. It is commonly used for sales, marketing, operations, and executive reporting.