HR reporting shows what happened.
HR analytics explains why it happened.
Executive dashboards connect workforce data to business decisions.
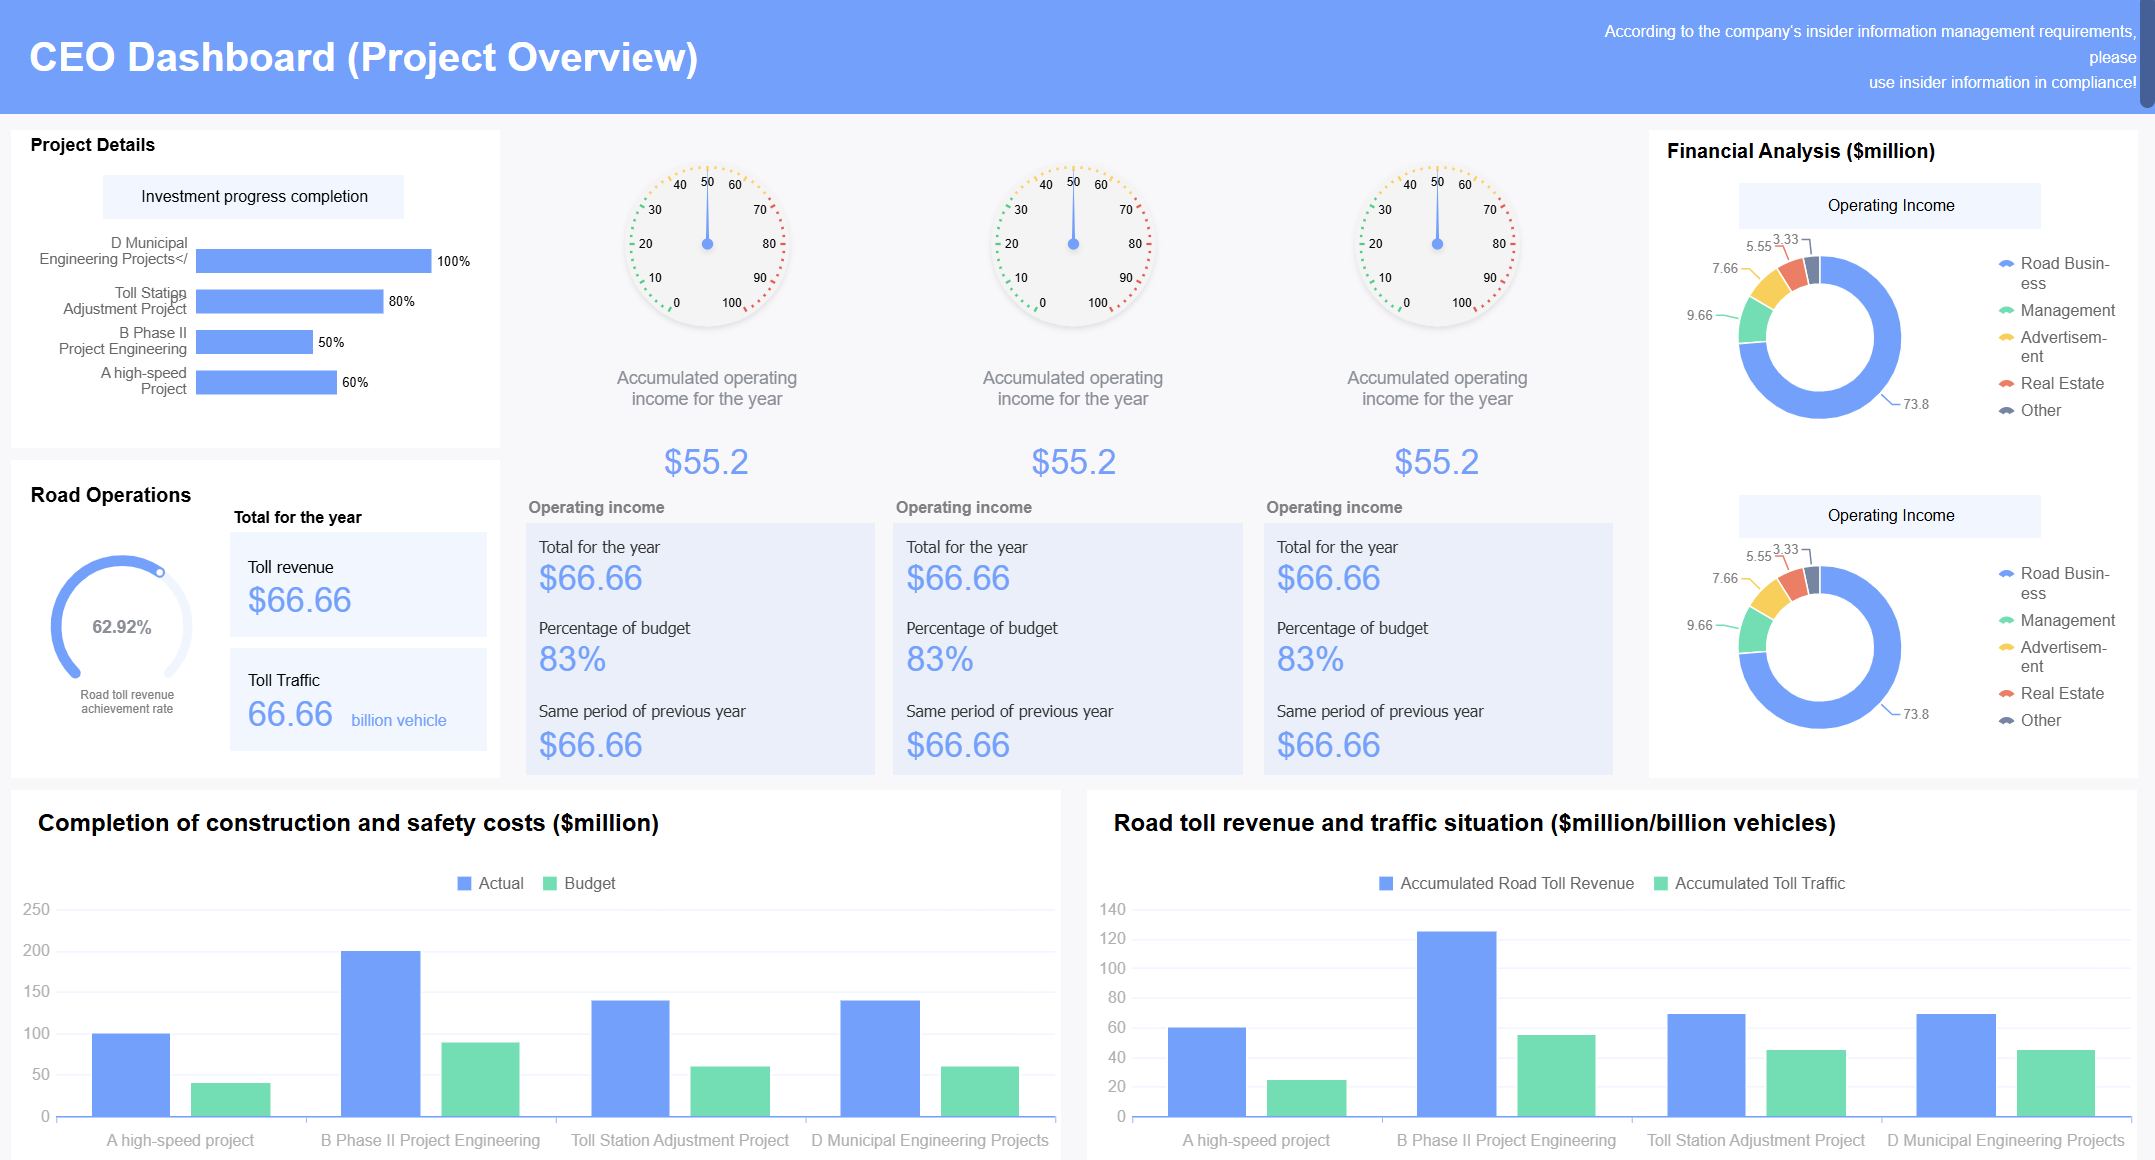
An executive HR dashboard connects workforce metrics with business decisions.
The most important HR dashboard areas are:
Headcount and workforce capacity
Employee turnover and regrettable attrition
Hiring speed and quality
Critical role coverage
Workforce cost and productivity
CHROs do not need more HR reports. They need hr reporting and analytics that help leadership decide where to hire, where retention risk is rising, and where workforce constraints will affect revenue, productivity, compliance, and delivery.
A useful executive dashboard should do two things at once: provide a trusted view of headcount, turnover, and hiring, and make it easier for leaders to act on that view. With FineBI + Dora, business users can ask for analysis in chat, generate chart-based answers or dashboard-style views from trusted BI assets, and receive scheduled summaries before the next meeting.
What HR reporting and analytics means for CHROs
For a CHRO, hr reporting and analytics is not just about producing monthly people reports. It is about creating a leadership system that moves from what happened, to why it happened, to what leaders should do next.
Define the difference between reporting, analytics, and executive decision support
At the executive level, these are related but different:
HR reporting shows the current state of the workforce.
Example: total headcount, monthly exits, open roles, and hiring volume.
HR analytics explains patterns, relationships, and likely business impact.
Example: whether regrettable attrition in customer-facing teams is slowing revenue expansion or increasing service risk.
Executive decision support turns insight into a practical leadership choice.
Example: whether to accelerate hiring in a priority unit, redesign spans of control, or invest in retention for critical roles.
This distinction matters because many dashboards stop at activity tracking. A CHRO dashboard should instead connect people data to enterprise outcomes.
Explain why CHROs need a dashboard that connects workforce metrics to revenue, productivity, and risk
A headcount dashboard alone is not strategic. A turnover chart alone is not strategic. Hiring data alone is not strategic. The value appears when these metrics are connected to business consequences such as:
delayed expansion because priority roles remain unfilled
lower productivity because high-impact teams are under capacity
margin pressure caused by repeated backfilling and ramp-up costs
customer experience risk when front-line attrition spikes
compliance or operational instability when key roles lose coverage
This is why CHROs need an executive dashboard rather than a collection of HR reports. Leadership wants to know whether workforce trends are helping or hurting execution.
Clarify the leadership questions an executive dashboard should answer
Are we growing headcount in the right functions and geographies?
Is turnover concentrated in critical populations or manageable areas?
Are we hiring fast enough to support business plans?
Which talent gaps create the biggest operational or revenue risk?
Where are hiring and retention investments likely to produce the greatest business return?
Which workforce trends require leadership action this quarter?
These are not HR-only questions. They sit at the intersection of HR, finance, operations, and executive planning.
Choose the business outcomes your executive dashboard should track
Before selecting metrics, define the business outcomes that leadership actually cares about. The dashboard should not become a catalog of every HR data point available in the HRIS and ATS.
Align HR metrics with company goals
The best hr reporting and analytics programs start with company priorities. For most CHROs, that means linking workforce indicators to goals such as:
Growth: Can hiring capacity support expansion plans, new territories, or product launches?
Profitability: Are turnover and vacancy patterns driving avoidable labor cost, lost productivity, or excess recruiting spend?
Customer experience: Are attrition or staffing gaps in service, sales, or delivery teams affecting service levels and response times?
Compliance: Do workforce gaps or manager overload create risk in regulated or sensitive functions?
Operational stability: Are key teams fully staffed enough to maintain execution quality?
Prioritize a small set of outcome-based measures for executive review
Executives do not need 40 metrics on one screen. A better approach is to focus on a small set of measures that explain business performance. Typical executive-level categories include:
workforce capacity
workforce risk
hiring effectiveness
talent coverage in priority roles
cost and productivity implications
If a metric does not influence a leadership decision, it likely belongs in an operational view rather than the CHRO dashboard.
Identify the decisions the dashboard must support
Dashboards become more useful when each metric ties to a decision.
Determine which choices leaders need to make about hiring pace, workforce planning, retention, and org design
The dashboard should support choices such as:
whether to increase or slow hiring by business unit
where to prioritize retention intervention
how to rebalance spans of control
whether workforce growth is aligned with strategic priorities
how to sequence hiring for critical roles
whether org design changes are needed in overextended teams
Separate strategic metrics from operational detail
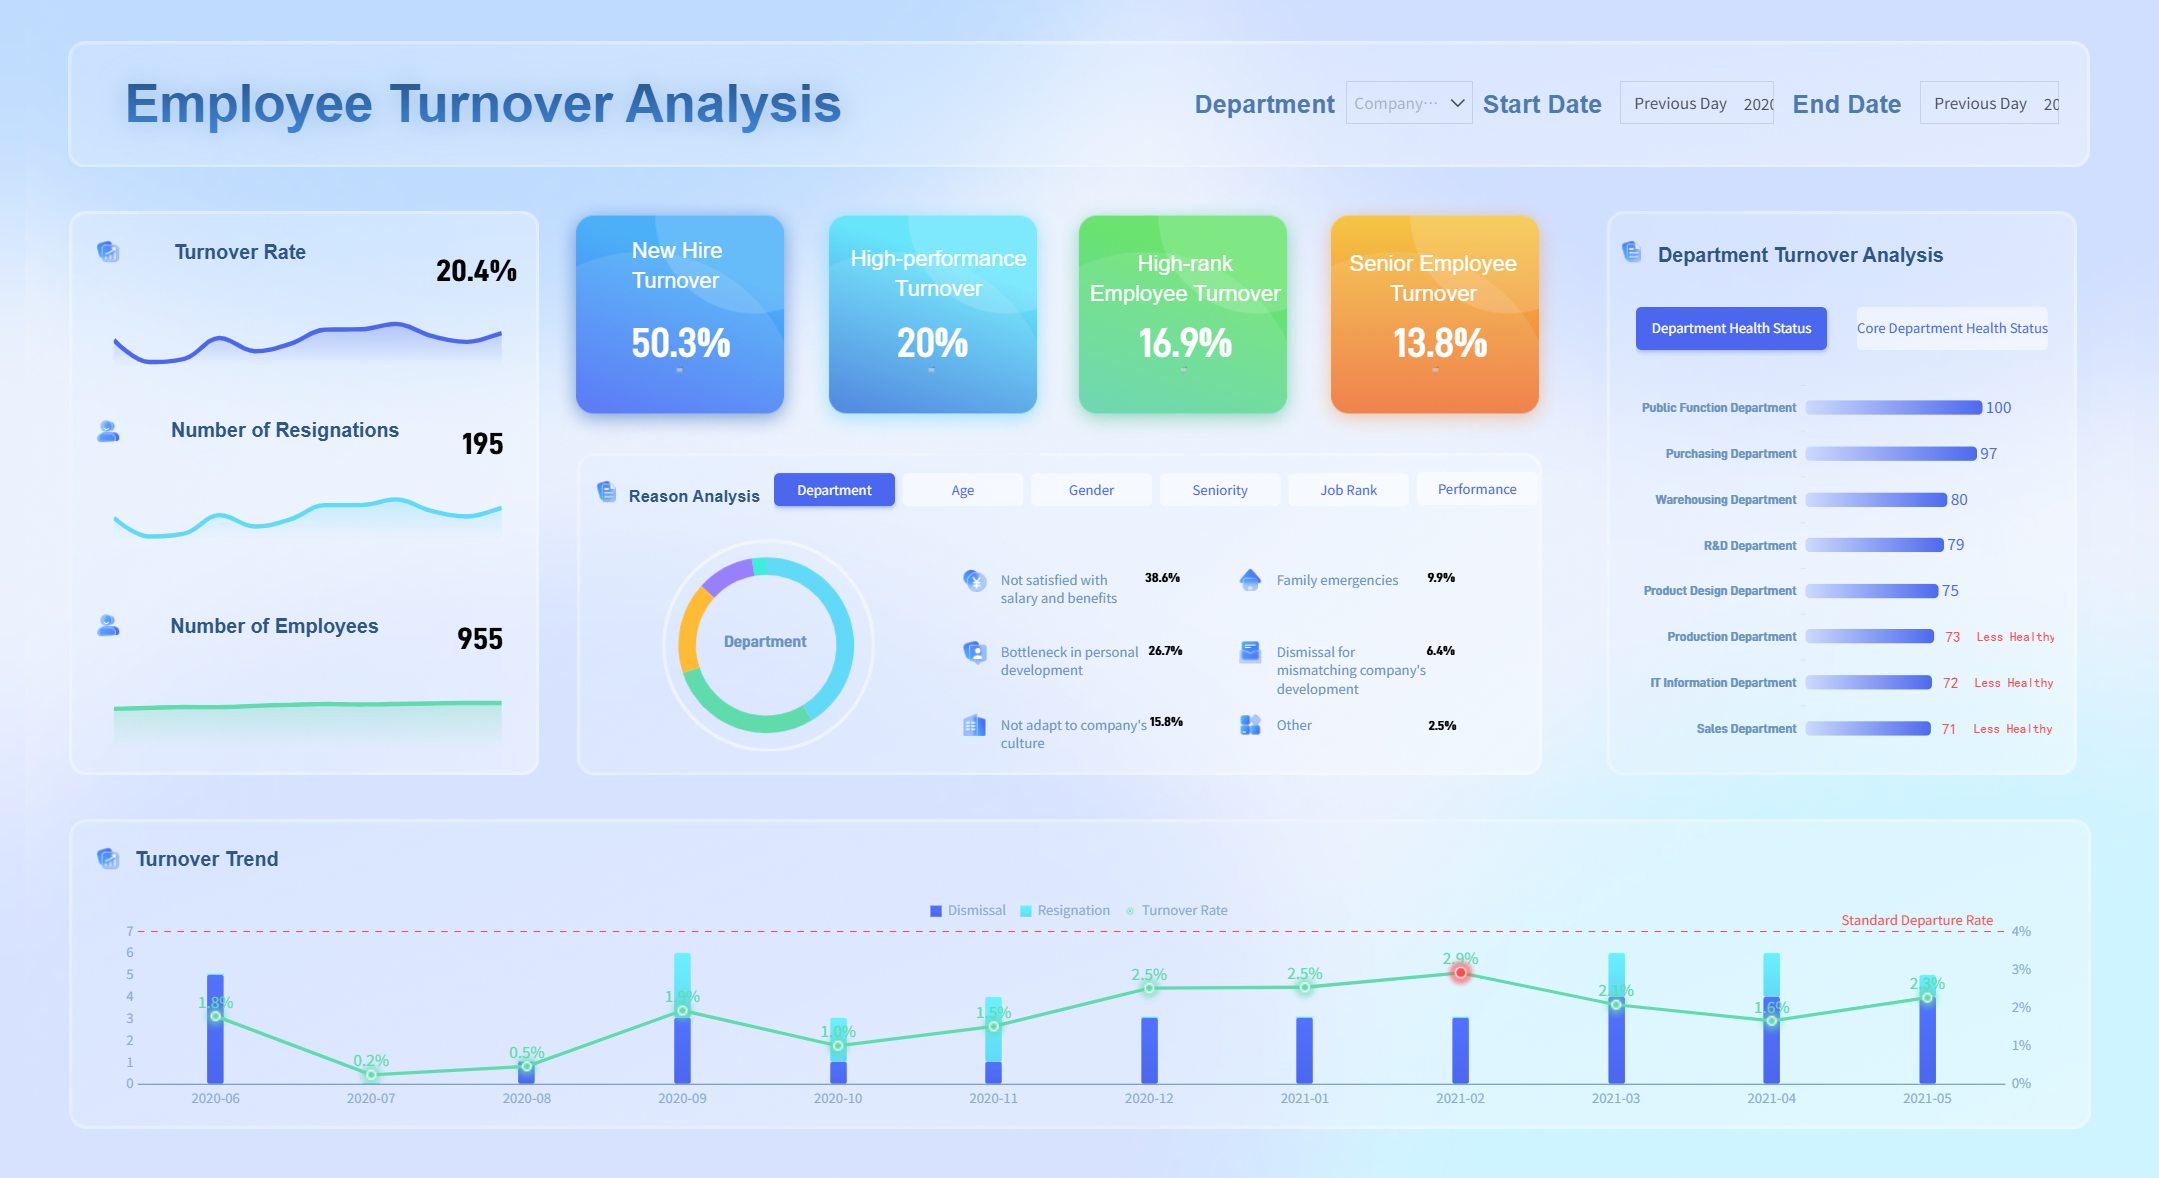
Headcount dashboards help leaders monitor workforce capacity across teams and regions.
Executive users need summary metrics with drill-down capability, not recruiter-level workflow clutter on the main page. Separate the dashboard into:
Strategic layer: headcount growth, regrettable attrition, critical role coverage, hiring speed for priority roles
FineBI is especially effective here because it allows teams to build governed executive views on top of detailed workforce data, while preserving drill-down for HR leaders and analysts when needed.
Build the core dashboard: headcount, turnover, and hiring
The most effective CHRO dashboard usually centers on three core domains: headcount, turnover, and hiring. Together, they show whether the company is building and keeping the workforce needed to execute strategy.
Headcount metrics that matter at the executive level
Headcount is not just a staffing number. It is a signal of organizational capacity, cost structure, and execution readiness.
Track total headcount, growth rate, span of control, and critical role coverage
Below are the foundational metrics to include.
Total headcount: The number of active employees in the organization or selected population. Business value: Shows workforce size and capacity relative to business scale. AI use:Dora can retrieve current headcount by unit, compare it to plan, and summarize where staffing is above or below target.
Headcount growth rate: The percentage increase or decrease in headcount over a defined period. Business value: Helps leaders judge whether workforce expansion matches growth strategy and budget. AI use:Dora can explain which teams drove growth, generate a trend chart, and include the result in a scheduled executive briefing.
Span of control: The average number of direct reports per manager. Business value: Reveals org design efficiency, leadership load, and possible management bottlenecks. AI use:Dora can flag functions with unusually wide or narrow spans and surface exceptions for review.
Critical role coverage: The share of strategically important roles that are filled versus required. Business value: Highlights capability risk in essential functions. AI use:Dora can monitor coverage thresholds and push alerts when priority roles remain open too long.
Break down trends by business unit, geography, and function
Headcount only becomes actionable when leaders can view it by:
business unit
region or country
department or function
role family
manager hierarchy
critical versus non-critical role groups
A CHRO may see acceptable overall growth while one market or business line remains under capacity. FineBI helps model these dimensions into trusted semantic assets so the same business definitions are reused across dashboards and AI workflows.
Turnover metrics that reveal business risk
Turnover becomes strategic when it highlights lost capability, execution gaps, and future workforce pressure.
Compare voluntary and involuntary turnover
Not all exits mean the same thing.
Voluntary turnover: Employee-initiated exits during a period. Business value: Indicates retention strength, labor market competitiveness, and employee experience issues. AI use:Dora can compare voluntary turnover across functions and identify where attrition is trending above target.
Involuntary turnover: Employer-initiated exits during a period. Business value: Helps leaders understand workforce quality, restructuring impact, and performance management patterns. AI use:Dora can generate chart-based answers showing which units have elevated involuntary turnover and summarize possible implications.
Highlight regrettable attrition, early tenure exits, and loss in high-impact teams
These are often more important than the total turnover rate.
Regrettable attrition: Exits of strong performers or critical talent the company wanted to retain. Business value: Direct indicator of capability loss and replacement risk. AI use:Dora can retrieve regrettable attrition by priority group and include it in risk briefings for CHRO and business leaders.
Early tenure exits: Employees leaving within an early service window, such as 90 days, 6 months, or 1 year. Business value: Often points to hiring quality, onboarding issues, manager fit, or role expectation problems. AI use:Dora can detect unusual spikes, compare by source or team, and flag where intervention is needed.
Turnover in high-impact teams: Attrition in revenue-driving, customer-facing, regulated, or hard-to-replace roles. Business value: Reveals business risk that average enterprise turnover may hide. AI use:Dora can rank teams by risk exposure and push alerts to responsible leaders when thresholds are breached.
Show the cost and performance implications of turnover patterns
Executive dashboards should not stop at exit rates. They should show related impact, such as:
vacancy risk
replacement cost
ramp-up delay
overtime or workload burden on remaining staff
customer or delivery exposure
This is where hr reporting and analytics becomes more valuable to the C-suite. The conversation moves from “turnover went up” to “turnover in field service is now affecting service capacity and target attainment.”
Hiring metrics that show speed, quality, and efficiency
Hiring data tells leadership whether the organization can close workforce gaps fast enough and effectively enough.
Monitor time to fill, time to hire, offer acceptance, source effectiveness, and hiring for priority roles
Key hiring metrics include:
Time to fill: Days from approved requisition to accepted offer or filled role. Business value: Indicates how quickly the business can restore or add capacity. AI use:Dora can compare time to fill for priority roles versus standard roles and summarize bottlenecks.
Time to hire: Days from candidate engagement or application to offer acceptance. Business value: Reflects process efficiency and candidate experience. AI use:Dora can break down delays by stage and generate a dashboard-style analysis view in chat.
Offer acceptance rate: Percentage of offers accepted by candidates. Business value: Signals employer competitiveness, compensation alignment, and recruiter effectiveness. AI use:Dora can monitor declines by market or role type and include exceptions in weekly recruiting briefings.
Source effectiveness: Performance of recruiting channels based on hires, quality, or retention outcomes. Business value: Improves recruiting investment and pipeline quality. AI use:Dora can retrieve source-level conversion and compare outcomes across channels.
Hiring for priority roles: Fill progress and speed for roles tied directly to strategic execution. Business value: Keeps leadership focused on the positions that matter most to growth and continuity. AI use:Dora can maintain a targeted briefing on open critical roles, delayed fills, and owner follow-up.
Connect recruiting performance to business capacity and execution timelines
If a strategic program depends on 50 hires in a specific region and those roles are filling slowly, that is not just a recruiting problem. It is a business delivery issue. Executive dashboards should show:
required capacity versus current capacity
planned hiring versus actual hiring
open priority roles by aging bucket
whether hiring pace is enough to offset attrition
This relationship view is often what makes a CHRO dashboard credible with the CEO and CFO.
Turn workforce metrics into business insight
The dashboard becomes executive-grade when it shows how the workforce system works as a whole.
Show relationships across headcount, turnover, and hiring
A strong dashboard should reveal questions like:
Is hiring truly offsetting attrition?
Which teams are replacing exits but still not reaching required capacity?
Where is net headcount growing, shrinking, or staying flat?
Which workforce gaps may soon affect delivery, sales, or customer support?
Useful calculations and views include:
net headcount change
hires-to-exits ratio
critical role vacancy trend
open role aging versus attrition trend
turnover-to-backfill lag
Trend lines and ratios are especially helpful because they reveal pressure before the business feels the full impact.
Add context with benchmarks and targets
Raw numbers rarely drive action on their own. CHRO dashboards should compare current performance against:
annual operating plan
quarterly workforce targets
historical trends
internal business-unit benchmarks
role-based targets for critical populations
Use targets that reflect actual strategy, not vanity metrics. A healthy turnover rate is not the same across all roles, markets, or labor conditions. Likewise, time to fill for a niche technical role should not be judged against the same expectation as a high-volume support role.
Translate findings into executive actions
Every major dashboard section should answer: What should leadership do now?Turnover analysis helps HR leaders identify retention risks in critical teams.
Examples include:
accelerate hiring in a region where capacity is below plan
intervene with managers in teams showing high regrettable attrition
rebalance organization layers where spans of control are creating overload
revise compensation or hiring packages in low acceptance markets
prioritize retention of high-impact roles before launching expansion plans
This is also where AI can help move faster from dashboard review to leadership follow-up.
How an AI Data Agent Handles This Scenario
For CHROs and HR leadership teams, Dora can act as a Daily Briefing Secretary, Data Analyst digital employee, and Risk Alert Officer on top of the FineBIworkforce analytics foundation.
Instead of waiting for analysts to pull slides before every talent review, leaders can ask questions in natural language, retrieve trusted metrics from FineBI assets, and receive scheduled summaries and risk alerts tied to executive decisions.
A scenario-specific chat example
A CHRO might ask:
“Show me this quarter’s headcount change, regrettable attrition, and hiring progress by business unit. Highlight teams where hiring is not offsetting turnover and summarize the business risk.”
Dora can return a chart-based answer or dashboard-style analysis view using governed FineBI metrics, filters, and HR definitions already approved by the organization.
The relevant Dora digital employee
In this scenario, the most relevant Dora roles are:
Data Analyst digital employee: for natural-language data query, dashboard retrieval, and follow-up analysis
Daily Briefing Secretary: for scheduled weekly or monthly executive HR summaries
Risk Alert Officer: for monitoring regrettable attrition, critical role vacancies, and hiring delays
Retrieve trusted FineBI dashboard or analysis-subject data. Dora accesses the approved FineBI workforce dashboard, HR semantic model, and authorized data assets for headcount, turnover, and hiring.
Understand KPI definitions, filters, business terms, and semantic rules. Dora uses governed metric definitions such as “regrettable attrition,” “critical role,” “active headcount,” and “priority hiring” so answers follow enterprise logic rather than ad hoc interpretation.
Generate chart-based answers and executive summaries through chat.
The CHRO or HRBP asks a question in plain language, and Dora returns the relevant metrics, trend charts, and concise narrative explanation.
Detect abnormalities or threshold breaches. Dora identifies issues such as sharp rises in voluntary turnover, delayed fills in strategic roles, or headcount gaps in key regions.
Push alerts or summaries to responsible stakeholders. Dora sends timely briefings or exception notices to CHROs, HR leaders, and business owners based on configured responsibility rules.
Support follow-up and meeting preparation. Dora prepares a pre-meeting summary for talent reviews, board updates, or operating reviews, including the main KPI changes and open risk items.
Why FineBI matters as the trusted foundation
Dora is most valuable when it sits on top of governed BI assets. FineBI provides that foundation by organizing:
trusted dashboards
standardized KPI definitions
reusable semantic models
role-based permissions
drill-down paths by function, geography, and business unit
This matters in HR because terms like turnover, active employee, critical role, or manager span are often defined differently across teams. Without semantic consistency, AI answers can become unreliable. With FineBI + Dora, the AI assistant works from governed enterprise definitions rather than free-form interpretation.
How Dora improves execution beyond dashboards
Dora helps move from passive viewing to active follow-through:
Chat-based AI assistant: Leaders ask questions without searching through multiple dashboards.
Scheduled summaries: CHROs receive weekly or monthly briefings before operating reviews.
Anomaly alerts: HR leaders are notified when attrition or vacancy thresholds are breached.
Push notifications: Relevant findings can be sent to talent acquisition leaders, HRBPs, or business owners.
Follow-up support:Dora can generate concise summaries for meetings and action reviews.
This is why Dora should be positioned as an enterprise Data Agent and part of a governed AI workflow, not as a generic chatbot. It executes repeatable, auditable HR analytics tasks over trusted BI assets.
Design an executive dashboard leaders will actually use
Even the right metrics fail if the dashboard is cluttered, confusing, or inconsistent.
Keep the dashboard simple, visual, and decision-ready
An executive HR dashboard should be fast to interpret. Good design principles include:
keep the main view limited to the highest-value metrics
use one summary page for executive review
provide drill-down paths for HR and analyst users
label metrics clearly
display whether each KPI is on target, off target, or at risk
show trends and exceptions before detail tables
A strong layout often includes:
KPI summary cards
a headcount trend line
turnover risk heatmap
hiring progress chart
a risk or exception panel
FineBI supports this structure well because it combines strong visualization, governed self-service analytics, and flexible filtering for leadership audiences.
Improve data quality and governance
No amount of analytics design can compensate for inconsistent workforce definitions. CHRO dashboards should establish:
common metric definitions across HR, finance, and business teams
clear ownership for data updates and issue resolution
update cadence by metric type
access controls for sensitive HR data
auditability for executive reporting logic
This is also essential for AI readiness. Dora performs best when the underlying workforce metrics, filters, and business terms are standardized and trustworthy.
Select tools and systems that support HR analytics
Most executive HR dashboards rely on multiple systems, such as:
HRIS for employee and org data
ATS for recruiting metrics
payroll systems for workforce cost views
finance systems for budget and performance context
business intelligence tools for modeling, dashboards, and governance
The goal is not to keep adding disconnected tools. It is to create a governed analytics layer that connects workforce and business data in a way leaders can actually use. FineBI plays the BI foundation role here, and Dora adds the AI assistant layer for access, explanation, and follow-up.
Common mistakes to avoid and how to evolve the dashboard
Many HR dashboards fail not because the data is unavailable, but because the design and operating model are too report-centric.
Avoid dashboards that only describe activity
Common mistakes include:
listing too many metrics with no decision context
focusing on HR activity rather than business outcomes
reporting total turnover without showing where the risk sits
tracking hires without linking them to workforce capacity gaps
showing operational detail that executives do not need
failing to connect metrics across headcount, exits, and hiring
A better executive dashboard explains causes, implications, and likely next steps.
Create a roadmap for continuous improvement
Start with a minimum viable dashboard and expand as leadership maturity grows.
A practical roadmap might look like this:
Build a first executive view around headcount, turnover, and hiring.
Standardize KPI definitions and ownership.
Add business outcome context such as revenue capacity, delivery risk, or labor cost pressure.
Introduce Dora for natural-language retrieval, periodic summaries, and exception alerts.
Expand to more advanced views such as critical talent coverage, internal mobility, or manager effectiveness.
The best hr reporting and analytics programs evolve with company strategy, market conditions, and leadership questions.
Actionable Best Practices
To make this scenario work in a real enterprise, CHROs, HRIT teams, and analytics leaders should follow a few practical rules.
1. Standardize KPI definitions, synonyms, filters, and metric ownership
Agree on the exact meaning of terms such as active headcount, regrettable attrition, critical role, hiring plan, and early tenure exit. Define the owner of each metric and the approved filters. This improves dashboard consistency and gives Dora a stronger semantic base for trustworthy answers.
2. Build a semantic layer inside the BI workflow
Do not rely on raw tables and one-off logic in every report. FineBI should hold the trusted semantic assets that map workforce concepts to governed business definitions. Dora then uses that foundation for controllable, auditable AI responses.
3. Treat data quality as part of the AI implementation
AI will not fix poor HR data. Clean manager hierarchies, accurate termination reasons, consistent requisition status logic, and complete critical role tagging are all part of a successful Dora rollout. Better data quality leads to more reliable summaries, alerts, and follow-up.
4. Start with high-value recurring workflows instead of automating everything
These workflows have clear users, clear cadence, and visible business value.
5. Preserve permission governance and use human review for sensitive outputs
HR analytics often includes sensitive people data. Dora outputs should respect FineBI access boundaries and follow role-based permissions. For executive summaries, board materials, or sensitive talent topics, keep human review in the loop and expand Dora Skills gradually.
Building this manually is complex. FineBI helps teams build trusted dashboards, metrics, and semantic assets. Dora turns those assets into an AI assistant that can answer questions in chat, generate dashboard-style analysis views, push scheduled summaries, monitor anomalies, and follow up with responsible owners.
For CHROs, this means the executive dashboard is no longer just a place to look at HR numbers. It becomes a practical operating system for workforce decision support:
FineBI provides the governed foundation for headcount, turnover, and hiring analytics
Dora provides the enterprise Data Agent layer for natural-language access and repeatable workflow execution
HR, IT, and business leaders gain a more usable path from metrics to action
FineBI + Dora is not only a BI upgrade; it is a practical fourth-generation Agentic BI path. FineBI provides governed metrics and visual analysis. Dora provides the AI assistant layer for scenario execution, with more controlled Skills, lower token waste, faster execution paths, and more stable workflows than prompt-only agents.
For IT teams, this is also a better enterprise operating model. Instead of building every one-off report request manually, IT can focus on data connections, semantic layers, quality controls, permissions, and reusable AI Skills. For HR and business users, Dora reduces friction by making trusted workforce insight available through chat, summaries, alerts, and follow-up.
Get Ready-to-Use Dashboard Templates in Fine Gallery
The strongest Dora pitch is scenario + product + service: FineBI provides the trusted BI foundation, Dora provides the AI digital employee, and implementation service connects data, governance, semantic setup, Skills, and rollout.
For CHROs trying to make hr reporting and analytics more strategic, that combination is what turns a dashboard into an executive decision system.
A strong executive HR dashboard should focus on a small set of business-linked metrics such as headcount, turnover, hiring pace, vacancy risk, and talent coverage in critical roles. It should also show how those metrics affect revenue, productivity, service levels, compliance, or operational stability.
HR reporting shows what is happening through metrics like headcount, exits, and open roles. HR analytics goes further by explaining why patterns are happening and what actions leaders should take next.
The most useful metrics are the ones tied to executive decisions, including headcount growth, turnover in critical teams, time to fill, hiring volume, and workforce capacity. These measures become strategic when they are connected to outcomes like revenue impact, productivity loss, or service risk.
A well-designed dashboard helps leaders spot retention problems, hiring delays, and understaffed teams before they become bigger business issues. With the right drill-downs, HR can identify where intervention is needed and prioritize the highest-impact actions.
Executive teams need to understand whether workforce trends are supporting or limiting business performance. When HR data is tied to business outcomes, the dashboard becomes a decision tool instead of just a reporting screen.
Product Trial
FineReport
Pixel-perfect reports · Interactive dashboards · Easy data entry · Digital twins


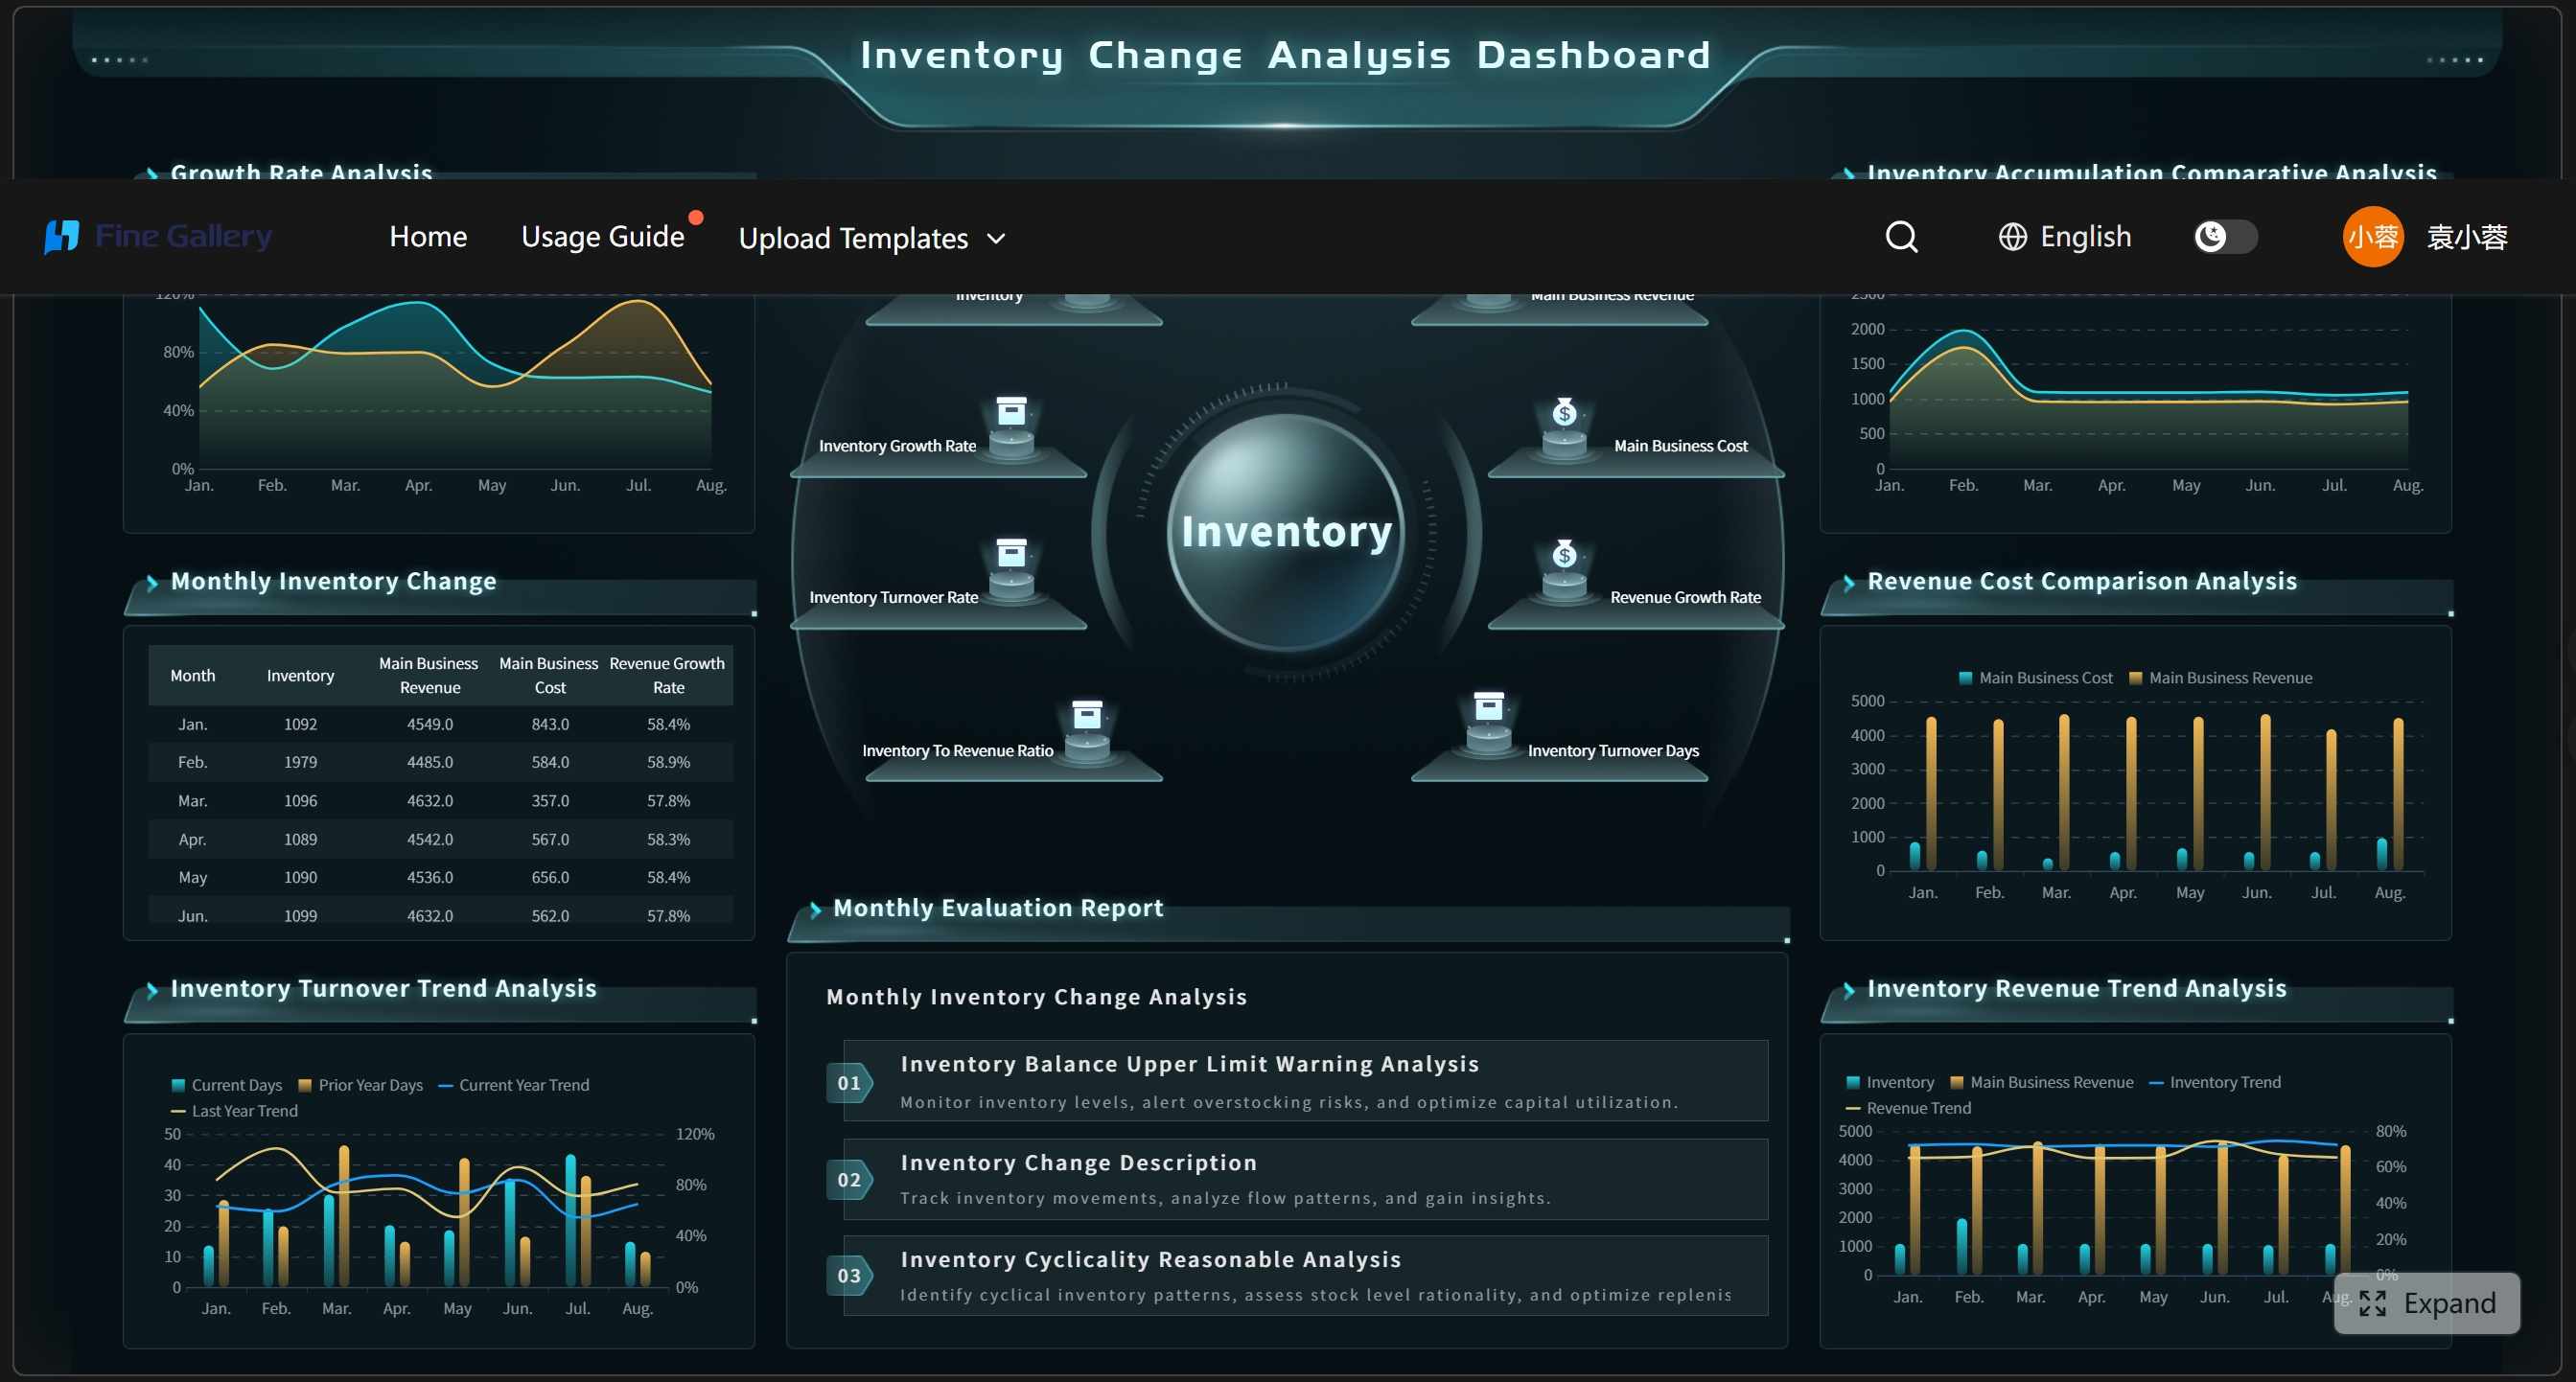 An executive HR dashboard connects workforce metrics with business decisions.
The most important HR dashboard areas are:
An executive HR dashboard connects workforce metrics with business decisions.
The most important HR dashboard areas are: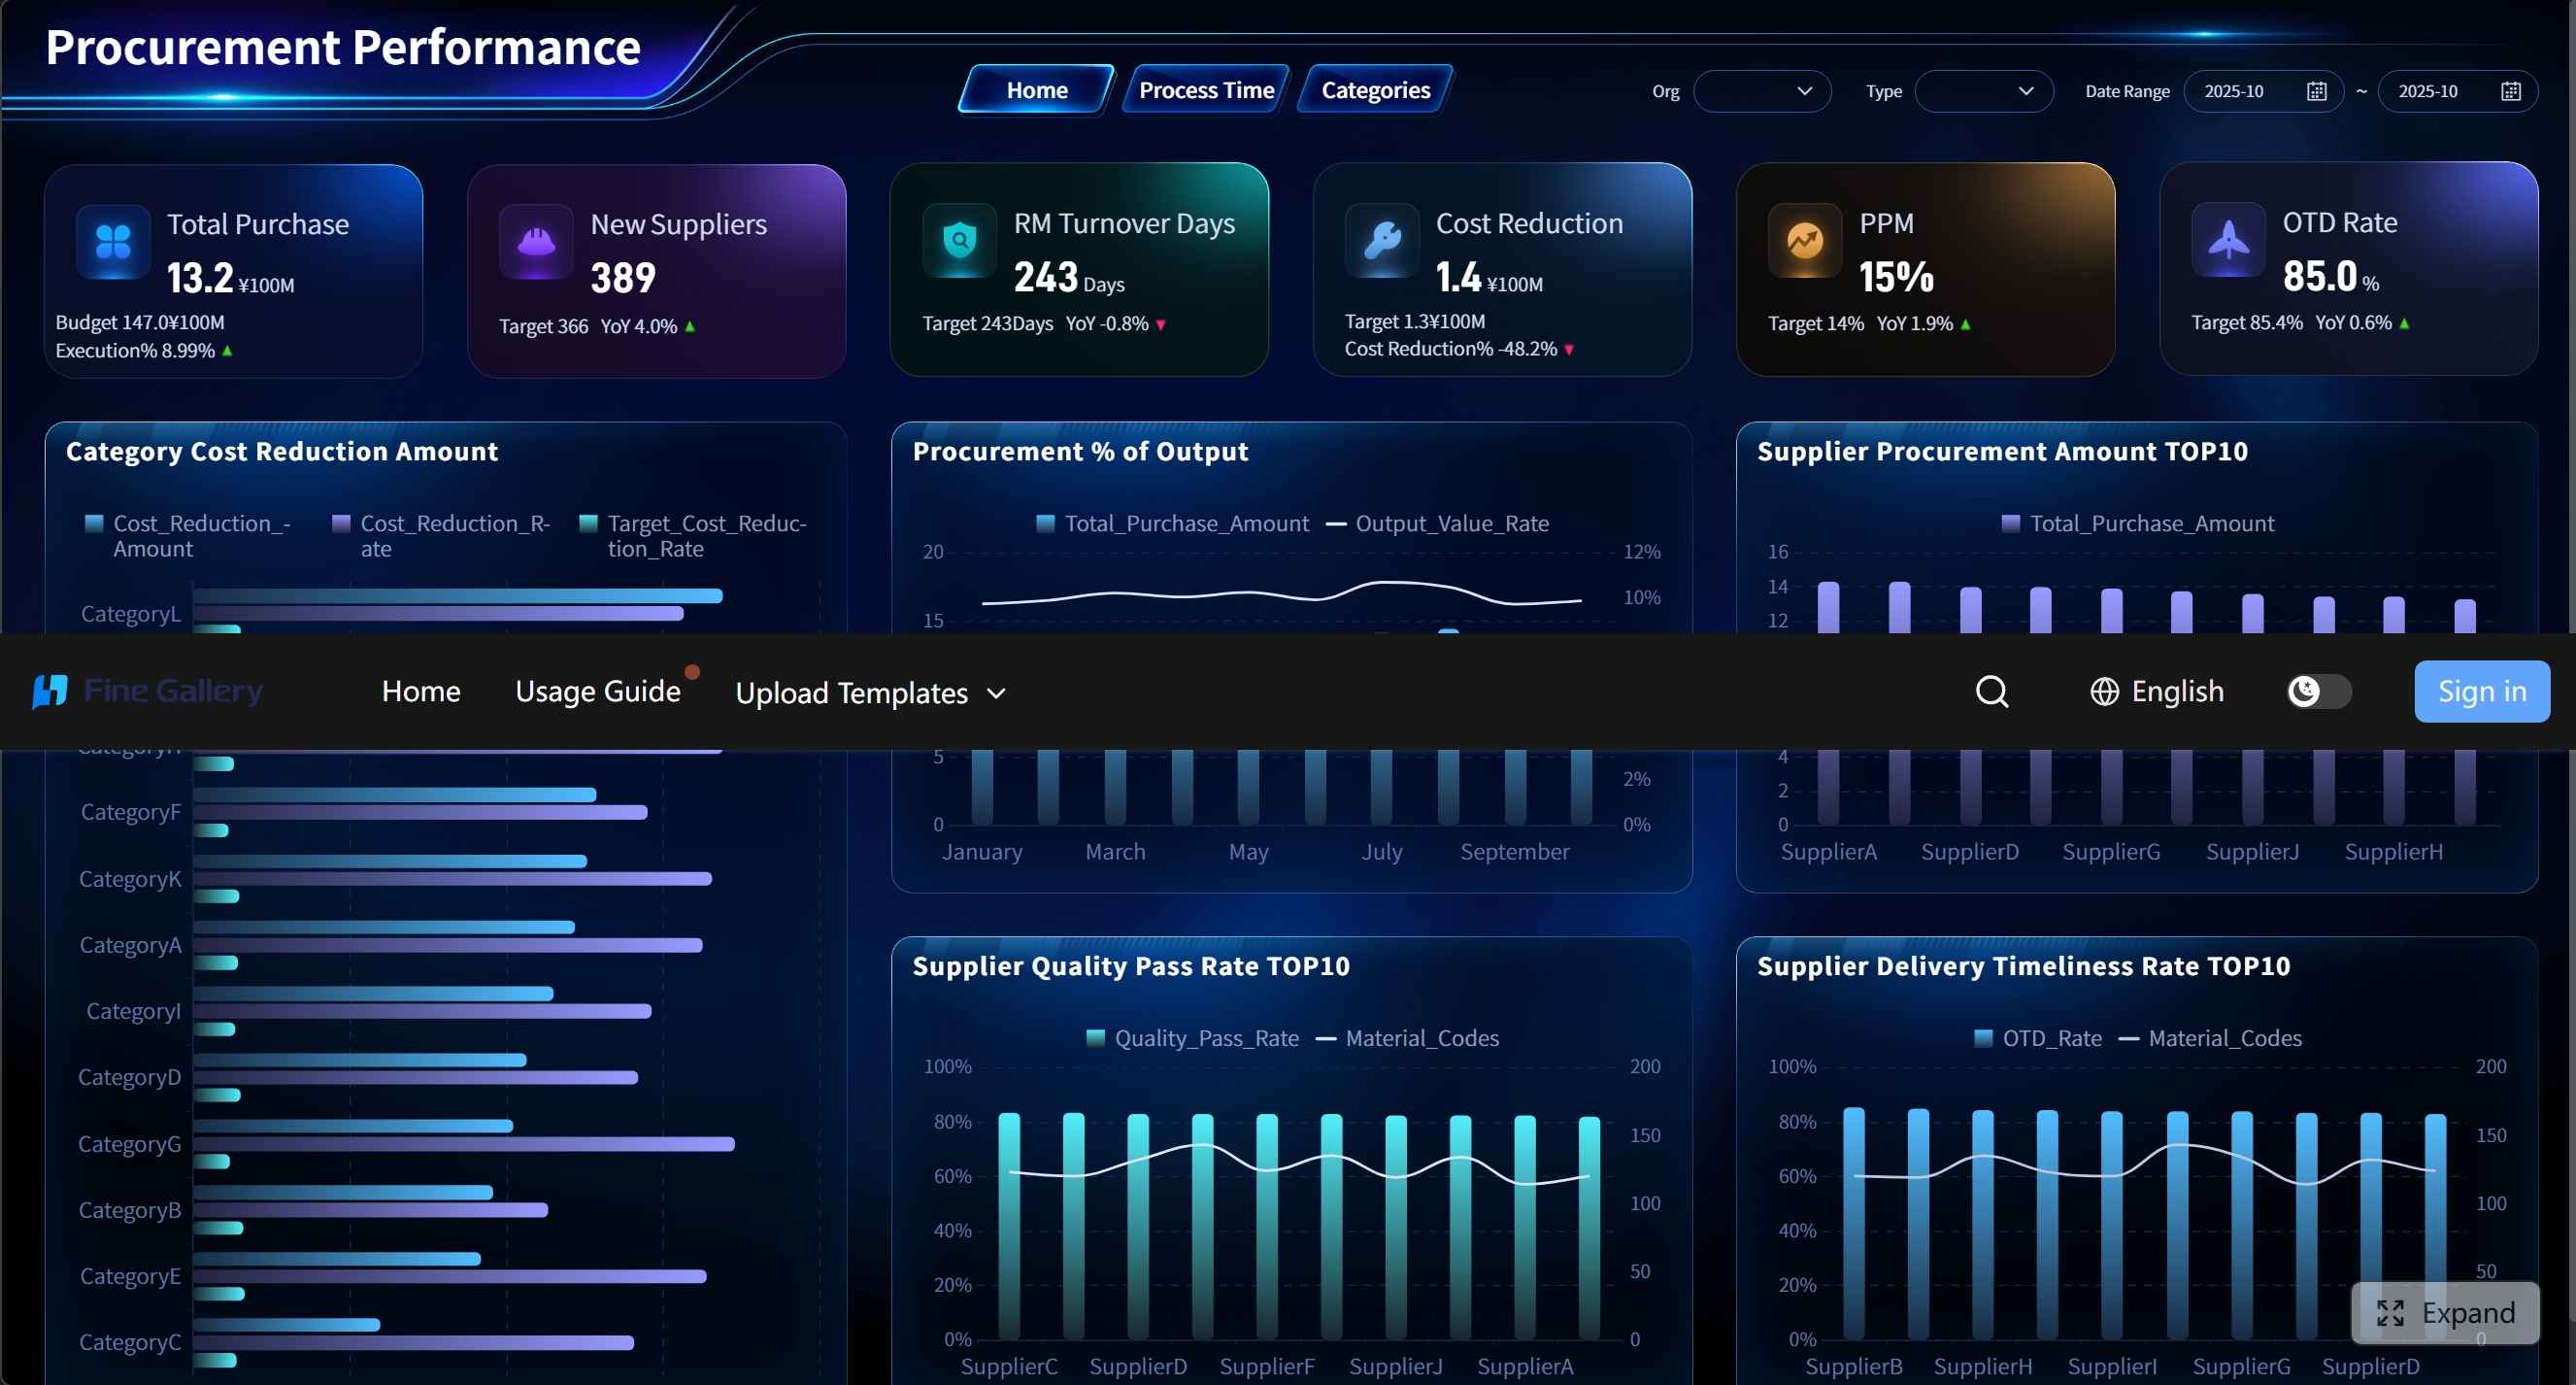
 Headcount dashboards help leaders monitor workforce capacity across teams and regions.
Executive users need summary metrics with drill-down capability, not recruiter-level workflow clutter on the main page. Separate the dashboard into:
Headcount dashboards help leaders monitor workforce capacity across teams and regions.
Executive users need summary metrics with drill-down capability, not recruiter-level workflow clutter on the main page. Separate the dashboard into: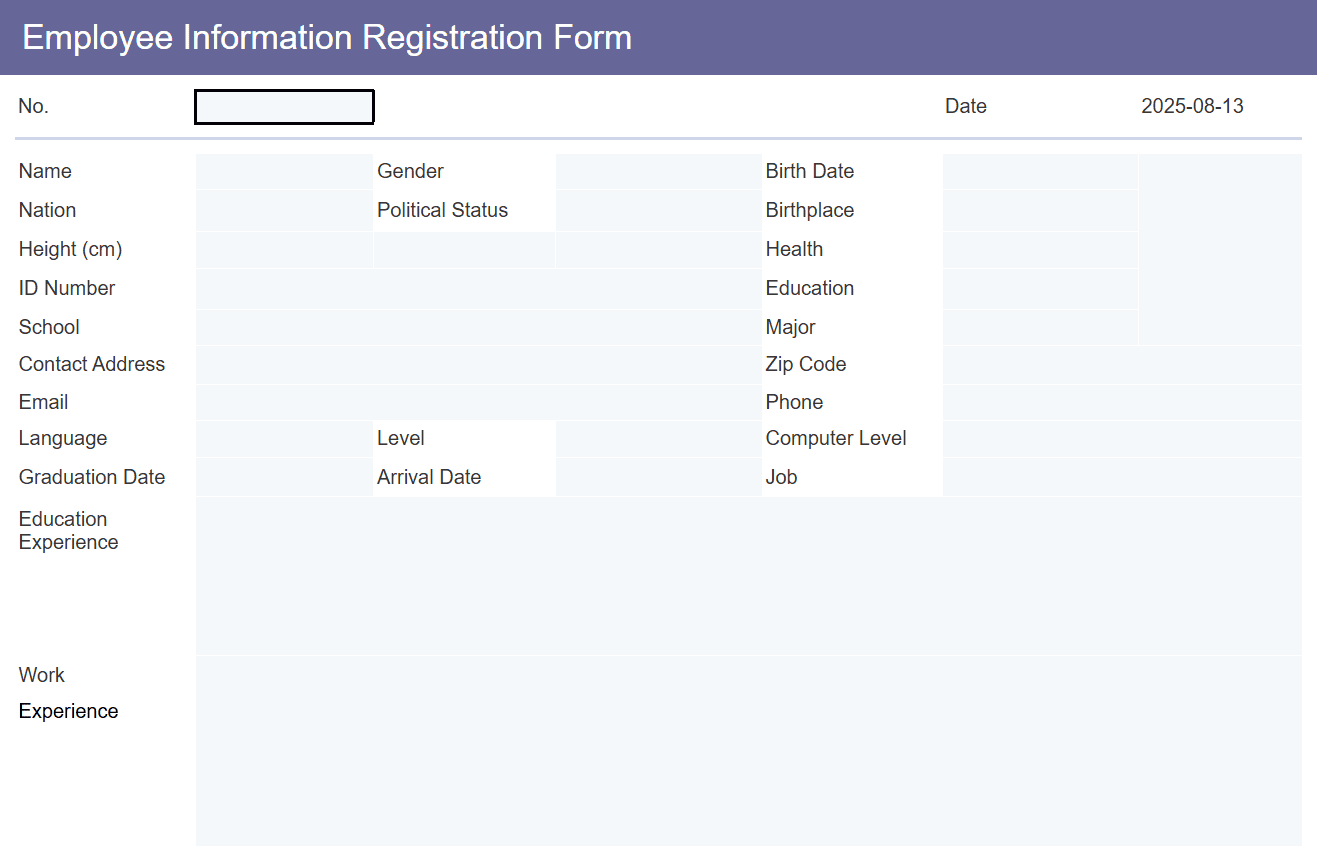 Turnover analysis helps HR leaders identify retention risks in critical teams.
Examples include:
Turnover analysis helps HR leaders identify retention risks in critical teams.
Examples include: