
The 10% Problem: Why Everyone Sees Dashboards But No One Sees BI
"So you're in big data?" My friend finally understood — not when I explained dimensional modeling, not when I described ETL pipelines, not when I talked about slowly changing dimensions. He understood only when I said the word "dashboards."
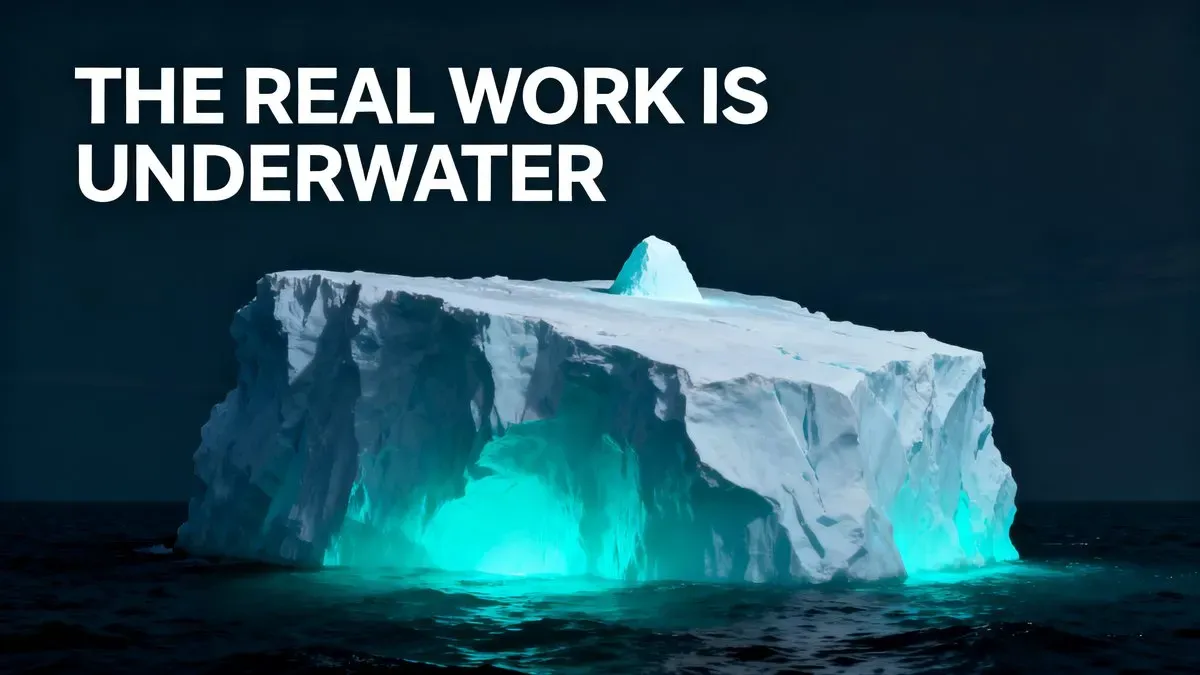
That moment of recognition was brutally honest. It revealed a deafening cognitive dissonance in how the entire industry talks about Business Intelligence. The visualization is the visible 10%. The real work happens underwater, in the crushing depths where no one looks and no one credits. We have built an entire profession that does its most critical work in invisibility — and then gets judged by the decorative surface.
The Siege No One Sees
Here's the agonizing friction: everyone sees the chart. No one sees the siege that built it.
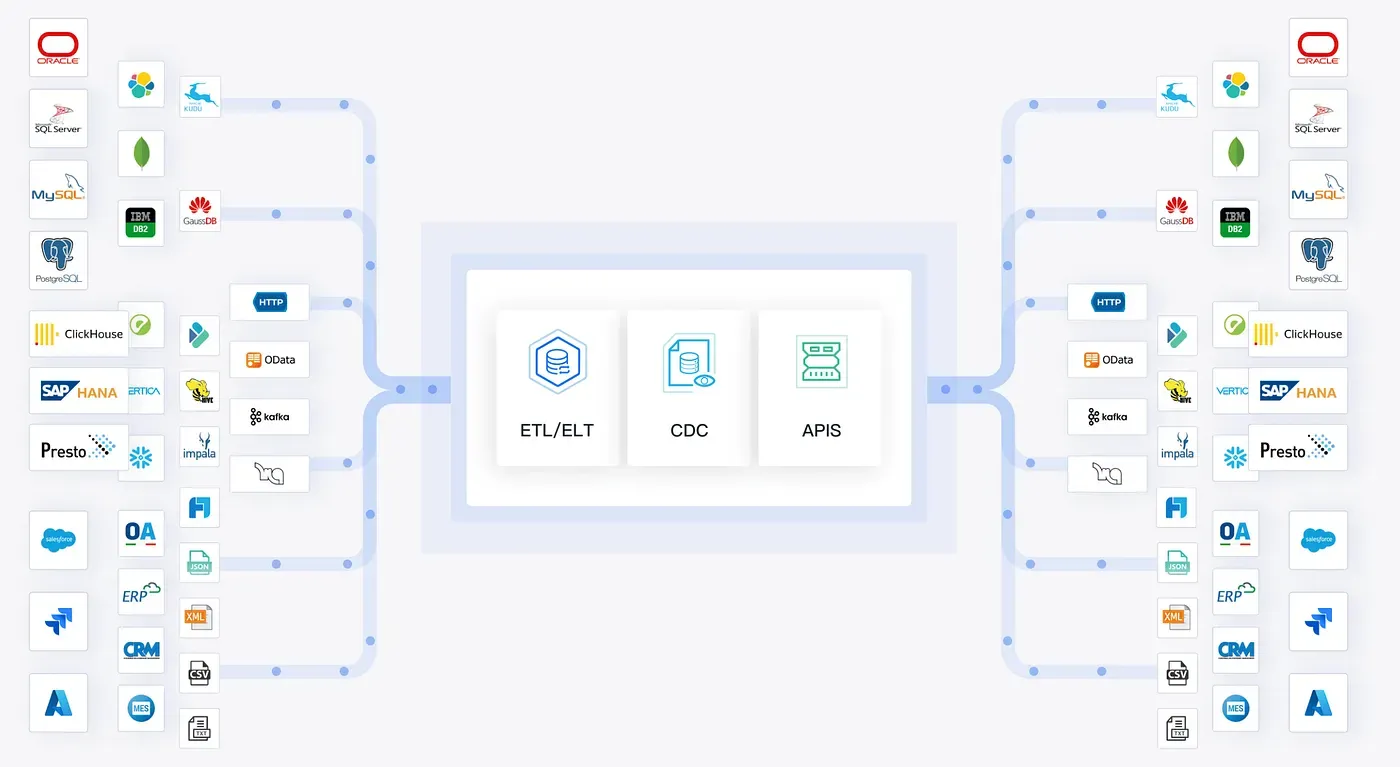
Before any pixel renders on a dashboard, data must be extracted from ERP, CRM, OA, and a dozen other systems — each speaking different dialects, each hoarding its own fragmented truth, each stubbornly resisting integration. Then comes transformation: wrong formats that refuse to align, duplicates that multiply like weeds, missing values that leave gaping holes in your analysis, business rules that contradict between systems with breathtaking audacity.
One manufacturing client discovered 24 abnormal data scenarios from a single workflow bug. Two weeks just to code the exceptions. Two weeks of engineering time consumed not by innovation — but by damage control.
The Data Warehouse Is Not Storage. It's a Refinery.
Think of your enterprise data as grain scattered across small warehouses. ERP has some. CRM has more. OA holds yet another batch. Each structured differently, some already spoiled, lots of duplication, and absolutely no common catalog.
A data warehouse moves everything to one central silo — but not blindly, not carelessly:
- Extract: Choose truck, plane, or ship depending on volume and urgency — each source demands its own transport strategy.
- Transform: Remove the rot, merge the duplicates, repackage everything consistently so that what arrives at the destination is clean and usable.
- Load: Stack by category for fast retrieval, so that when a business question arrives, the answer is already shelved and waiting.
This is not a cosmetic upgrade. This is core architectural restructuring: turning scattered, rotting grain into clear, living water that flows precisely where decisions need it. Without it, your dashboard is a skyscraper built on sand.
From "What Happened" to "Why It Happened"
Same database technology underneath. Completely different purpose.
The shift from operational systems to analytical systems — from "record what happened" to "analyze why it happened" — is not semantic. It is architectural. The data warehouse is the infrastructure that makes the visible 10% actually trustworthy. Then load and model: dimensions, metrics, relationships, history tracking. Only then — only after this entire underwater siege — do charts appear.
Business Understanding Beats Technical Tools. Every Time.
Here is the ruthlessly simple truth that separates competent BI from decorative BI: business understanding beats technical tools. Every time. Not sometimes. Not usually. Every time.
The best BI developers I know spend more time in business meetings than writing SQL. They sit with operations teams. They learn the contradictions before they code the exceptions. They understand the business rule that says "this field means X in System A but Y in System B" before they attempt to merge those fields.
This is not about more dashboards. This is about more understanding — and the engineering discipline to encode that understanding into data pipelines that run reliably at 3 AM when no one is watching.
The Industry Has Been Selling the Surface
The industry has spent decades selling the surface and starving the foundation. We pitch dashboards to executives who want quick answers. We demo visualizations that look stunning in boardrooms.
Meanwhile, the underwater engine — the extraction, the transformation, the modeling, the exception handling — runs on overtime and underfunding. The "T" in ETL is where projects live or die, and where most "agile" tools cut corners they cannot afford.
The Real Engine Is Underwater
In the next era of enterprise intelligence, the question is simple:
Will you be the one still pointing at pretty charts and calling it BI — or will you be the one who finally dives underwater, where the real engine runs, where the real value lives, where the real work demands respect?
Got questions? Ping me on Linkedin.

Article by
Saber Chen
AI Product Architect & CPO
Saber has 15 years of experience in enterprise software, where he has guided 43,000+ clients and managed teams of 500+, building top-tier data intelligence solutions. When not building scalable B2B architecture, he's on the basketball court or diving into vibe coding.


Keep Learning
 Fast Answers Are Not Enough: Why Data Agents Need AI-Ready Data
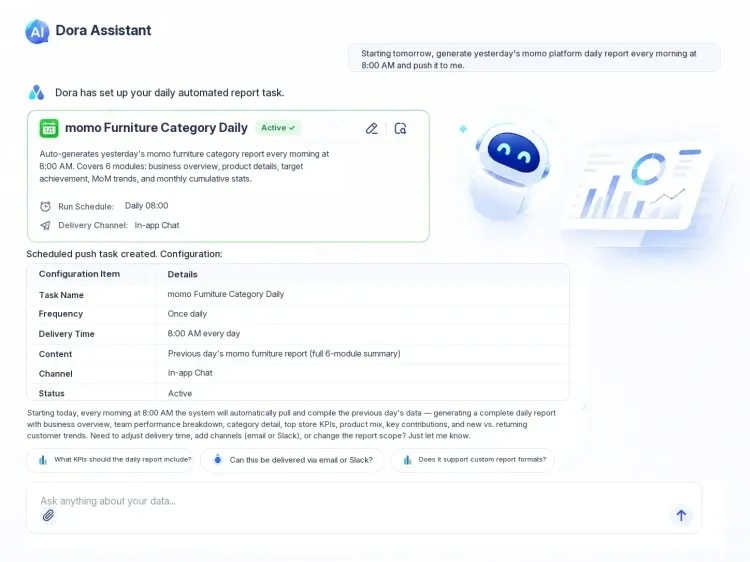
See why enterprise Data Agents need AI-ready data—and how trusted metrics, traceable sources, secure access, timely updates, and business context build trust.
 The Next Step for Enterprise AI: From Productivity Tools to Data Agents That Get Work Done
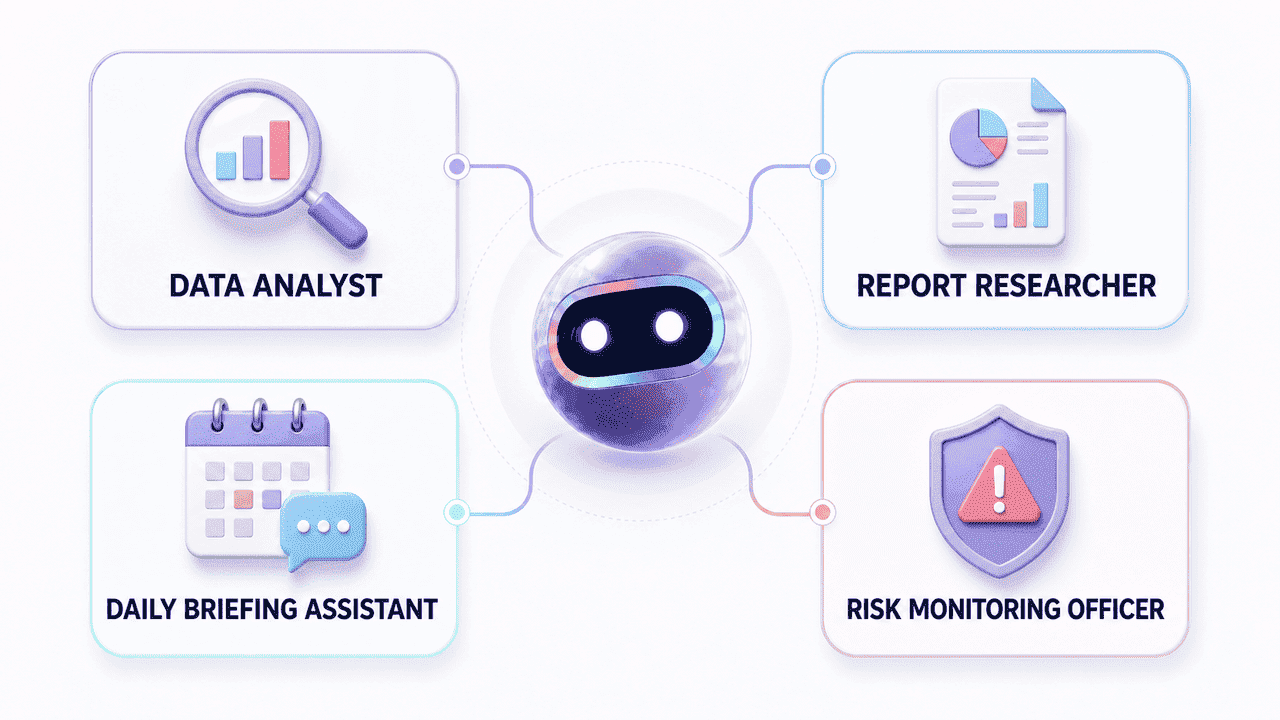
See how enterprise AI is evolving from productivity tools to Data Agents like Dora, which turn trusted BI into analysis, reports, alerts, and action.
 Uncovering the Truth Behind AI Delivery: Why Seemingly Perfect Strategies Fail in Enterprise Deployments
Struggling to move AI from prototype to production? Uncover the hidden truths behind AI product delivery and learn to deploy solutions that actually work.